 |
|
|
|
|
|
|
| ||||||||||
|
|
|
|
|
|
|
||||
| ||||||||||
|
|
|
|
|
Persons using assistive technology might not be able to fully access information in this file. For assistance, please send e-mail to: mmwrq@cdc.gov. Type 508 Accommodation and the title of the report in the subject line of e-mail. Surveillance of Certain Health Behaviors Among States and Selected Local Areas --- United States, 2005Pranesh P. Chowdhury, MPH, Lina Balluz, ScD, Wilmon Murphy, Xiao-Jun Wen, MD, Yuna Zhong, MD, Catherine Okoro, MS, Bill Bartoli,
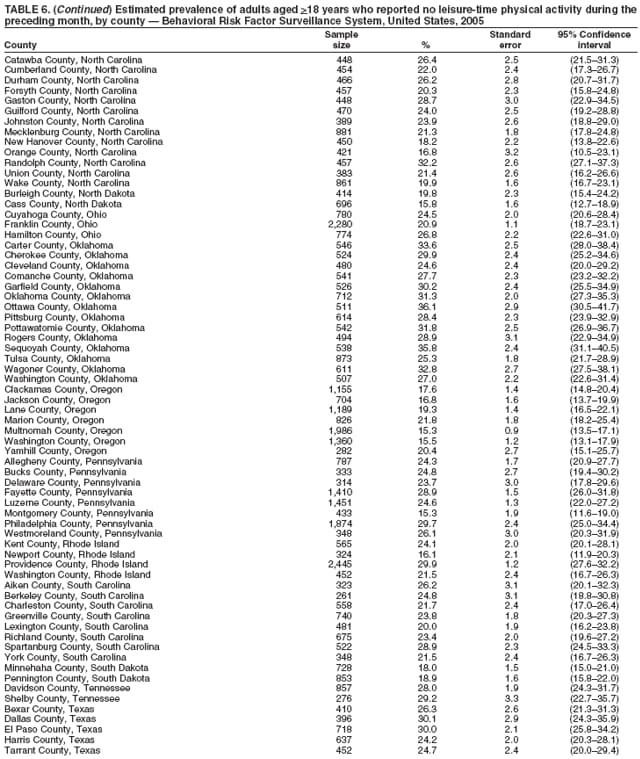
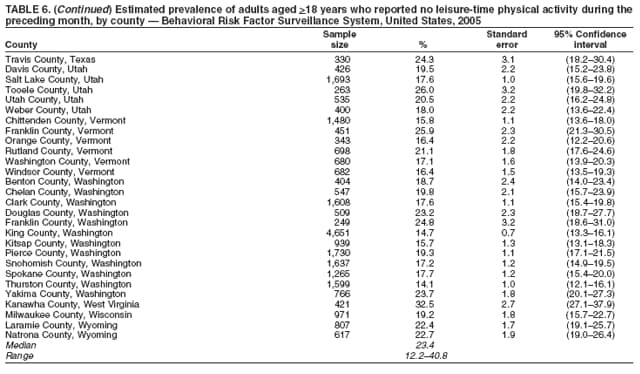
Bill Garvin, Machell Town, MS, Wayne Giles, MD, Ali Mokdad, PhD Corresponding author: Lina Balluz, MPH, Division of Adult and Community Health, National Center for Chronic Disease Prevention and Health Promotion, MS K-66, 4770 Buford Hwy, N.E., Atlanta, GA 30341. Telephone: 770-488-2466; Fax: 770-488-8150; E-mail: lballuz@cdc.gov. AbstractProblem: Behavioral risk factors such as smoking, poor diet, physical inactivity, and excessive drinking are linked to the leading causes of death in the United States. Controlling these behavioral risk factors and using preventive health services (e.g., influenza and pneumococcal vaccination of adults aged >65 years and hypertension and cholesterol screenings) can substantially reduce the morbidity and mortality in the U.S. population. Continuous monitoring of these behaviors and preventive services are essential for developing health promotion, intervention programs, and health policies at the state, city, and county level. Reporting Period Covered: Data collected in 2005 are presented for states/territories, selected metropolitan and micropolitan statistical areas (MMSAs), metropolitan divisions, and selected counties. Description of the System: The Behavioral Risk Factor Surveillance System (BRFSS) is an ongoing, state-based, random-digit--dialed telephone survey of the noninstitutionalized U.S. population aged >18 years. BRFSS collects information on health risk behaviors and preventive health services related to leading causes of death. All 50 states, the District of Columbia (DC), the Commonwealth of Puerto Rico, and the U.S. Virgin Islands participated in BRFSS during 2005. Within these states and territories, 153 MMSAs and 232 counties that reported data for at least 500 respondents or a minimum sample size of 19 per weighting class were included in the analyses. Results: Prevalence of health-risk behaviors, awareness of specific medical conditions, and use of preventive services varied substantially by state/territory, MMSA, and county. In 2005, prevalence of health insurance ranged from 60% to 95% for states/territories, MMSAs, and counties. Prevalence of leisure-time physical inactivity ranged from 16% to 49% for states/territories, 14% to 36% for MMSAs, and 12% to 41% for counties. Prevalence of adults who engaged in at least moderate physical activity ranged from 33% to 62%, and prevalence of vigorous physical activity ranged from 15% to 42% for states/territories, MMSAs, and counties. Prevalence of adults who currently smoke cigarettes ranged from 6% to 35% for states/territories, MMSAs, and counties. The prevalence of binge drinking was substantially higher than the prevalence of heavy drinking across all the states/territories, MMSAs, and counties. Prevalence of adults who were overweight ranged from 53% to 67 % for states/territories, 49% to 70% for MMSAs, and 44% to 71% for counties. Prevalence of current asthma ranged from 4% to 14% for states/territories, MMSAs, and counties. Prevalence of diabetes ranged from 4% to 14% for states/territories and MMSAs and from 3% to 14% for counties. Proportion of respondents with high blood pressure ranged from 13% to 39% for states/territories, MMSAs and counties. Prevalence of respondents with high cholesterol ranged from 31% to 41% for states/territories and 26% to 47% for MMSAs and counties. The prevalence estimates for respondents who reported being limited in any way in any activities because of physical, mental, or emotional problems ranged from 10% to 27% for states/territories, 12% to 31% for MMSAs, and 10% to 27% for counties. The percentage of respondents who required use of special equipment ranged from 4% to 10% for the states/territories, 3% to 15% for MMSAs, and 3% to 11% for counties. Prevalence of fair or poor health ranged from 11% to 34% for states/territories and 6% to 26% for MMSAs and counties. The prevalence of adults who checked their cholesterol during the preceding 5 years ranged from 55% to 86% for states/territories, MMSAs, and counties. Prevalence of annual influenza vaccination among adults aged >65 years ranged from 32% to 78% for states/territories, 48% to 83% for MMSAs, and 41% to 84% for counties. The estimated prevalence of pneumococcal vaccination among adults aged >65 years ranged from 28% to 72% for states/territories, 52% to 82% for MMSAs, and 35% to 83% for counties. Interpretation: The findings in this report indicate a wide variation in health-risk behaviors, chronic conditions, and use of preventive services among U.S. adults at the state/territory, MMSA, and county level. The findings underscore a need for continuous efforts to evaluate public health intervention programs and policies designed to reduce morbidity and mortality caused by chronic disease and injury. Public Health Action: The 2005 BRFSS data indicate a need for continued monitoring of health-risk behaviors, specific disease conditions, and use of preventive services to identify high-risk populations and to implement and monitor health-promotion programs and health policies at the state/territory, MMSA, and county level. IntroductionThe goals of national health promotion and disease prevention are to prevent or delay disease, decrease premature mortality, and improve health-related quality of life for all U.S. residents (1). Chronic diseases (e.g., heart disease, cancer, stroke, and diabetes) are the leading cause of death and disability in the United States (2). Engaging in healthy behaviors (e.g., reducing smoking, being more physically active, and eating a nutritious diet) and using preventive services (e.g., screening for blood pressure, blood cholesterol, and cancer and receiving recommended vaccinations) can reduce morbidity and premature mortality from these chronic diseases (3). Monitoring health-risk behaviors and chronic disease conditions and using preventive services to help identify high-risk groups with the greatest need for intervention is important for preventing morbidity and mortality. The Behavioral Risk Factor Surveillance System (BRFSS) is a state-based telephone survey conducted by the state health departments with assistance from CDC. BRFSS is the largest continuously conducted telephone survey in the world with approximately 250,000 adult interviews completed each year. The survey has been a unique source of data for health-risk behaviors, chronic disease conditions, and the use of preventive health services for states since 1984. Since 2002, the large sample size in BRFSS has facilitated calculation of prevalence estimates for selected metropolitan and micropolitan statistical areas (MMSAs), metropolitan divisions, and selected counties. This report provides comparable prevalence estimates for selected risk behaviors, preventive services, and chronic conditions by states/territories, and selected MMSAs and counties. MethodsBRFSS is conducted in all 50 states, the District of Columbia (DC), Guam, Puerto Rico, and Virgin Islands (4). BRFSS uses a multistage sampling design based on random-digit--dialing methods to select a representative sample of the noninstitutionalized civilian population aged >18 years in each state/territory. The primary focus of BRFSS is to monitor health behaviors, health conditions, and preventive services that are linked with the leading causes of death. Details on the design, random sampling procedures, and reliability and validity of measures used in BRFSS have been described previously (5,6). QuestionnaireThe standard BRFSS questionnaire consists of three parts: 1) core questions; 2) optional supplemental modules, which are sets of questions on specific topics (e.g., diabetes, healthy-related-quality-of-life, and arthritis management); and 3) state-added questions. All 50 states, DC, and the three territories ask the same core questions, but optional module and state- added questions are included at their discretion. The 2005 BRFSS questionnaire included core questions related to health status, healthy days, health-care access, leisure-time physical inactivity, diabetes, hypertension awareness, cholesterol awareness, cardiovascular disease, asthma, vaccination, tobacco use, alcohol consumption, demographics, veteran status, disability, arthritis burden, consumption of fruits and vegetables, moderate/vigorous nonoccupational physical activity, human immunodeficiency virus/acquired immunodeficiency syndrome (HIV/AIDS), emotional support, and life satisfaction. In addition, certain states selected some of the following optional modules: action to control high blood pressure (16 states), adult asthma history (22), arthritis management (22), binge drinking (one), cardiovascular disease (21), child vaccination (13), childhood asthma prevalence (24), colorectal cancer screening (seven), diabetes (40), heart attack and stroke (14), home environment (one), indoor air quality (one), influenza (13), intimate partner violence (12), oral health (five), osteoporosis (12), prostate cancer screening (one), random child selection (22), reactions to race (three), secondhand smoke policy (15), sexual violence (20), smoking cessation (13), visual impairment and access to eye care (five), weight control (11), and women's health (11). Additional information is available on the standard questions from the BRFSS website (http://www.cdc.gov/brfss/questionnaires). This report focuses on health-care coverage (having health insurance), health behaviors, chronic disease conditions, health status, and use of preventive services that can be examined using data from BRFSS. Health behaviors included leisure-time physical inactivity, engaging in moderate or vigorous nonoccupational physical activity, current smoking, and heavy and binge drinking. Chronic disease conditions were overweight and obesity, asthma, diabetes, high blood pressure, high blood cholesterol, activity limitation, use of special equipment because of health problems, and fair/poor health status. Use of preventive services included blood cholesterol check during the preceding 5 years and, for adults aged >65 years, influenza and pneumococcal vaccination. Data Collection and ProcessingTrained interviewers administer BRFSS using a computer-assisted telephone interviewing system. Data are collected monthly during the interviewing period within each state/territory. After the monthly interviewing cycle ends, data are submitted to CDC, where they are checked for reliability. Data WeightingCDC edits and aggregates the monthly data files to create a yearly sample for each state. For this analysis, each sample was weighted to the respondent's probability of selection and to the age- and sex-specific population or age-, sex-, and race-specific population data using the 2005 census projections reported by the Census Bureau for each state. State level weights were adjusted to produce MMSA level weights and county level weights. These sampling weights were used to calculate BRFSS state/territory, MMSA, and county level prevalence estimates. MMSAs used in this report were defined by the Office of Management and Budget in June 2003. Respondents were assigned to a particular MMSA on the basis of their Federal Information Processing Standard (FIPS) county code. Aggregated data from states were used to produce national prevalence estimates. Detailed weighting and analytic methodologies have been documented else where (6). Statistical AnalysesSAS® and SUDAAN® (release 9.0.1; Research Triangle Institute, Research Triangle Park, North Carolina) were used in the analyses to account for the complex sampling design and calculate prevalence estimates, the standard errors, and 95% confidence intervals (CIs) (7). MMSAs with >500 respondents or >19 respondents per weighting class were included. Within each MMSA or county, weighting classes were based on age and sex cross-classification totals or age, sex, and race cross-classification totals. Weighting classes were collapsed if sample sizes were <19. Statistics for selected MMSAs and counties were reported "NA" if the unweighted sample size for the denominator was <50 or the confidence interval half width was >10. In 2005, a total of 356,112 interviews were completed. Data from all 50 states, DC, Puerto Rico, the U.S. Virgin Islands, 153 MMSAs, and 232 counties are included in this report. ResultsIn 2005, the number of interviews completed ranged from 2,544 in the U.S. Virgin Islands to 23,303 in Washington. The Council of American Survey and Research Organization (CASRO) response rates ranged from 34.6% in New Jersey to 72.7% in Puerto Rico (median: 51.4%); the cooperation rates ranged from 58.7% in California to 87.4% in Puerto (median: 75.1%). Health-Care CoverageHealth-care coverage was defined as respondents having reported private health insurance, prepaid plans (e.g., health maintenance organizations) or government plans (e.g., Medicare). In 2005, the median estimated prevalence of adults who had health-care coverage was 85.5% in states/territories. The estimated prevalence ranged from 69.9% (CI = 67.6%--72.2%) in the Virgin Islands to 93.0% (CI = 91.6%--94.4%) in Minnesota (median: 85.5%) (Table 1). Among selected MMSAs, the estimate prevalence ranged from 60.2% (CI = 55.7%--64.7%) in El Paso, Texas, to 94.1% (CI = 92.5%--95.7%) in Minneapolis-St. Paul-Bloomington, Minnesota-Wisconsin (median: 85.9%) (Table 2). Among selected counties, the estimated prevalence ranged from 60.2% (CI = 55.7%--64.7%) in El Paso County, Texas, to 95.4% (CI = 92.9%--97.9%) in Hennepin County, Minnesota (median: 86.2%) (Table 3). Health-Risk BehaviorsLeisure-Time Physical Inactivity Leisure-time physical activity was measured by respondent's indication of no participation in exercise (e.g., running, calisthenics, golf, gardening, or walking) other than their regular job during the preceding month. In 2005, the estimated prevalence of leisure-time physical inactivity in adults by state/territory ranged from 16.2% (CI = 14.6%--17.8%) in Minnesota to 49.0% (CI = 46.9%--51.1%) in Puerto Rico (median: 23.9%) (Table 4). Among the selected MMSAs, the estimated prevalence ranged from 14.1% (CI = 12.1%--16.1%) in Olympia, Washington, to 36.1% (CI = 30.5%--41.7%) in Miami, Oklahoma (median: 23.2%) (Table 5); among counties, the estimated prevalence leisure-time physical inactivity ranged from 12.2% (CI = 9.2% -- 15.2%) in Hennepin County, Minnesota, to 40.8% (CI = 36.1%--45.5%) in Hudson County, New Jersey (median: 23.4%) (Table 6). Moderate and Vigorous Physical Activity Respondents were asked about the frequency and duration of both moderate and vigorous nonoccupational physical activities they engaged in during a usual week. Sufficient moderate physical activity was defined as engaging in activity that caused small increases in breathing or heart rate on at least 5 days per week for at least 30 minutes each day. Sufficient vigorous physical activity was defined as engaging in activity that caused large increases in breathing or heart rate on 3 or more days per week for at least 20 minutes each day. Respondents who engaged in sufficient moderate physical activity or sufficient vigorous physical activity were considered to be engaged in at least moderate physical activity. Respondents who engaged in sufficient vigorous physical activity were considered to meet the guidelines for engaging in sufficient vigorous physical activity. In 2005, prevalence of adults who reported at least moderate physical activity by state/territory ranged from 32.6% (CI = 30.5%--34.7%) in Puerto Rico to 59.2% (CI = 56.4%--62.0%) in Alaska (median: 48.7%) (Table 7). Among MMSAs, the prevalence of at least moderate physical activity ranged from 35.8% (CI = 31.6%--40.0%) in Nashville-Davidson-Murfreesboro, Tennessee, to 61.5% (CI = 56.6%--66.4%) in Keene, New Hampshire (median: 49.4%) (Table 8); among counties, the prevalence ranged from 34.2% (CI = 28.7%--39.7%) in Jefferson County, Kentucky, to 61.5% (CI = 56.6%--66.4%) in Cheshire County, New Hampshire (median: 49.3%) (Table 9). Prevalence of adults who reported sufficient vigorous physical activity by state/territory ranged from 16.8% (CI = 15.3%--18.3%) in Kentucky to 36.2% (CI = 34.5%--37.9%) in California (median: 27.4%) (Table 10). Among MMSAs, the prevalence of sufficient vigorous physical activity ranged from 15.2% (CI = 11.6%--18.8%) in Charleston, West Virginia, to 38.0% (CI = 33.2%--42.8%) in San Diego-Carlsbad-San Marcos, California (median: 28.0%) (Table 11); among counties, the prevalence ranged from 15.7% (CI = 10.5%--20.9%) in Wyandotte County, Kansas, to 41.6% (CI = 34.5%--48.7%) in Douglas County, Colorado (median: 28.2%) (Table 12). Current Cigarette SmokingRespondents were classified as current smokers if they reported having smoked at least 100 cigarettes during their lifetime and acknowledged smoking every day or some days at the time of survey. In 2005, the estimated prevalence of adults who were classified as current cigarette smokers among states/territories ranged from 8.1% (CI = 6.8%--9.4%) in the Virgin Islands to 28.7% (CI = 27.0%--30.4%) in Kentucky (median: 20.5%) (Table 13). The prevalence of current cigarette smoking among selected MMSAs ranged from 6.8% (CI = 4.3%--9.3%) in Provo-Orem, Utah, to 31.0% (CI = 24.5%--37.5%) in McAlester, Oklahoma (median: 20.6%) (Table 14); among counties, the prevalence ranged from 6.6% (CI = 4.1%--9.1%) in Utah County, Utah, to 34.8% (CI = 28.6%--41.0%) in Lake County, Indiana (median: 19.8%) (Table 15). Alcohol ConsumptionBinge Drinking Binge drinking was defined as having five or more drinks on at least one occasion during the preceding month. In 2005, the estimated prevalence of binge drinking among adults by state/territory ranged from 8.3% (CI = 7.2%--9.4%) in Utah to 22.1% (CI = 20.5%--23.7%) in Wisconsin (median: 14.4%) (Table 16). Among selected MMSAs, the prevalence of binge drinking ranged from 3.0% (CI = 1.0%--5.0%) in Provo-Orem, Utah, to 20.3% (CI = 16.3%--24.3%) Lincoln, Nebraska (median: 14.1%) (Table 17); among counties, the prevalence ranged from 2.9% (CI = 0.9%-- 4.9%) in Utah county, Utah, to 26.0% (CI = 21.2%--30.8%) in Denver County, Colorado (median: 14.1%) (Table 18). Heavy Drinking At risk for heavy drinking was defined as an average of two or more drinks per day during the preceding month for men and an average of more than one drink per day during the preceding month for women. In 2005, the prevalence of adults who were at risk for heavy drinking by state/territory ranged from 2.7% (CI = 2.0%--3.4%) in Kentucky to 7.5% (CI = 6.5%--9.5%) in Wisconsin (median: 4.9%) (Table 19). Among the MMSAs, the prevalence of adults who were at risk for heavy drinking ranged from 1.7% (CI = 0.5%--2.9%) in Scottsbluff, Nebraska, to 10.0% (CI = 7.8%--12.2%) in Reno-Sparks, Nevada (median: 4.8%) (Table 20); among counties, the prevalence ranged from 1.5% (CI = 0.2%--2.8%) in Tooele County, Utah, to 10.1% (CI = 5.2%--15.0%) in Travis County, Texas (median: 4.8%) (Table 21). Chronic ConditionsOverweight and Obesity Self-reported weight and height were used to calculate body mass index (BMI) (weight [kg]/height [m2]). Respondents were classified as obese if their BMI was >30.0. Overweight/obese was classified as BMI >25.0. Obesity analyses were restricted to adults aged >20 years in accordance to Healthy People 2010 objectives (1). Overweight. In 2005, prevalence of overweight among adults by state/territory ranged from 53.0% (CI = 51.3%--54.7%) in Hawaii to 67.3% (CI = 65.5%--69.1%) in Mississippi (median: 61.5%) (Table 22). Among the selected MMSAs, the prevalence of overweight adults ranged from 49.0% (CI = 43.9%--54.1%) in Provo-Orem, Utah, to 70.4% (CI = 65.7%--75.1%) in Tahlequah, Oklahoma (median: 61.5%) (Table 23); among counties, the estimated prevalence ranged from 43.8% (CI = 39.3%--48.3%) in New York County, New York, to 70.9% (CI = 64.5%-- 77.3%) in Berkeley County, South Carolina (median: 60.9%) (Table 24). Obesity. The estimated prevalence of obesity among adults aged >20 years by state/territory ranged from 18.2% (CI = 17.0%--19.4%) in Colorado to 31.8% (CI = 29.7%--33.9%) in Louisiana (median: 24.9%) (Table 25). Among the selected MMSAs, the prevalence of obesity ranged from 16.0% (CI = 11.9%--20.1%) in Santa Fe, New Mexico, to 35.6% (CI = 29.7%--41.5%) in Huntington-Ashland, West Virginia-Kentucky-Ohio (median: 24.7%) (Table 26); among counties, the estimated prevalence ranged from 14.6% (CI = 11.3%--17.9%) in New York County, New York, to 33.4% (CI = 27.2%--39.6%) in Wagoner County, Oklahoma (median: 24.2%) (Table 27). Asthma Respondents were defined as having current asthma if they had ever been told by a doctor, nurse, or other health-care professional that they had asthma and reported that they still have asthma at the time of survey. In 2005, prevalence of current asthma ranged from 4.4% (CI = 3.4%--5.4%) in the U.S. Virgin Islands to 10.7% (CI = 9.5%--11.9%) in Rhode Island (median: 8.0%) (Table 28). Among selected MMSAs, the estimated prevalence ranged from 4.3% (CI = 2.8%--5.8%) in Winston-Salem, North Carolina, to 12.3% (CI = 9.9%--14.7%) in Spokane, Washington (median: 8.2%) (Table 29); among selected counties, the estimated prevalence ranged from 3.8% (CI = 1.8%--5.8%) in Washington County, Arkansas, to 13.9% (CI = 9.2%--18.6%) in Franklin County, Vermont (median: 8.0%) (Table 30). Diabetes Respondents were classified as having diabetes if they had ever been told by a doctor that they had diabetes. Gestational diabetes was not included in the reported estimates. In 2005, the estimated prevalence ranged from 4.4% (CI = 3.4%--5.4%) in Alaska to 12.5% (CI = 11.3%--13.7%) in Puerto Rico (median: 7.3%) (Table 31). Among selected MMSAs, the estimated prevalence ranged from 3.6% (CI = 1.9%--5.3%) in Santa Ana-Anaheim-Irvine, California, to 12.5% (CI = 9.8%--15.2%) in Charleston, West Virginia (median: 7.2%) (Table 32); among selected counties, prevalence of diabetes ranged from 2.4% (CI = 0.6%--4.2%) in Douglas County, Colorado, to 14.0% (CI = 8.4%--19.6%) in Pinellas County, Florida (median: 7.2%) (Table 33). High Blood Pressure Respondents aged >20 years were classified as having high blood pressure if they were told by a health-care professional that their blood pressure was high. Hypertension during pregnancy was not included in the reported estimates. In 2005, the estimated prevalence of high blood pressure ranged from 19.2% (CI = 17.9%--20.5%) in Utah to 34.8% (CI = 33.1%--36.5%) in Mississippi (median: 26.2%) (Table 34). Among selected MMSAs, the estimated prevalence ranged from 13.9% (CI = 11.1%--16.7%) in Provo Orem, Utah, to 39.3% (CI = 33.3%--45.3%) in Ardmore, Oklahoma (median: 25.6%) (Table 35); among selected counties, the estimated prevalence ranged from 13.5% (CI = 9.7%--17.3%) in Travis County, Texas, to 38.9% (CI = 33.8%--44.0%) in Carter County, Oklahoma (median: 25.6%) (Table 36). High Blood Cholesterol Respondents aged >20 years were classified as having high blood cholesterol if they were told by a health-care professional that their blood cholesterol was high. The estimated prevalence of high blood cholesterol ranged from 30.9% (CI = 28.7%--33.1%) in Louisiana to 40.6% (CI = 38.6%--42.6%) in West Virginia (median: 36.1%) (Table 37). Among selected MMSAs, the estimated prevalence of high blood cholesterol ranged from 26.4% (CI = 22.3%--30.5%) in New Orleans-Metairie-Kenner, Louisiana, to 47.2% (CI = 40.6%--53.8%) in Huntington-Ashland, West Virginia-Kentucky-Ohio (median: 36.2%) (Table 38); among selected counties, the estimated prevalence ranged from 26.4% (CI = 20.1%--32.7%) in Shelby County, Tennessee, to 46.7% (CI = 40.6%--52.8%) in Yuma County, Arizona (median: 36.1%) (Table 39). Disability For this analysis, two dimensions of disability were defined: limitation of activity because of physical, mental, or emotional problems and the required use of special equipment. Limited activity. Prevalence estimates for respondents who reported being limited in any way in any activities because of physical, mental, or emotional problems ranged from 9.7% (CI = 8.3%--11.1%) in the U.S. Virgin Islands to 27.4% (CI = 25.7%--29.1%) in West Virginia (median: 18.6%) (Table 40). Among MMSAs, the prevalence ranged from 12.1% (CI = 9.2%--15.0%) in Santa-Ana-Anaheim-Irvine, California, to 30.5% (CI = 25.0%--36.0%) in Huntington-Ashland, West Virginia-Kentucky-Ohio (median: 18.4%) (Table 41). Among counties, the prevalence of respondents who reported limited activities ranged from 9.5% (CI = 6.9%--12.1%) in Hunterdon County, New Jersey, to 26.6% (CI = 21.9%--31.3%) in Pottawatomie County, Oklahoma (median: 17.8%) (Table 42). Use of special equipment. Respondents were asked if they have health problem(s) that required the use of special equipment (e.g., cane, wheelchair, special bed, or special telephone). The percentage of respondents who required use of special equipment ranged from 3.6% (CI = 2.8%--4.4%) in the U.S. Virgin Islands to 9.6% (CI = 8.6%--10.6%) in West Virginia (median: 6.2%) (Table 43). Among MMSAs, the use of special equipment ranged from 3.1% (CI = 1.7%--4.5%) in Santa Ana-Anaheim-Irvine, California, to 15.4% (CI = 11.0%--19.8%) in Huntington-Ashland, West Virginia-Kentucky-Ohio (median: 5.9%) (Table 44). Among counties, prevalence of use of special equipment ranged from 2.7% (CI = 1.5%--3.9%) in Hunterdon County, New Jersey, to 10.6% (CI = 5.3%--15.9%) in Yamhill County, Oregon (median: 5.8%) (Table 45). Health StatusFor this analysis, one question that asked respondents to rate their general health on a scale from excellent to poor health was used to assess general health status. Health status was dichotomized into good health (i.e., excellent, very good, or good health) and fair or poor health. Prevalence of fair or poor health ranged from 11.1% (CI = 10.2%--12.0%) in New Hampshire to 34.1% (CI = 32.2%--36.0%) Puerto Rico (median: 14.9%) (Table 46). Among MMSAs, the prevalence of fair and poor health ranged from 5.5% (CI = 2.9%--8.1%) in Fargo, North Dakota-Minnesota, to 26.4% (CI = 21.3%--31.5%) in Huntington-Ashland, West Virginia-Kentucky-Ohio (median: 14.5%) (Table 47); among counties, the prevalence ranged from 6.1% (CI = 3.6%--8.6%) in Sarpy County, Nebraska, to 26.2% (CI = 22.0%--30.4%) in Hudson County, New Jersey (median: 14.5%) (Table 48). Preventive ServicesBlood Cholesterol Checked During the Preceding 5 years Respondents aged >18 years were asked about blood cholesterol screening. Respondents who stated that they had ever had their blood cholesterol checked and if they had it checked during the preceding 5 years were classified as having cholesterol screening. The estimated prevalence for blood cholesterol screening ranged from 62.8% (CI = 61.0%--64.6%) in Utah to 81.0% (CI = 79.6%--82.4%) in New Hampshire (median: 73.0%) (Table 49). Among selected MMSAs, the estimated prevalence ranged from 55.2% (CI = 50.7%--59.7%) in El Paso, Texas, to 83.7% (CI = 80.0%--87.4%) in Concord, New Hampshire (median: 74.3%) (Table 50); among selected counties, the estimated prevalence ranged from 55.2% (CI = 50.7%--59.7%) in El Paso County, Texas, to 85.4% (CI = 79.8%--91.0%) in Newport County, Rhode Island (median: 74.9%) (Table 51). Influenza Vaccination In 2005, state-specific prevalence estimates for self-reported influenza vaccination among persons aged >65 years during the preceding 12 months ranged from 32.0% (CI = 28.3%--35.7%) in Puerto Rico to 78.1% (CI = 74.8%--81.4%) in Minnesota (median: 65.5%) (Table 52). Among MMSAs, the prevalence of influenza vaccination ranged from 47.6% (CI = 39.1%--56.1%) in Orlando-Kissimmee, Florida, to 83.3% (CI = 74.7%--91.9%) in Fargo, North Dakota-Minnesota (median: 67.2%) (Table 53); among counties, the prevalence ranged from 40.8% (CI = 32.0%--49.6%) in Miami-Dade County, Florida, to 84.4% (CI = 76.0%--92.8%) in Ramsey County, Minnesota (median: 67.7%) (Table 54). Pneumococcal Vaccination The percentage of persons aged >65 years who reported ever having a pneumococcal vaccination ranged from 28.3% (CI = 24.6%--32.0%) in Puerto Rico to 71.7% (CI = 68.6%--74.8%) in North Dakota (median: 65.7%) (Table 55). Among MMSAs, the prevalence of pneumococcal vaccination ranged from 52.0% (CI = 43.5%--60.5%) in Fayetteville-Springdale-Rogers, Arkansas-Missouri, to 82.2% (CI = 75.4%--89.0%) in Winston-Salem, North Carolina (median: 66.0%) (Table 56); among counties, the prevalence ranged from 34.8% (CI = 26.5%--43.1%) in Miami-Dade County, Florida, to 83.4% (CI = 75.3%--91.5%) in Forsyth County, North Carolina (median: 67.3%) (Table 57). DiscussionThe findings in this report indicate variations in the prevalence of health-care coverage, health-risk behaviors, chronic health conditions, and use of preventive health services among U.S. adults at the state/territory, MMSA, and county level. These variations might reflect regional differences in the demographic factors of respondents, including age, race, and sex distribution of the population; socioeconomic conditions; availability and access to health-care services; state law or local ordinances; and patterns of reimbursement for preventive services (8,9). National health goals exist for certain health behaviors (1). One of the national health targets is to increase the prevalence of at least moderate physical activity to 50% and to increase the prevalence of sufficient vigorous physical activity to 30% (1). Despite the proven health benefit of physical activity (10), prevalence of moderate and vigorous physical activity is still far below the 2010 target. In 2005, approximately 50% of states/territories, MMSAs, and counties had not met the national target for physical activity. The U.S. Task Force on Community Prevention Services recommends that communities develop comprehensive physical activity intervention programs at the local level (11). For example, state-added questions in the 2002 BRFSS helped Montana determine the needs for and preferences of outdoor recreational facilities to promote physical activity. Findings from the state BRFSS survey helped establish the need for walking trails, fishing access sites, and boat ramps (12). Cigarette smoking is the single most preventable cause of death in the United States (13). This report indicates that approximately 95% of states/territories, MMSAs, and counties did not meet the national goal to reduce smoking (target: <12%). Continued implementation of comprehensive tobacco-control programs at the state and local level might help to meet the national target (14). Binge and heavy drinking cause unintentional injuries, falls, violence, sudden infant death syndrome, child neglect, and loss of productivity (15,16). The prevalence of binge drinking was much higher than the prevalence of heavy drinking across all states/territories, MMSAs, and counties, underscoring the need for initiating and strengthening population-based prevention efforts for binge drinking and for heavy drinking. For example, 2003 Selected Metropolitan and Micropolitan Area Risk Trends (SMART) BRFSS data were used by a community coalition to start an antibinge drinking campaign in Fargo, North Dakota, which had a high binge drinking rate (12). The coalition developed an educational campaign, promoted penalties against businesses that did not limit the amount of alcohol served to their customers, and created an intervention that emergency department doctors could use with patients who exhibited high-risk drinking behaviors. Chronic health conditions also are the targets of national health goals (1). Overweight and obesity continue to be critical public health problems (17,18); prevalence of overweight/obesity is >50% in all states, all but one MMSA, and all but two counties. In addition, only three counties met the national obesity target of <15% (1). Extensive public health programs targeting healthy lifestyle are needed to control overweight and obesity at the state and local level (19). Self-rated health is a powerful predictor of mortality and morbidity (20). Large variations in fair or poor health at the state and local level suggest differences in the underlying burden of chronic diseases, health-care coverage, and health behaviors among states/territories, MMSAs, and counties. National targets for receipt of clinical preventive services also have been published. Hypertension and hypercholesterolemia (high blood cholesterol) are important modifiable risk factors for cardiovascular disease (21). BRFSS data indicate that only one of 153 MMSAs and two of 232 counties achieved the national target for high blood pressure (target: <14%), but none of the states/territories, MMSAs, and counties reached the target for the presence of high blood cholesterol (target: <17%). For blood cholesterol screening, 6% of states/territories, 12% of MMSAs, and 23% of counties achieved the 80% target for screening. Additional efforts are needed at the state and local level to reduce the prevalence of hypertension (22) and high cholesterol and to increase screening for high cholesterol (23). Vaccination against pneumonia and influenza for adults aged >65 years is a key public health strategy in the United States (24). The prevalence of vaccination among older adults did not meet the national target at the state or local level (target: >90%). The prevalence was low in Puerto Rico and the U.S. Virgin Islands compared with other states. Strategies, such as patient reminder/recall, multicomponent intervention that include education, reducing client out-of-pocket cost by paying for vaccination and reducing co-payment, and improving procedures at the health-care provider's level (e.g., provider's reminder/recall, standing orders, and providers assessment and feedback), have improved vaccination status among adults and can be employed at the state and local level (25). The CASRO response rate in the 2005 BRFSS was lower than in previous years (26) because of changes in telecommunication usage (more cell phone-only households), reduced participation of racial/ethnic populations, and potential language barriers. However, BRFSS data probably remain reliable and valid. When compared with other national surveys, BRFSS has produced similar prevalence estimates (5). BRFSS sample size increased substantially during the previous decade, from 81,557 in1995 to 356,112 in 2005. To meet current challenges, BRFSS staff has conducted research to evaluate 1) multiple mode data collection-address--based sampling frames and mail surveys, 2) online translations to reach households that speak a language other than English and Spanish, and 3) advance letters distribution. In addition, the BRFSS team has continued its effort to monitor the effect of changes in telecommunication usage (e.g., the increase in cell phone-only households, telephone number portability, and National Do-Not-Call Registry) on survey response. The findings in this report are subject to at least three limitations. First, BRFSS does not collect information from institutionalized persons, thereby excluding persons residing in nursing homes, long-term--care, and correctional facilities. Second, as a self-report survey, BRFSS is subject to recall bias. Third, BRFSS does not include persons residing in households without telephones and those households that use cell phones only. Despite these limitations, BRFSS is a cost effective and timely telephone survey conducted at the state and local level and has the largest sample size of any U.S. health survey. BRFSS data are collected to be used at state and local levels to identify emerging health problems (e.g., monitoring national influenza vaccine shortage), to determine the local high-priority health issues (e.g., determine recreational needs and preferences in Montana), to establish and track national health objectives, and to evaluate public health policies and programs. The findings in this report indicate a need to strengthen efforts in health promotion and disease prevention, particularly at the state and local level, and to continue to monitor health behaviors, chronic disease conditions, and use of preventive services at the state and local levels. References
2005 Behavioral Risk Factor Surveillance System State and Territory Project Coordinators Alabama, Jesse Pevear III, MSPH; Alaska, Rebecca Wells; Arizona, Brian Bender, MBA; Arkansas, LaTonya Steward; California, Marta Induni; Colorado, Jason Gannon; Connecticut, Diane Aye, PhD; Delaware, Fred Breukelman; District of Columbia, John Davies-Cole, PhD; Florida, Melissa Murrary, MS; Georgia, Leah Bryan, MPH, Cynthia Naval, MS; Hawaii, Florentina Reyes-Salvail, MS; Idaho, Teresa Abbott; Illinois, Bruce Steiner, MS; Indiana, Linda Stemnock; Iowa, Donald Shepherd, PhD; Kansas, Catima Potter, MPH; Kentucky, Tracey Sparks; Louisiana, Vicki Scanlan-Leishman, MS; Maine, Kip Neale; Maryland, Helio Lopez, MS; Massachusetts, Zi Zhang, MPH; Michigan, Ann Rafferty, PhD; Minnesota, Nagi Salem, PhD; Mississippi, Ron McAnally; Missouri, Janet S. Wilson, MPA; Montana, Susan J. Cummings; Nebraska, Larry Andelt, PhD; Nevada, Wei Yang, PhD; New Hampshire, Susan Knight, MSPH; New Jersey, Kenneth O'Dowd, PhD; New Mexico, Deborah Klaus, PhD; New York, Colleen Baker; North Carolina, Bob Oldman, MA; North Dakota, Stephen P. Pickard, PhD; Ohio, Patricia (Pullen) Coss; Oklahoma, Derek Pate, MPH; Oregon, Renee K Boyd; Pennsylvania, Robert F. Dewar, MS; Puerto Rico, Ruby A. Serrano-Rodriguez, DrPH(c); Rhode Island, Jana Hesser, PhD; South Carolina, Beili Dong, MD; South Dakota, Mark Gildemaster; Tennessee, David Ridings; Texas, Norma Mcnab, PhD; Utah, Kathy Marti; Vermont, Rodney McCormick, PhD; U.S. Virgin Islands, Sharon A. William, MS; Virginia, Susan K. Spain; Washington, Katrina Wynkoop Simmons, PhD; West Virginia, Fred King; Wisconsin, Anne Ziege, PhD; and Wyoming, Menlo Futa, MA.
2005 Behavioral Risk Factor Surveillance System Team Indu Ahluwalia, PhD; Umed Ajani, MD; Lina Balluz, ScD; William Bartoli, MS; Jody Brown; Julie Brown; Pranesh Chowdhury, MPH; Gloria J. Colclough; Kathy A. Douglas, PhD; Evelyn Dunn; Nicole Flowers, MD; Earl Ford, MD; Kristi Fultz-Butts, MPH; Suzianne Garner, MPA; William S. Garvin, III; David Gilbertz, MSc; Ronald N. Goodson, MSW; Elizabeth Hughes, DrPH; Ruth Jiles, PhD; Georgina Kirunda; Kenneth J. Laliberte, MPA; Michael Link, PhD; Melissa McCracken, MPH; Lisa McGuire, PhD; Ali Mokdad, PhD; Wil Murphy; Margaret Ochner, MPH; Catherine Okoro, MS; Kathryn O'Neill; Henry Roberts, PhD; Ajay Sharma; Herbert Stackhouse, MS; Tara Strine, MPH; Michelle Sussman Walsh, MEd; Horace Thompson; Machell Town, MSc; Justin Vigeant; and Yuna Zhong, MD, Division of Adult and Community Health, National Center for Chronic Disease Prevention and Health Promotion, CDC, Atlanta, Georgia. Table 1 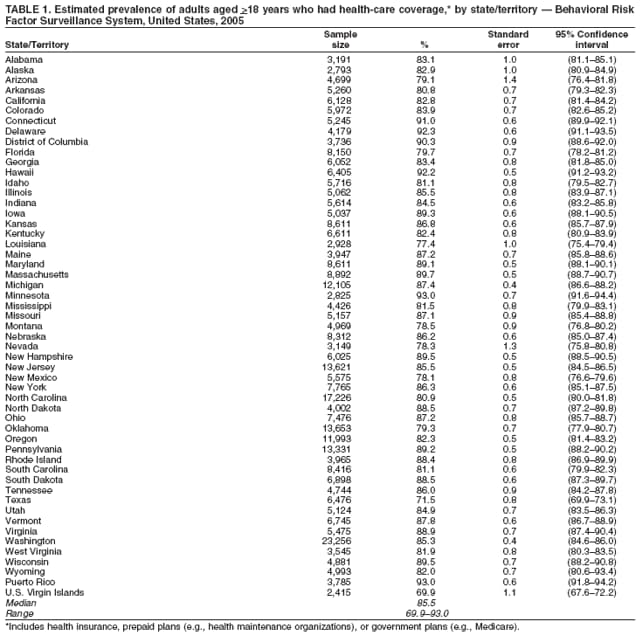 Return to top. Table 2 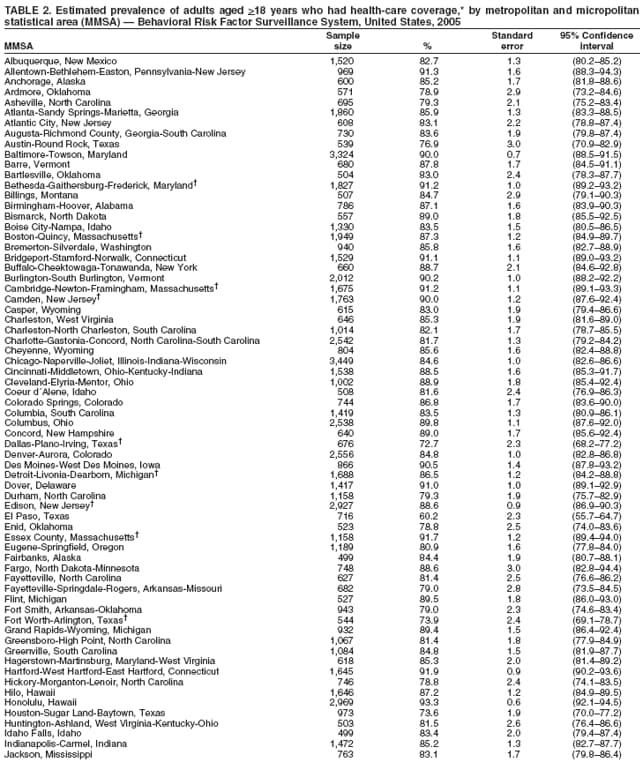 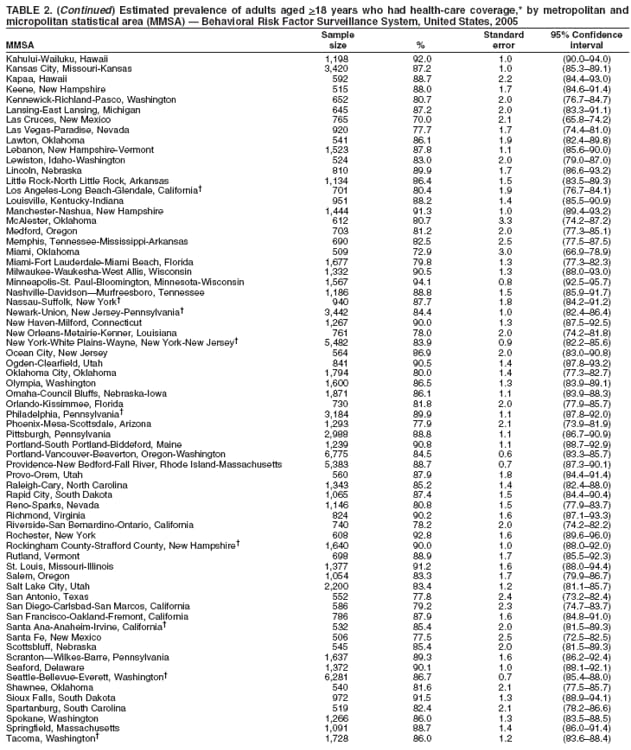 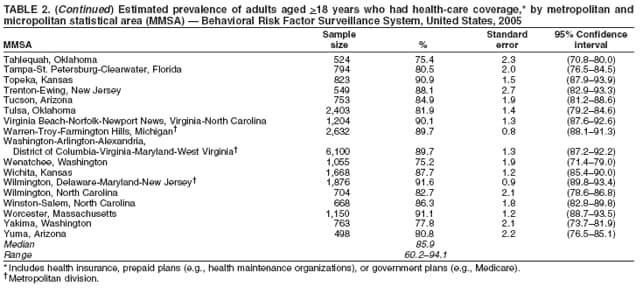 Return to top. Table 3  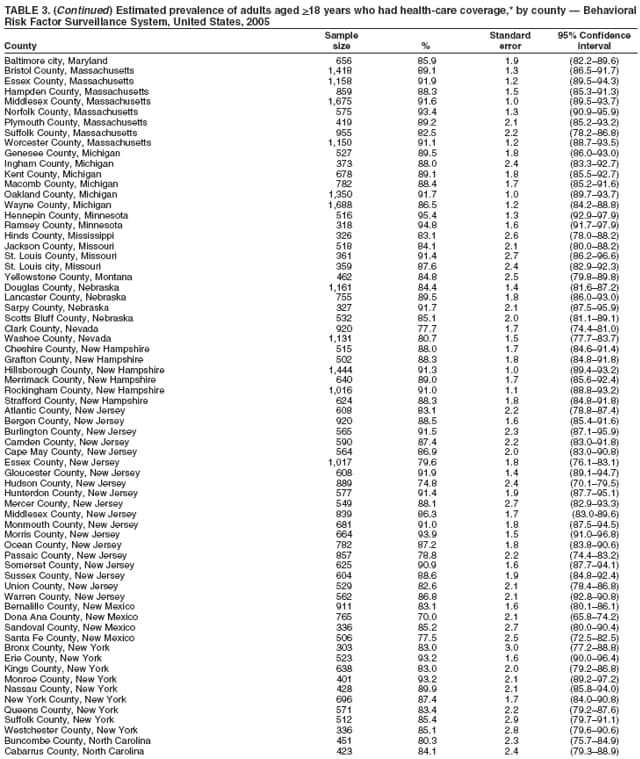 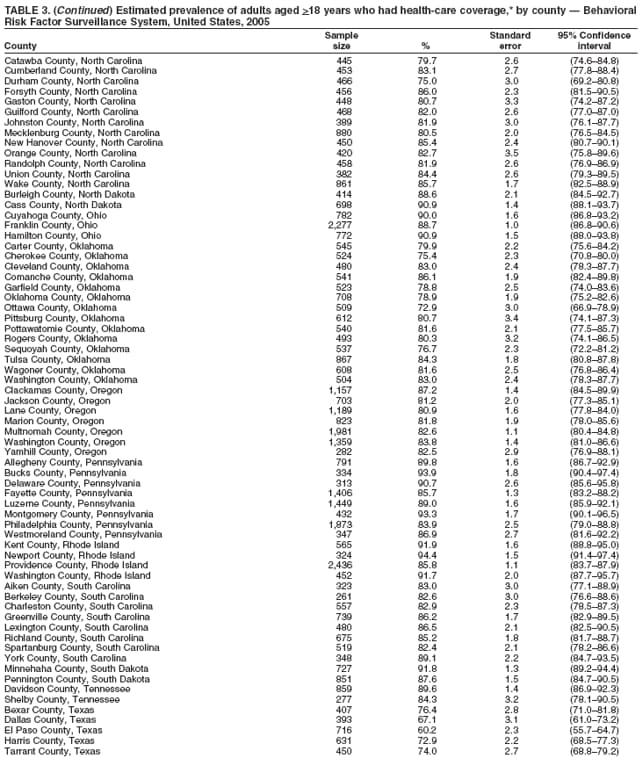 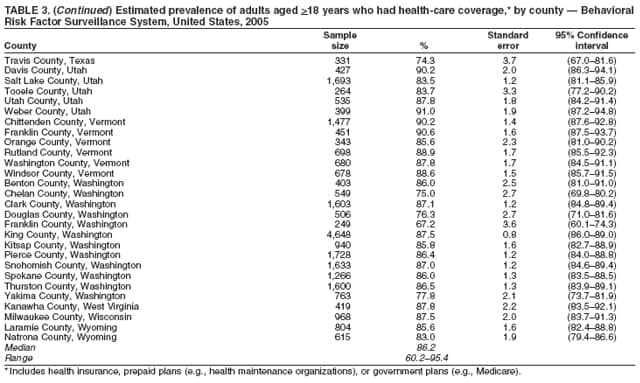 Return to top. Table 4 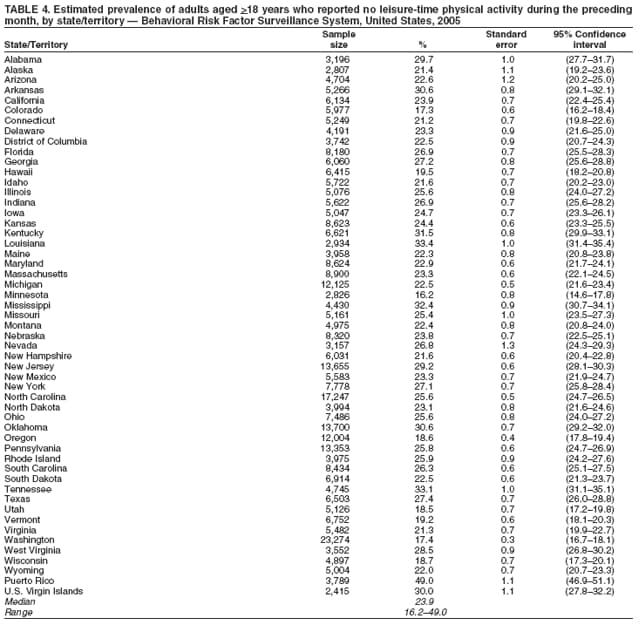 Return to top. Table 5  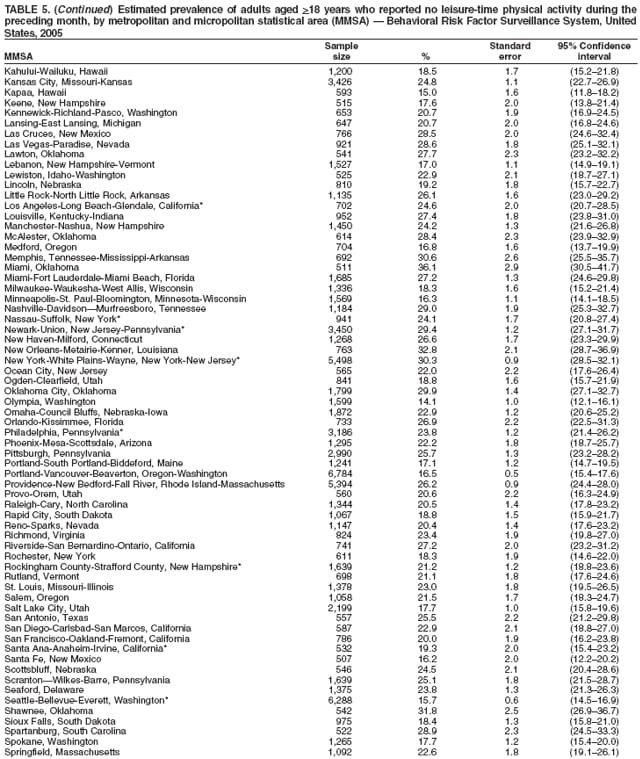 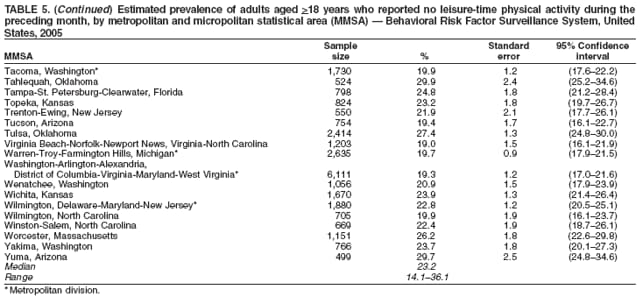 Return to top. Table 6 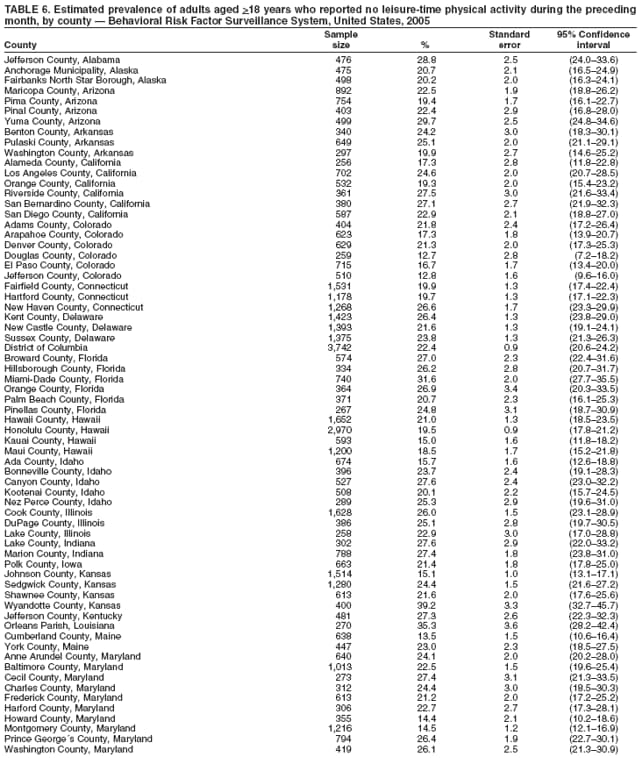

 Return to top. Table 7 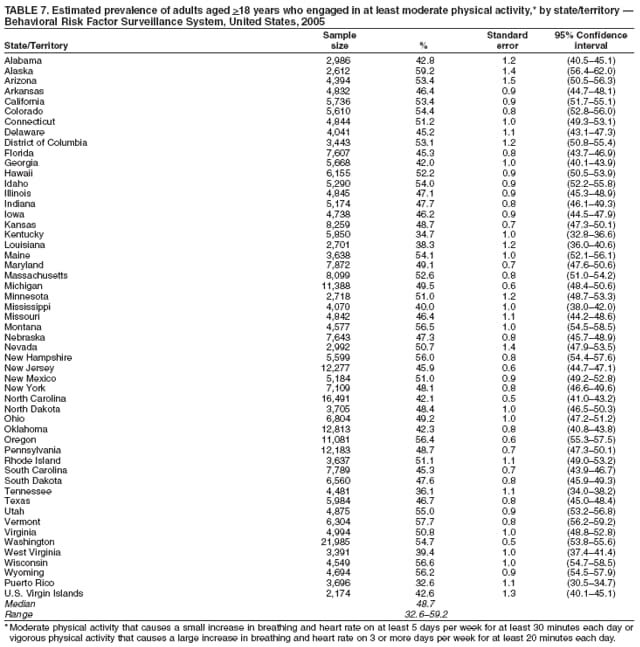 Return to top. Table 8  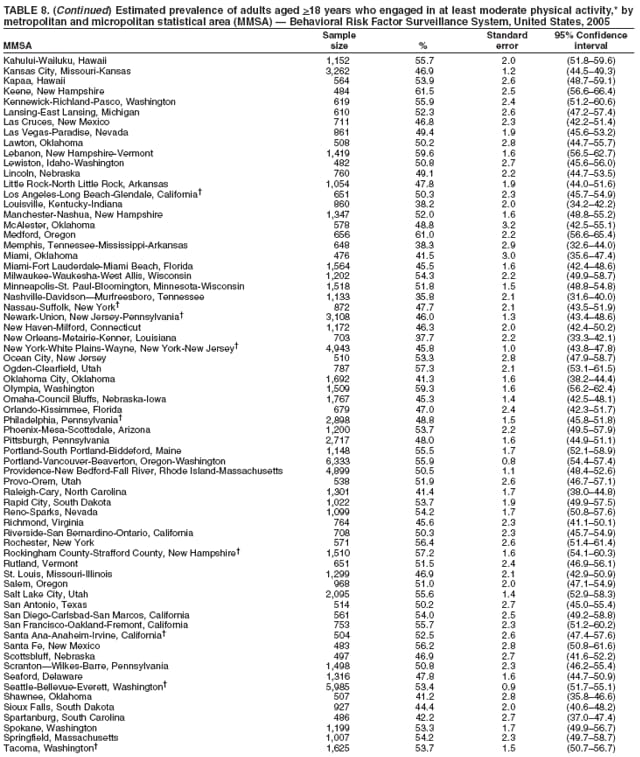 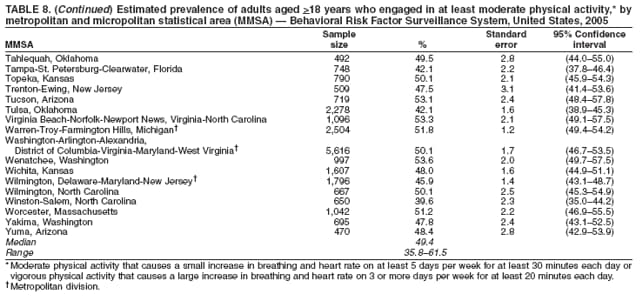 Return to top. Table 9 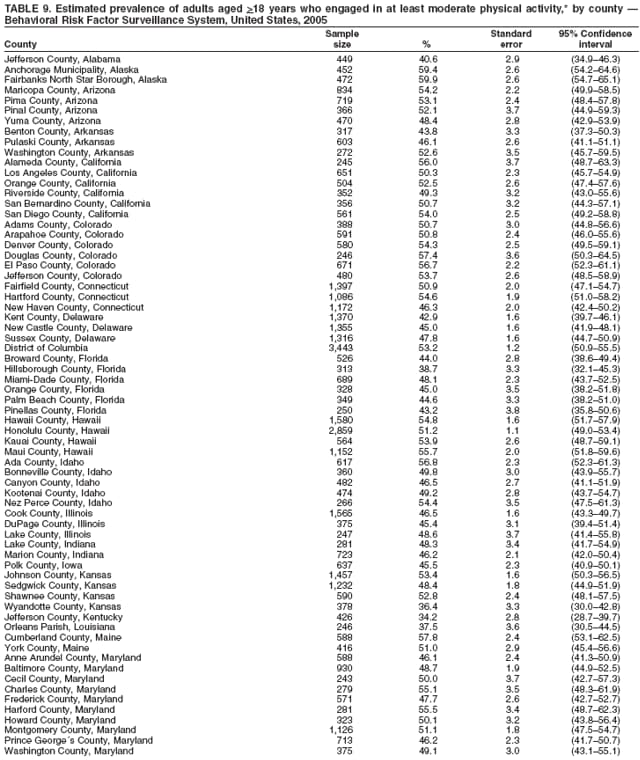 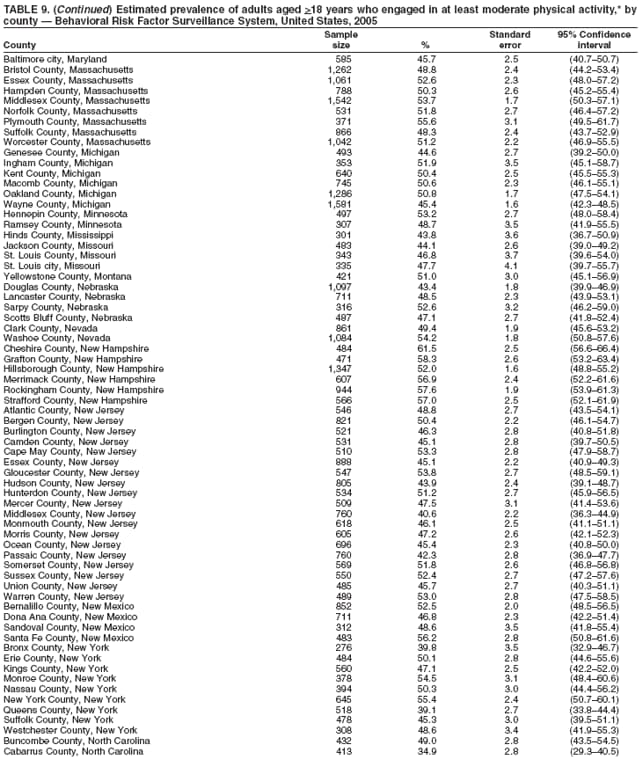 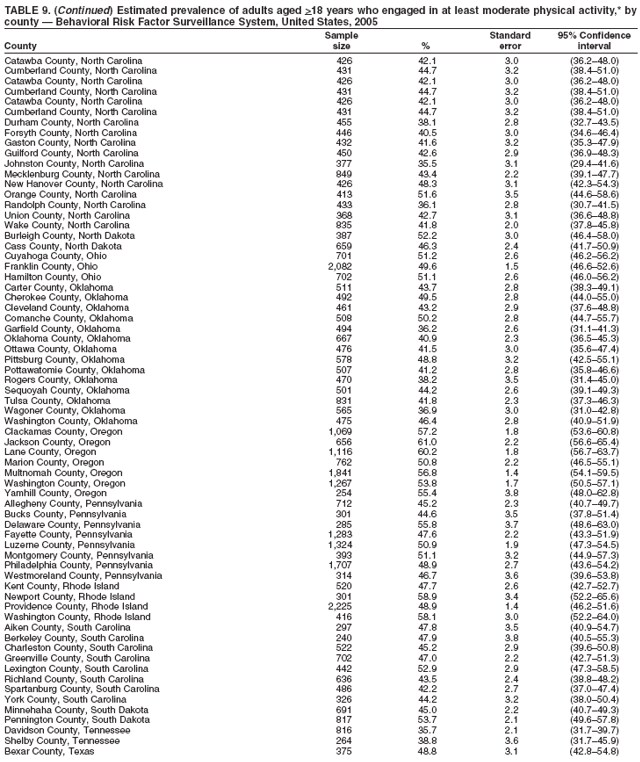 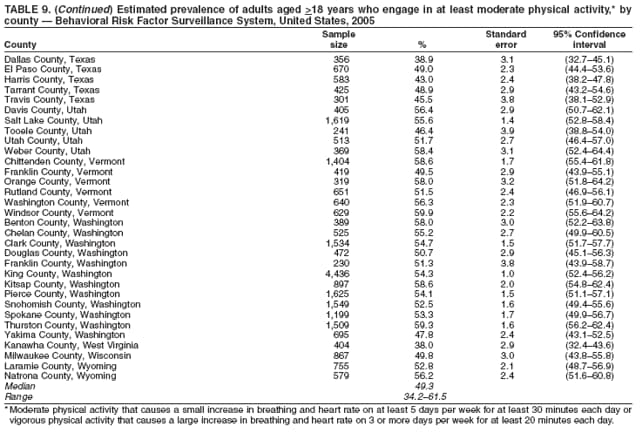 Return to top. Table 10 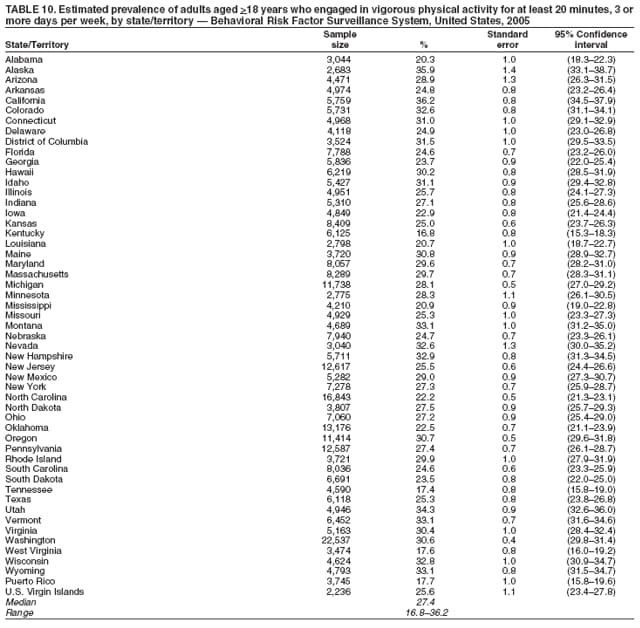 Return to top. Table 11   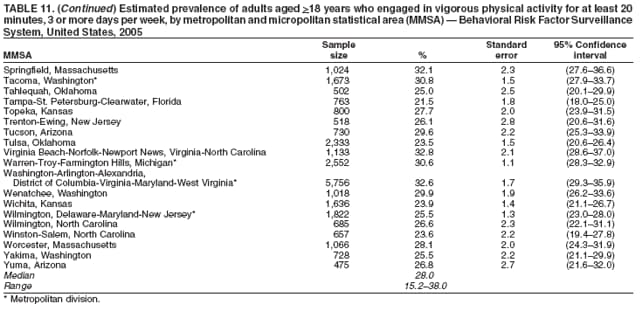 Return to top. Table 12 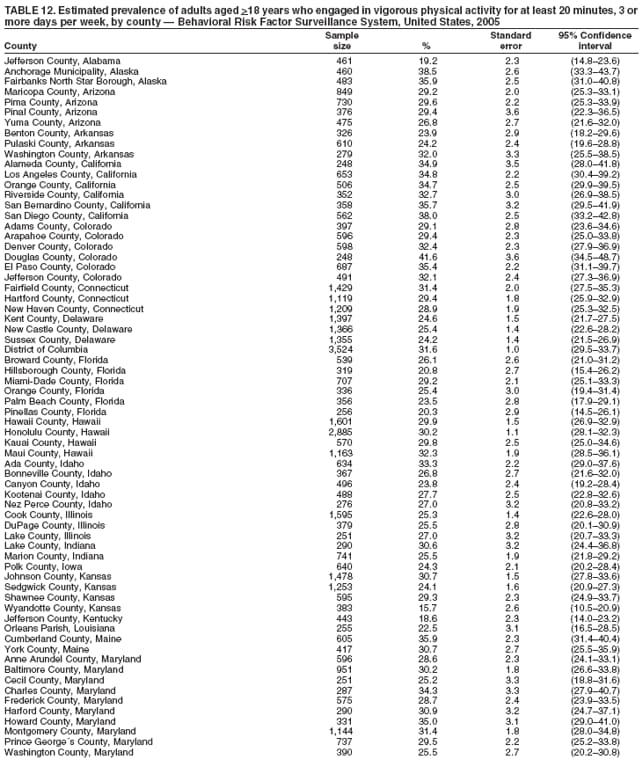 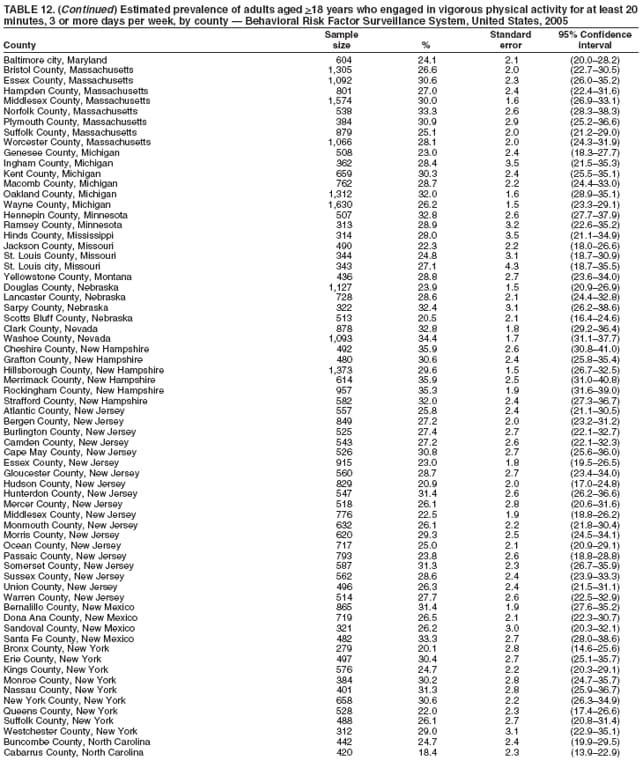 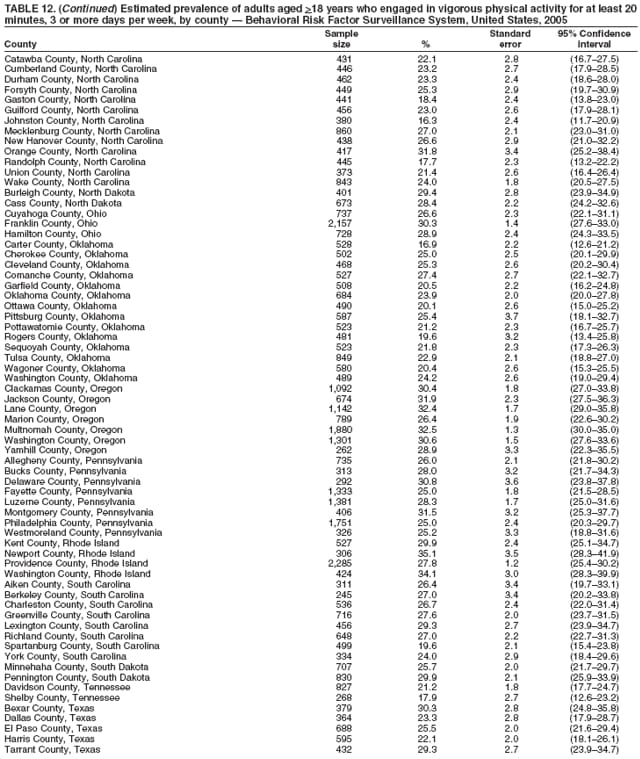 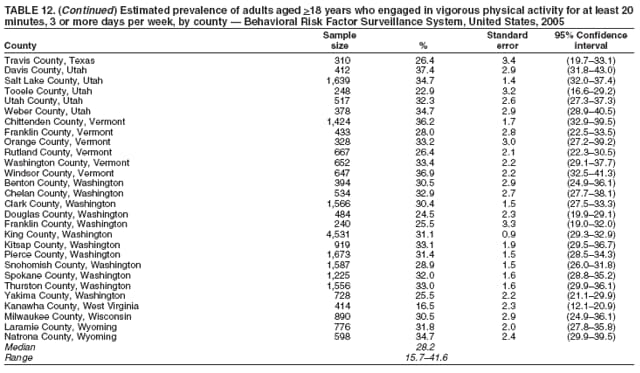 Return to top. Table 13 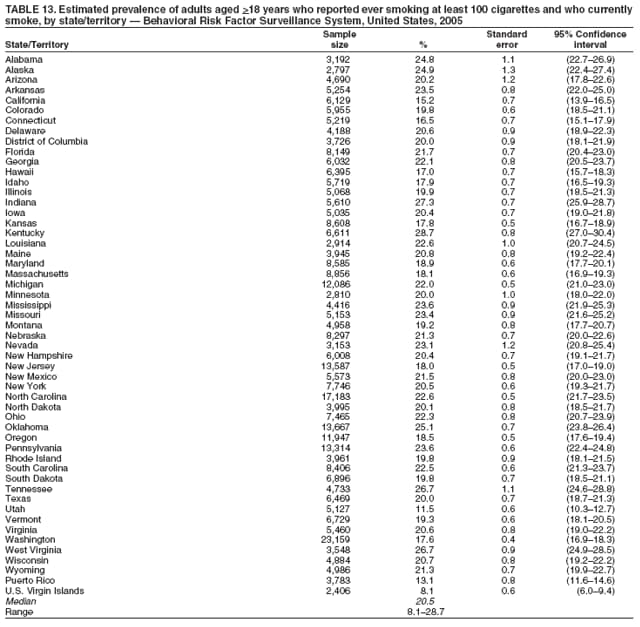 Return to top. Table 14 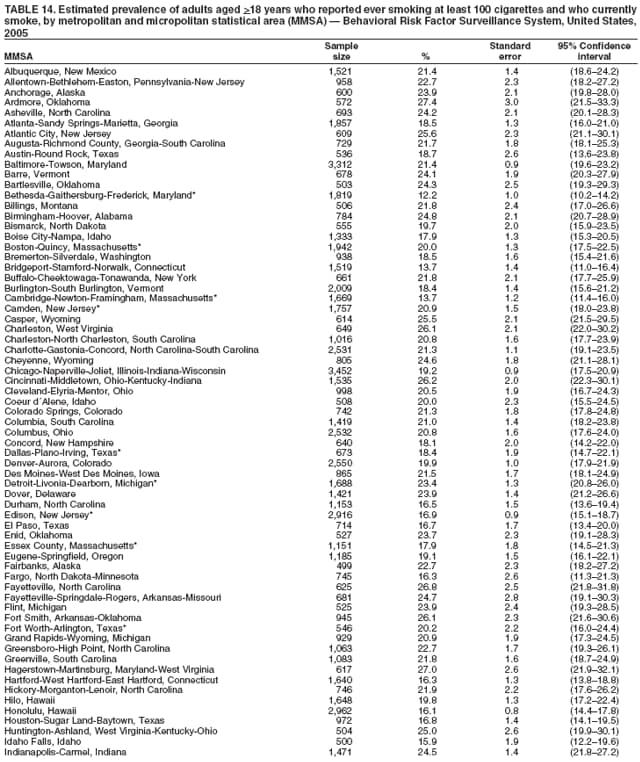 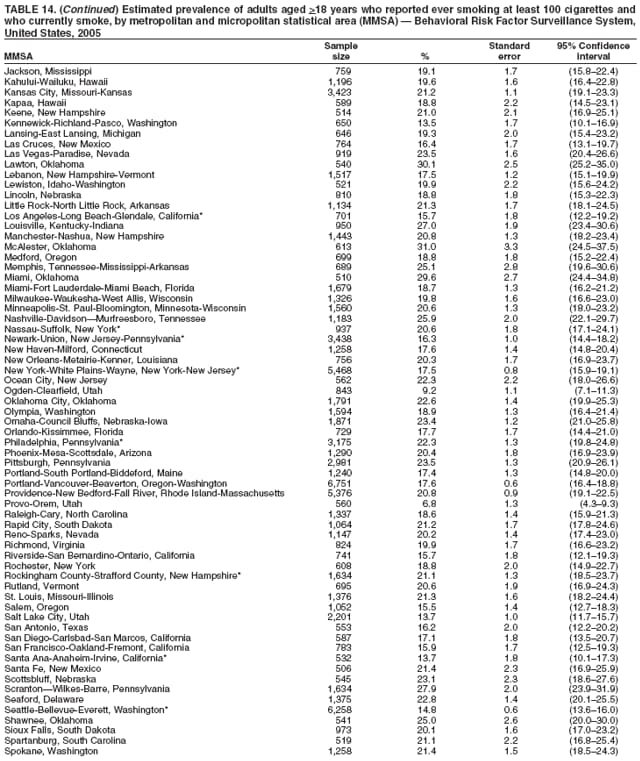 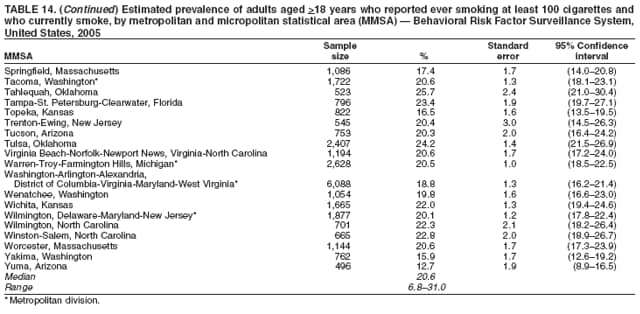 Return to top. Table 15 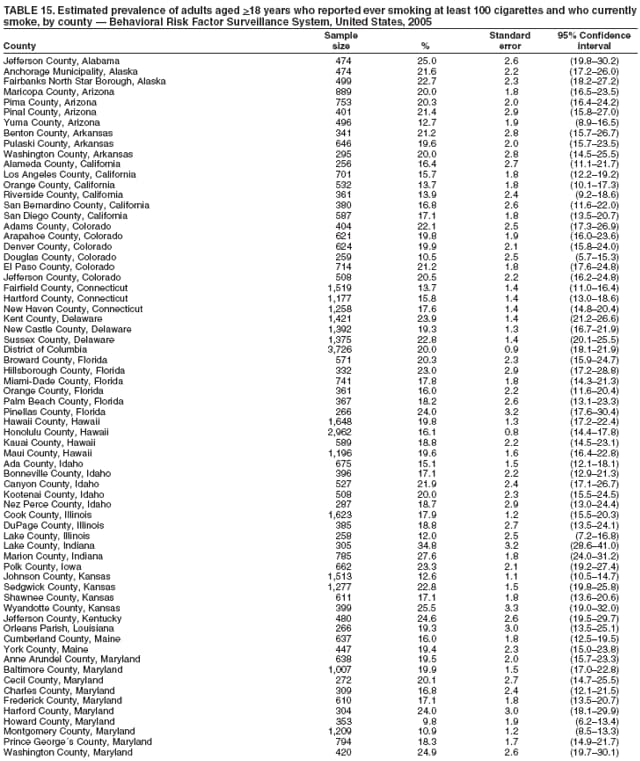 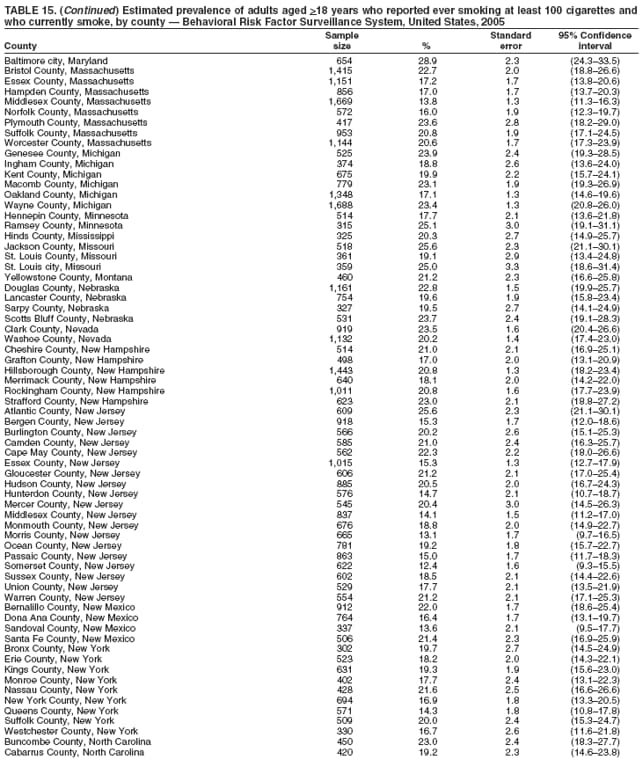  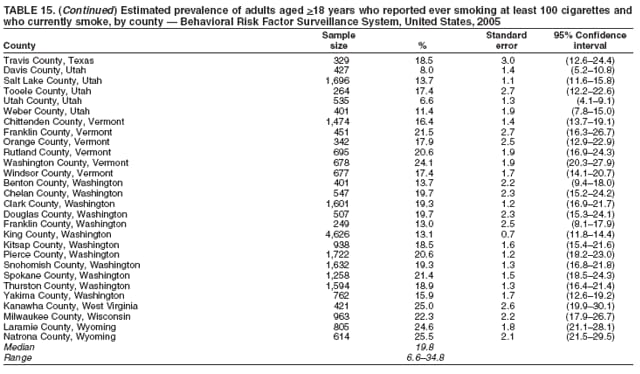 Return to top. Table 16 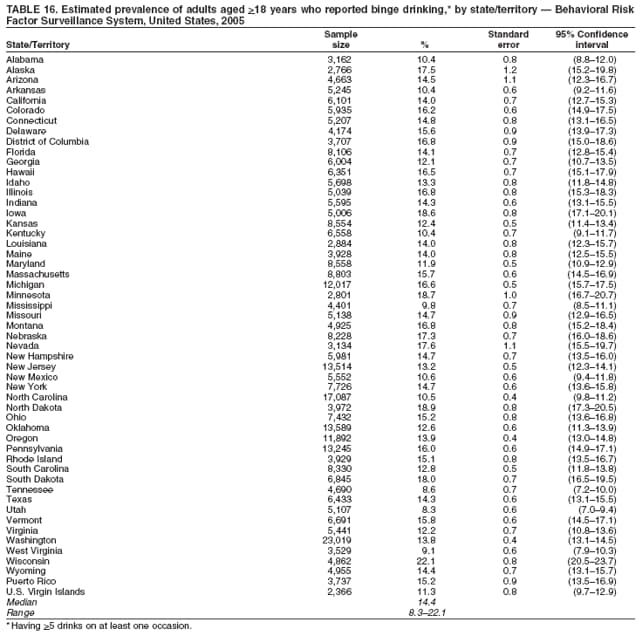 Return to top. Table 17 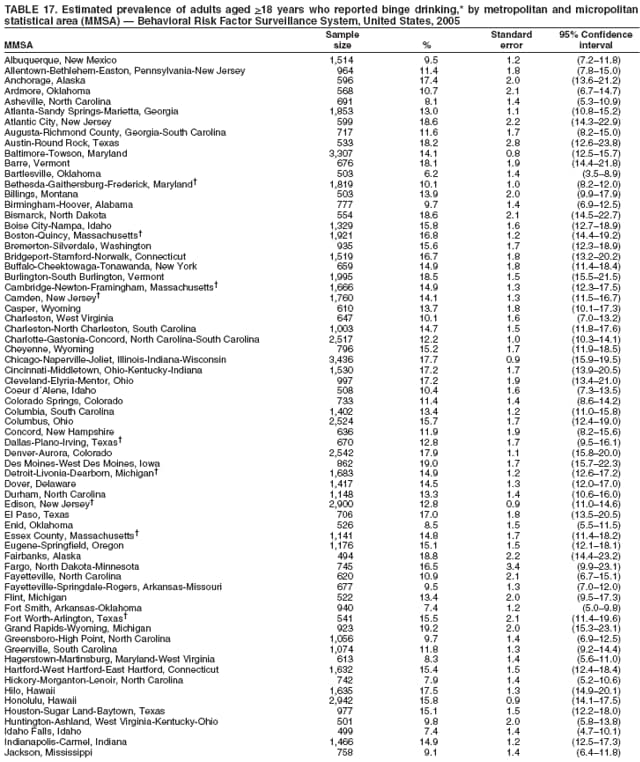 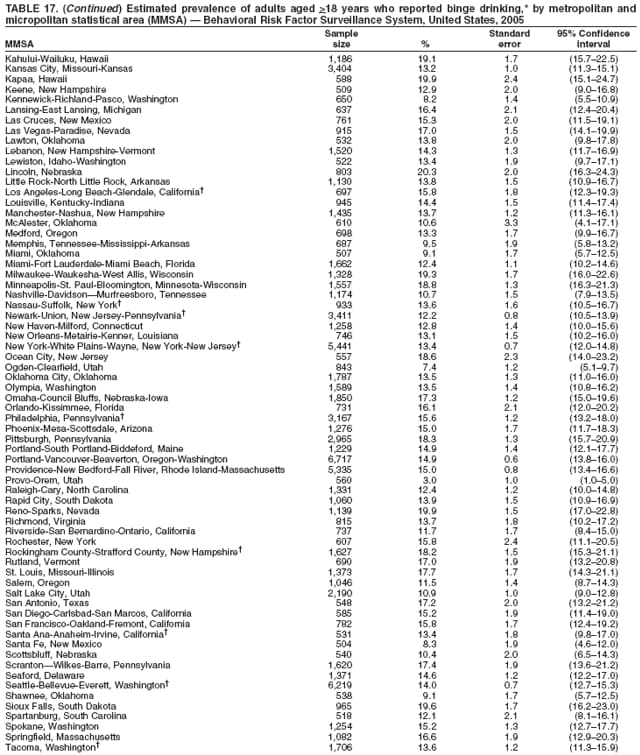 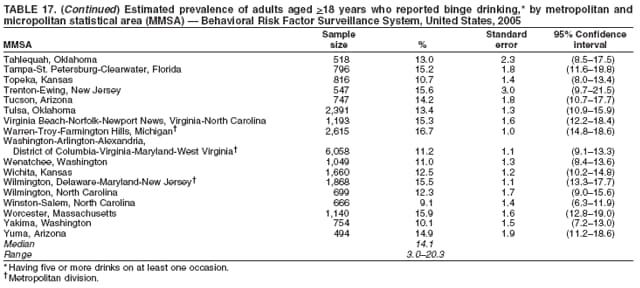 Return to top. Table 18 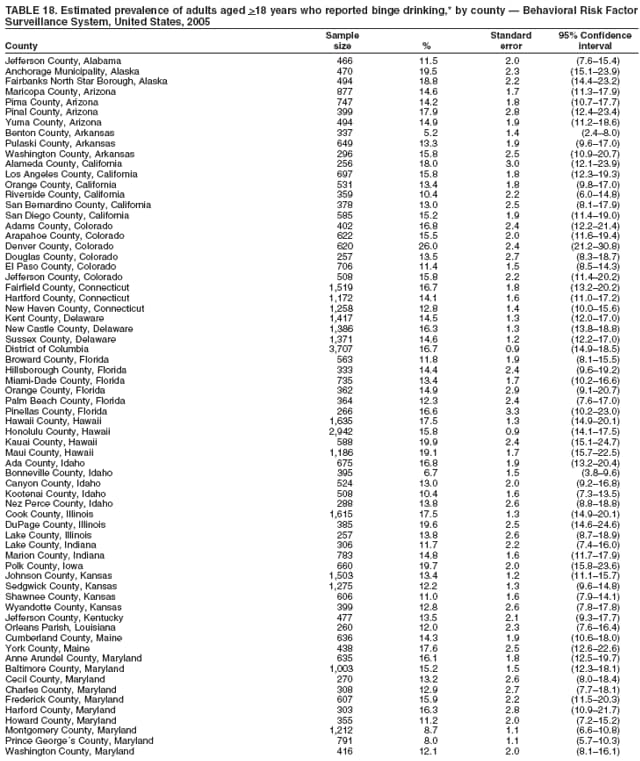 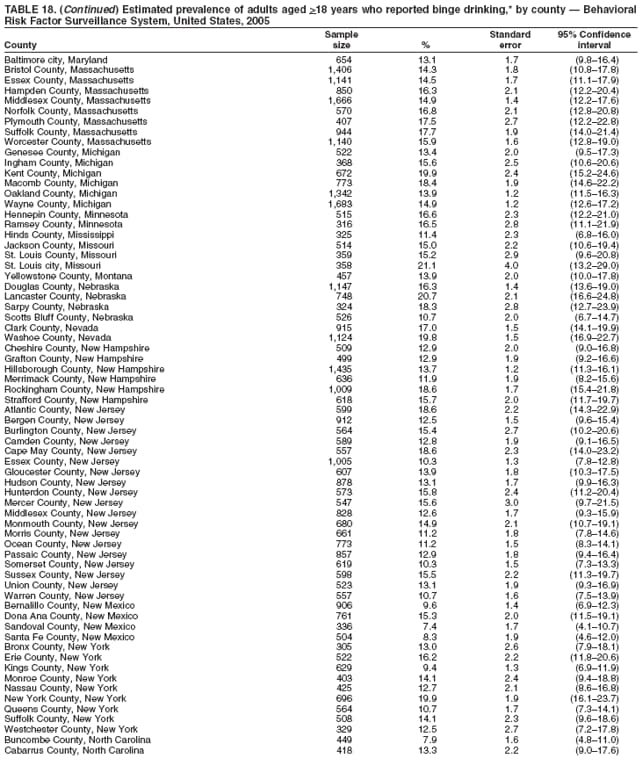 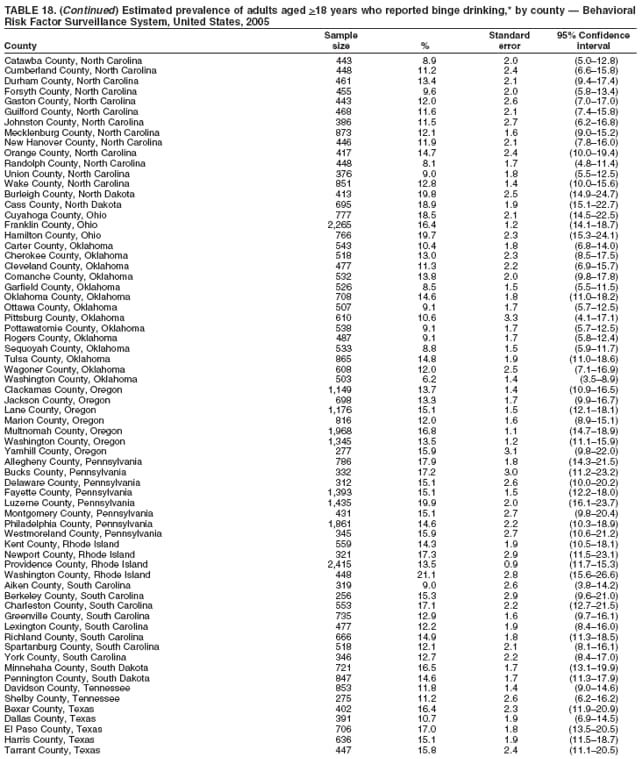 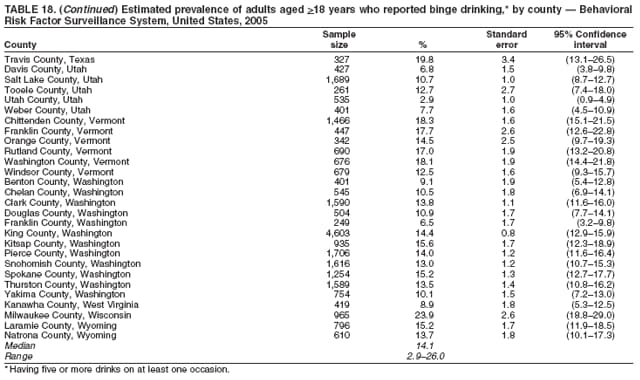 Return to top. Table 19 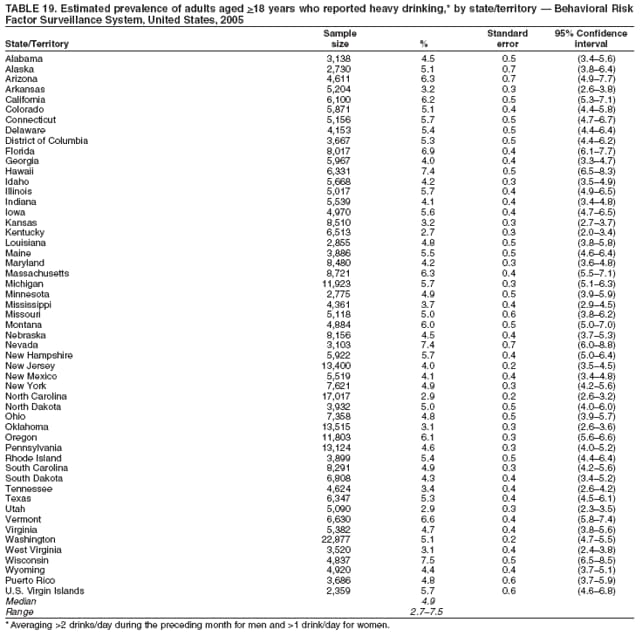 Return to top. Table 20  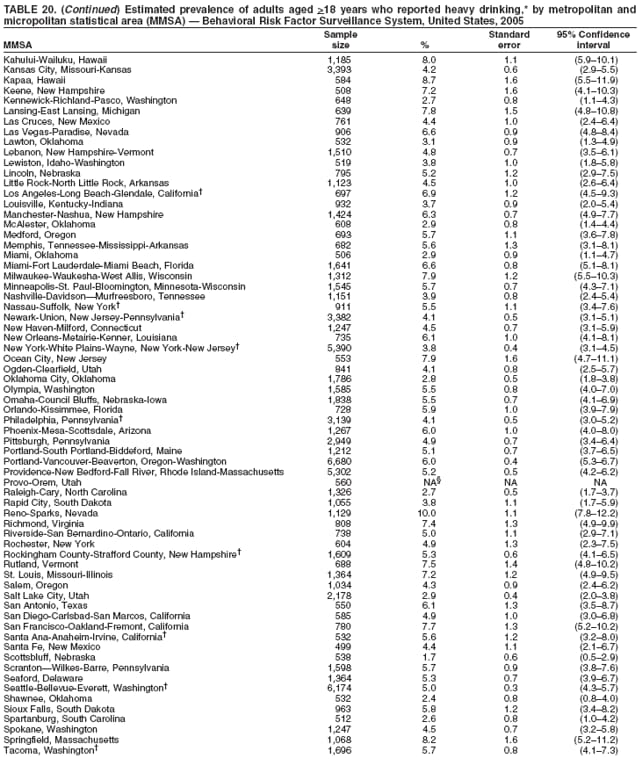 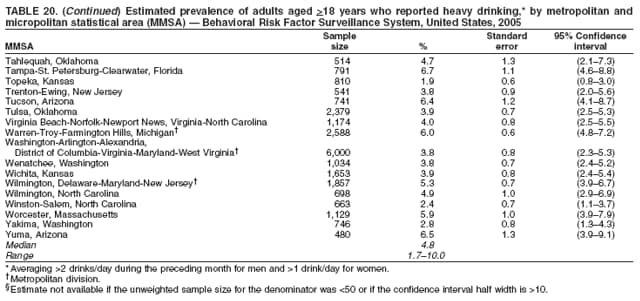 Return to top. Table 21  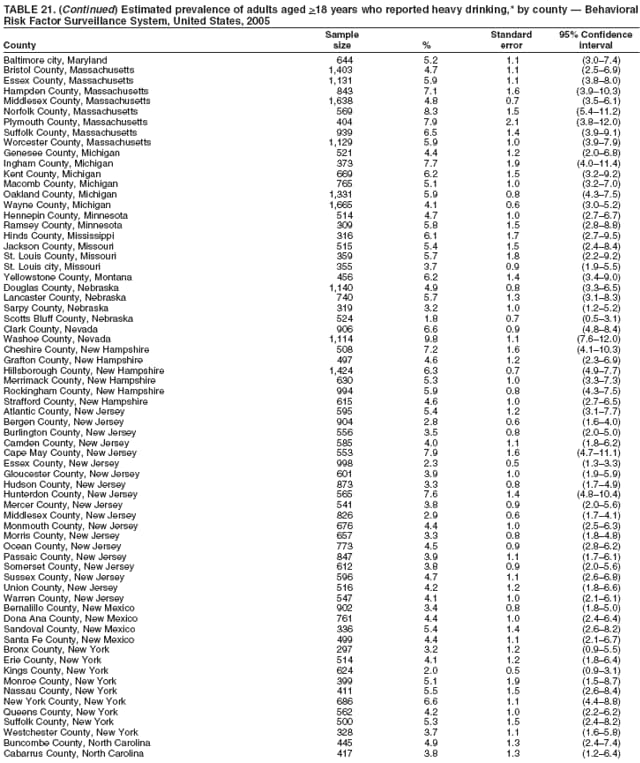  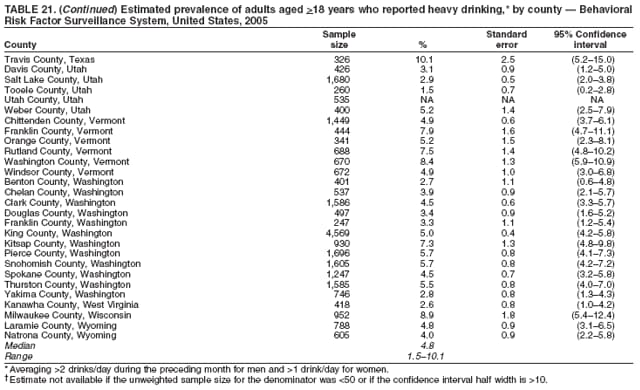 Return to top. Table 22 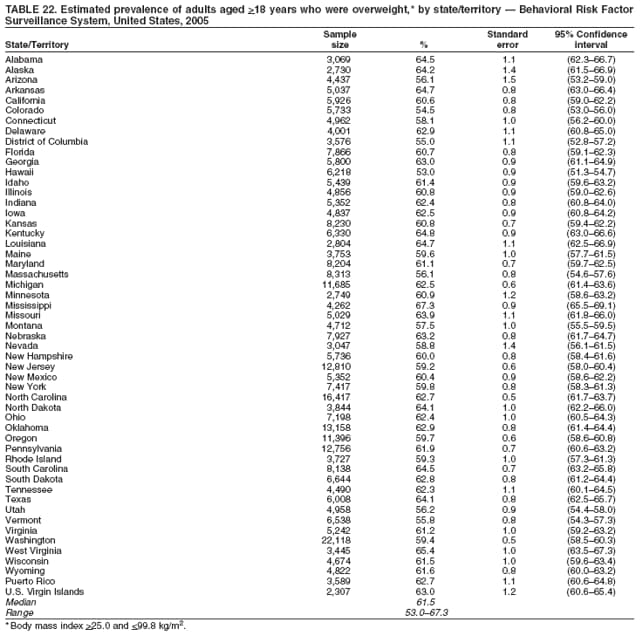 Return to top. Table 23 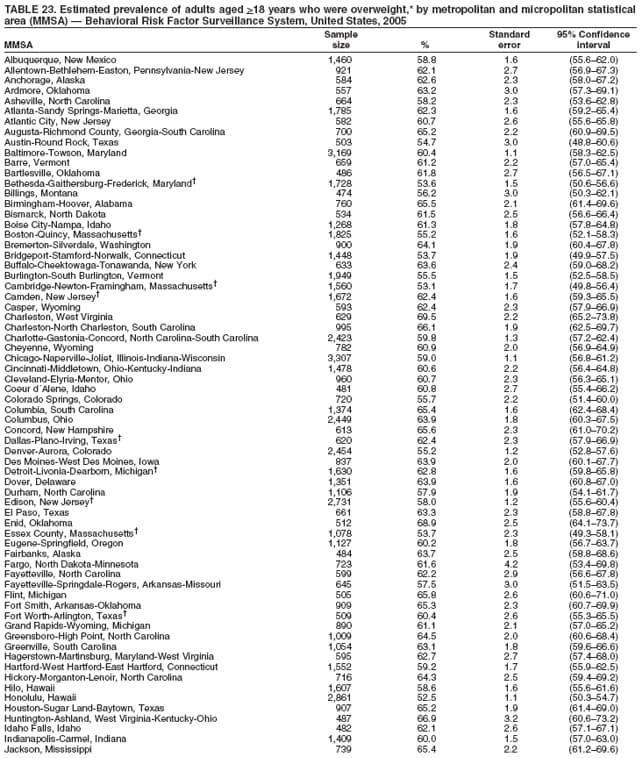 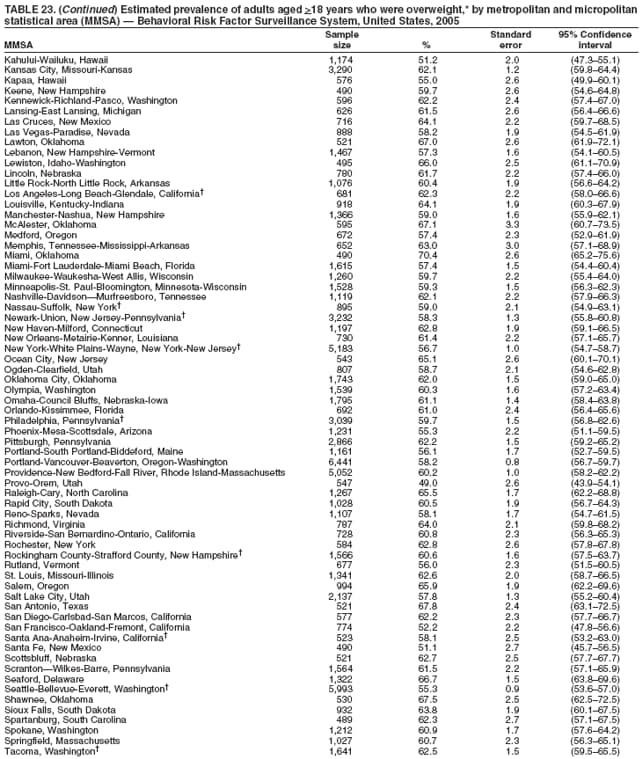 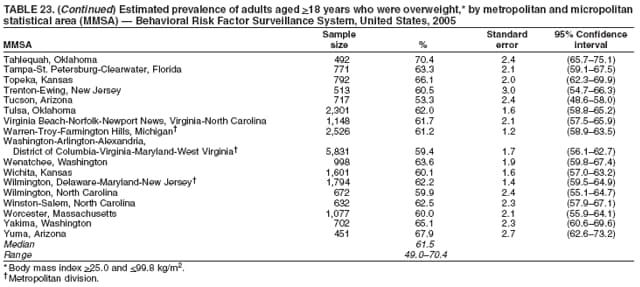 Return to top. Table 24 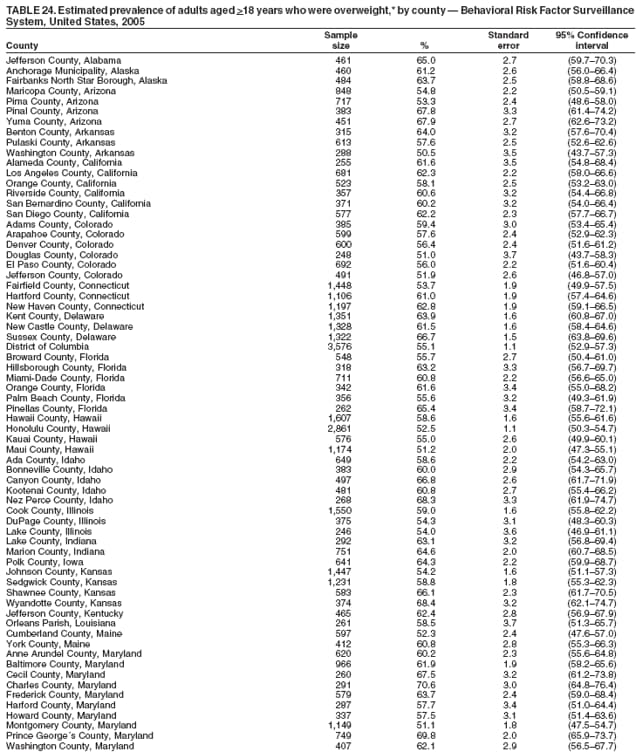 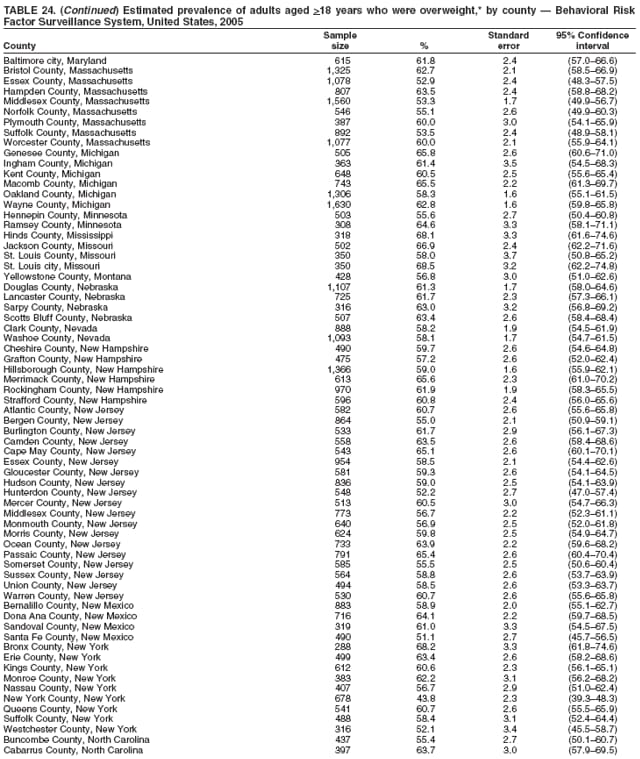 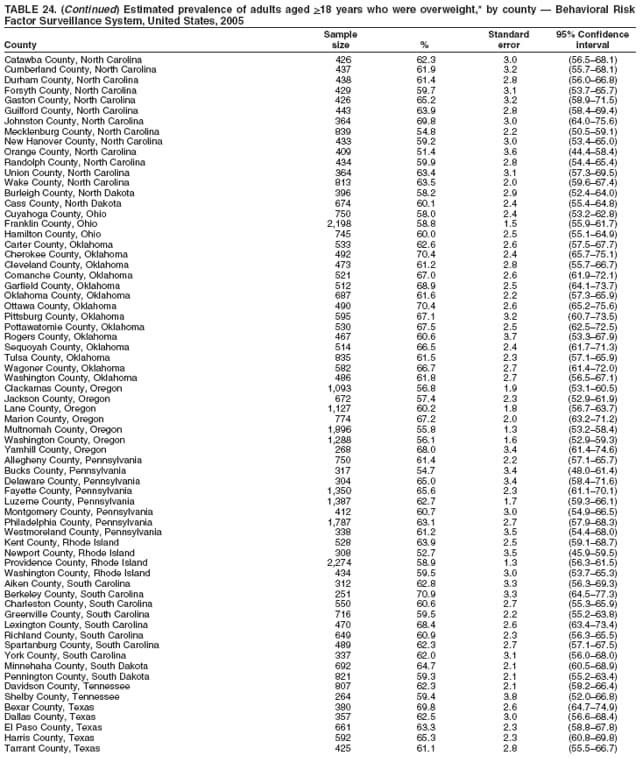 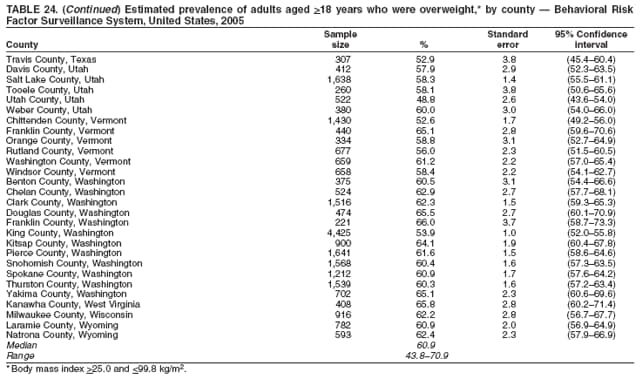 Return to top. Table 25 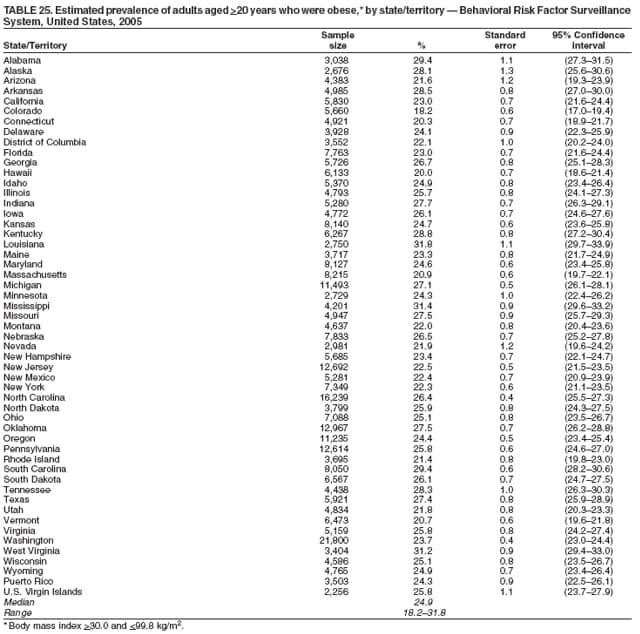 Return to top. Table 26 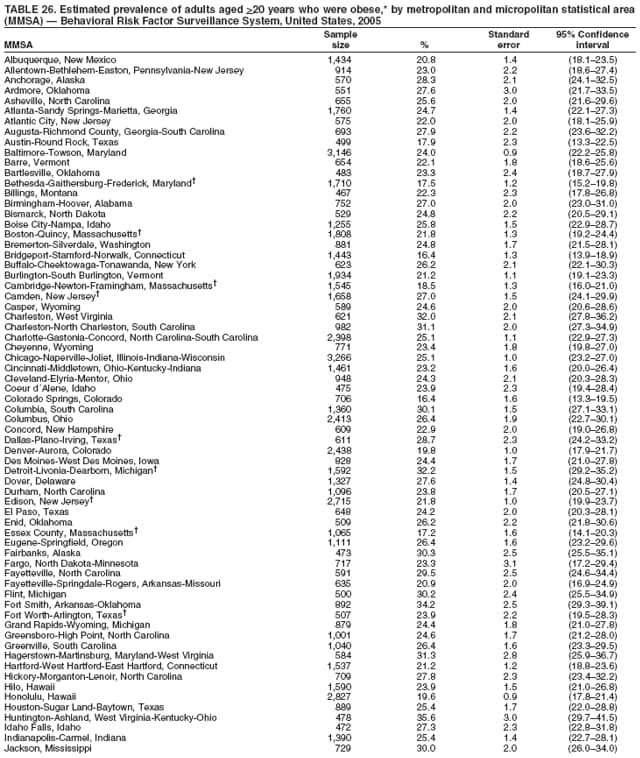  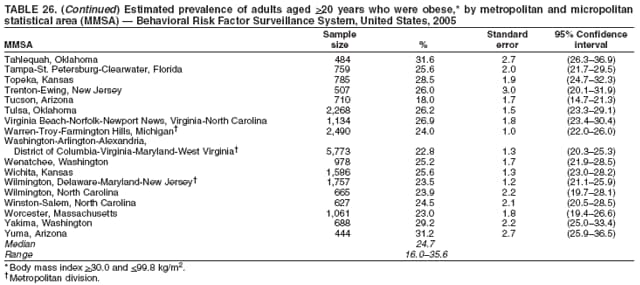 Return to top. Table 27 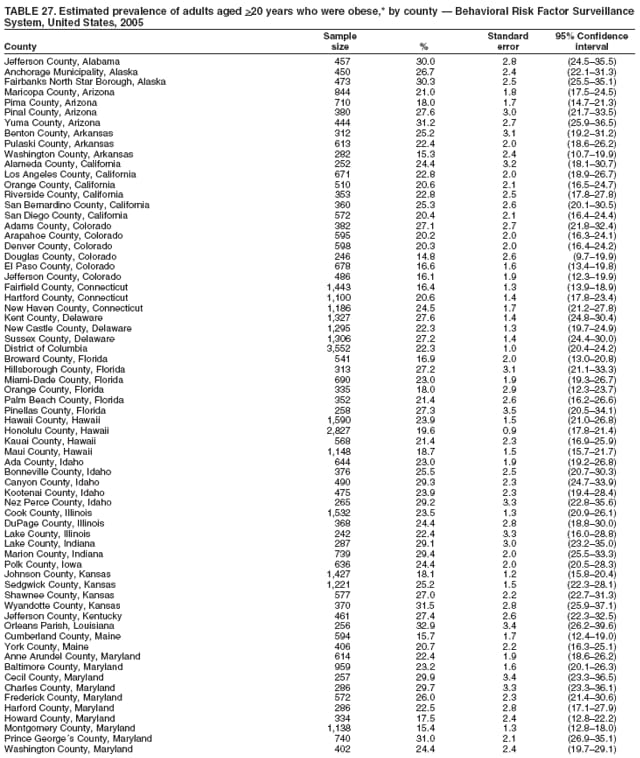 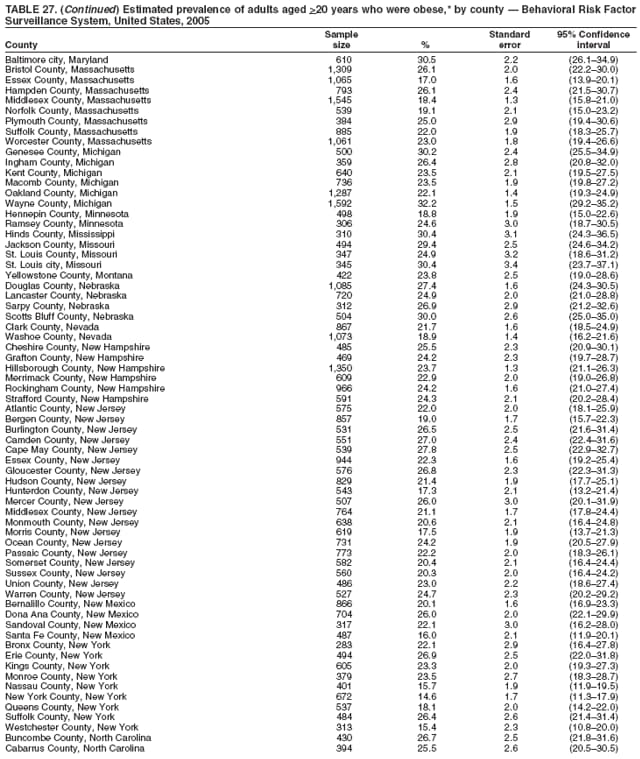  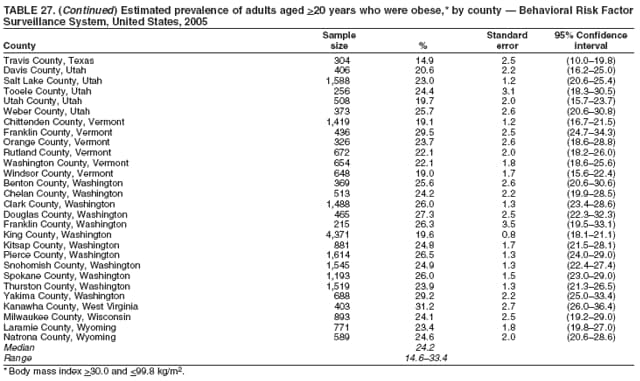 Return to top. Table 28 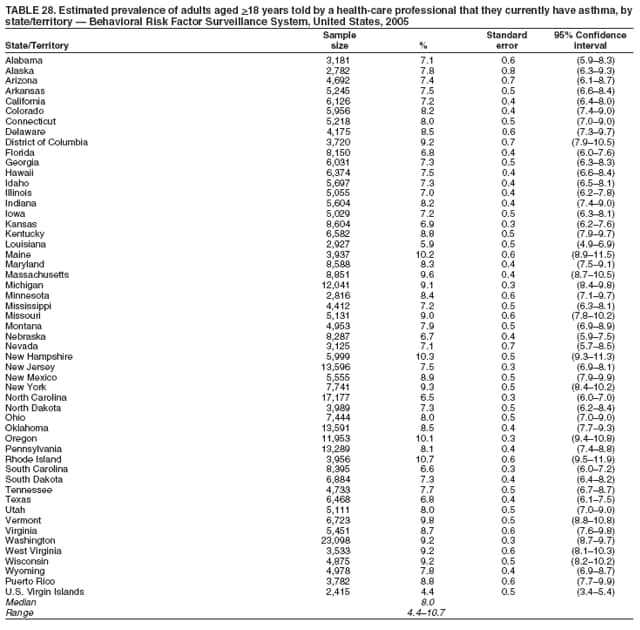 Return to top. Table 29  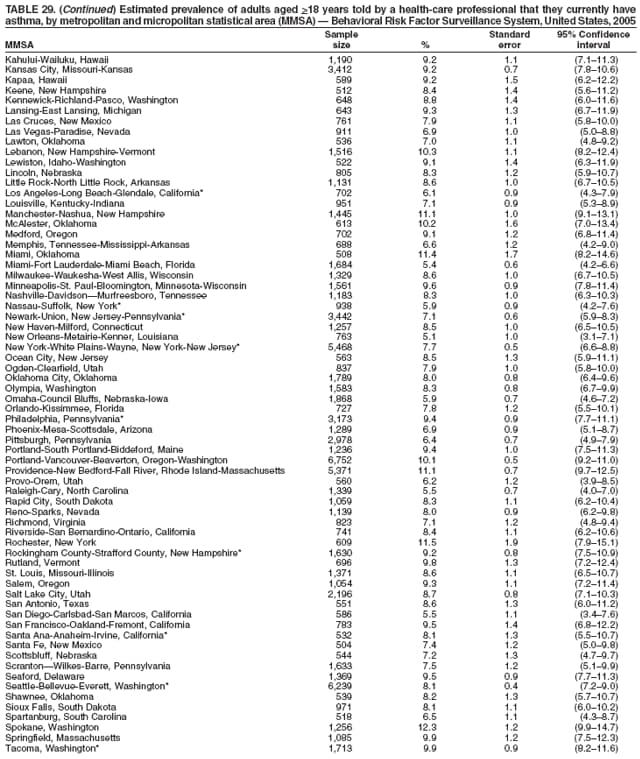 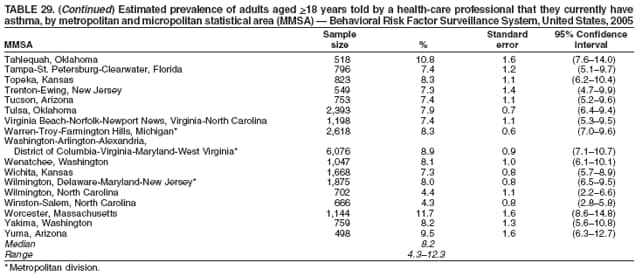 Return to top. Table 30 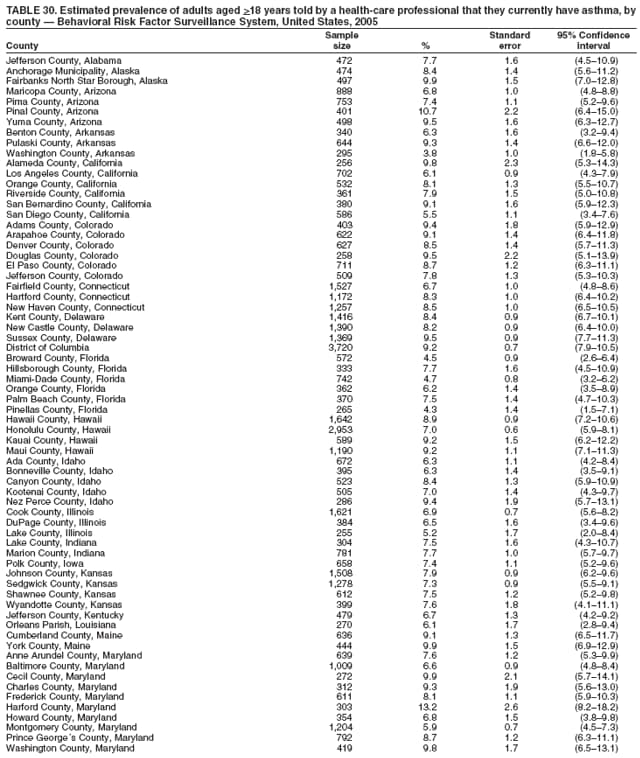 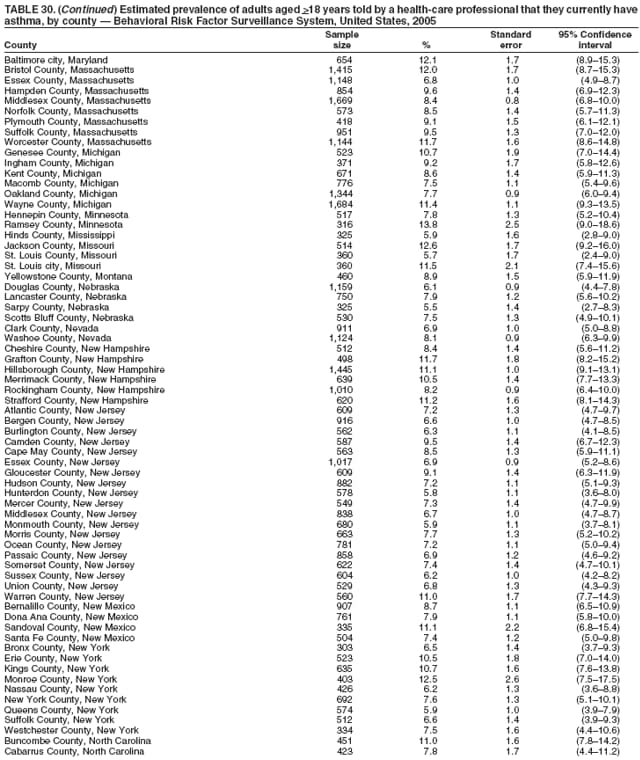 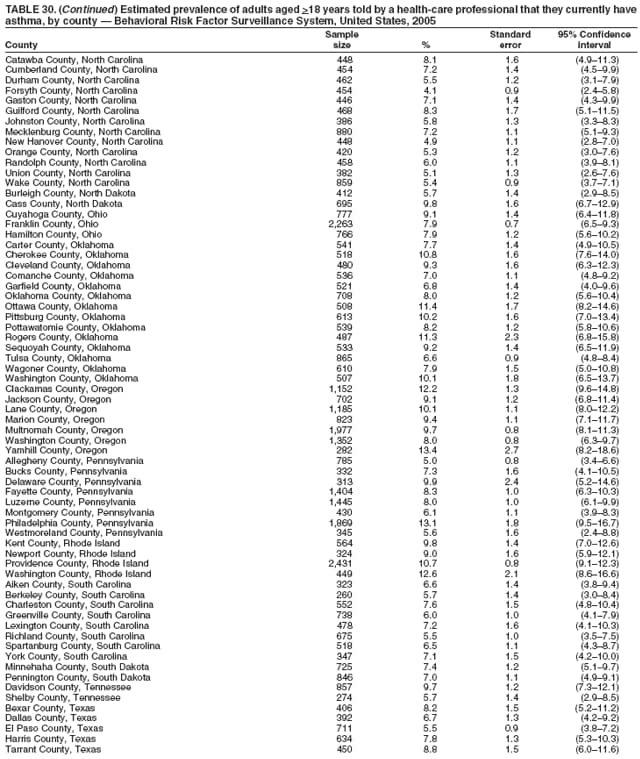 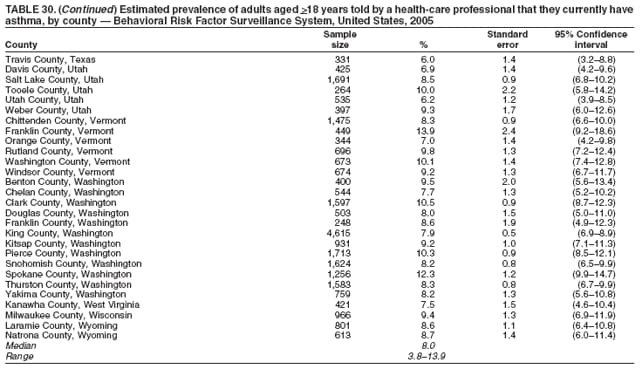 Return to top. Table 31 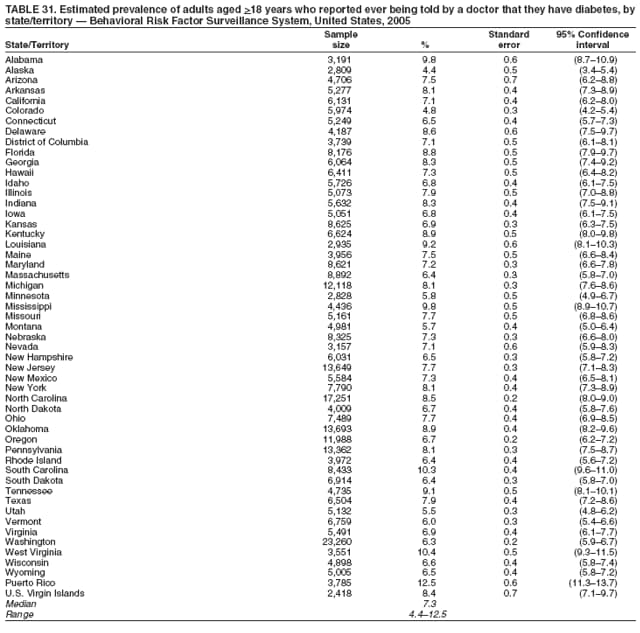 Return to top. Table 32   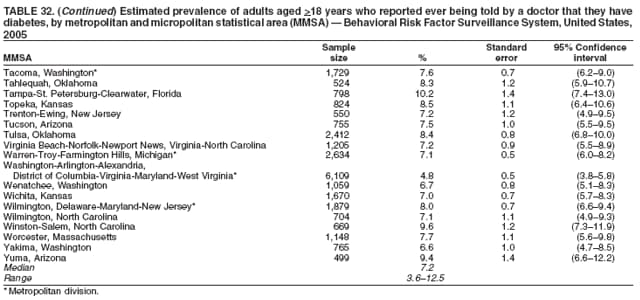 Return to top. Table 33 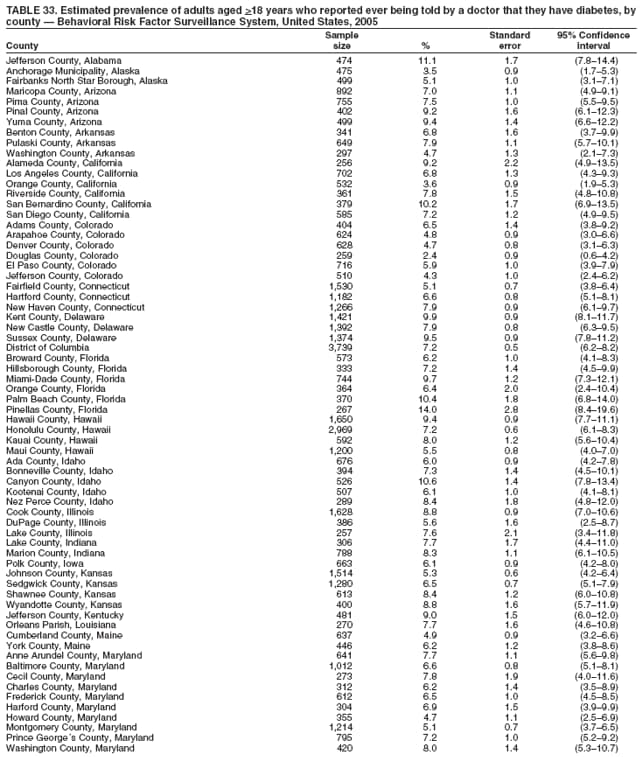   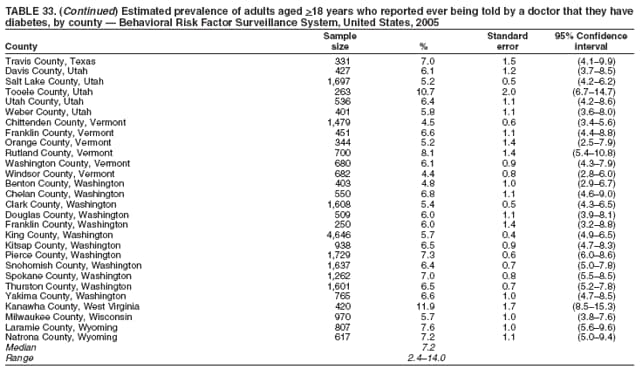 Return to top. Table 34 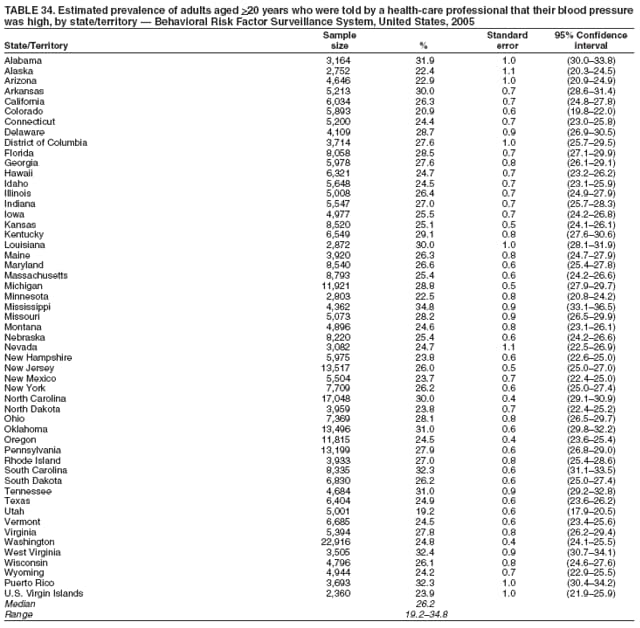 Return to top. Table 35   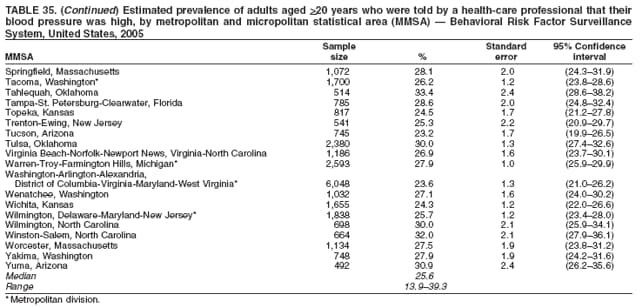 Return to top. Table 36 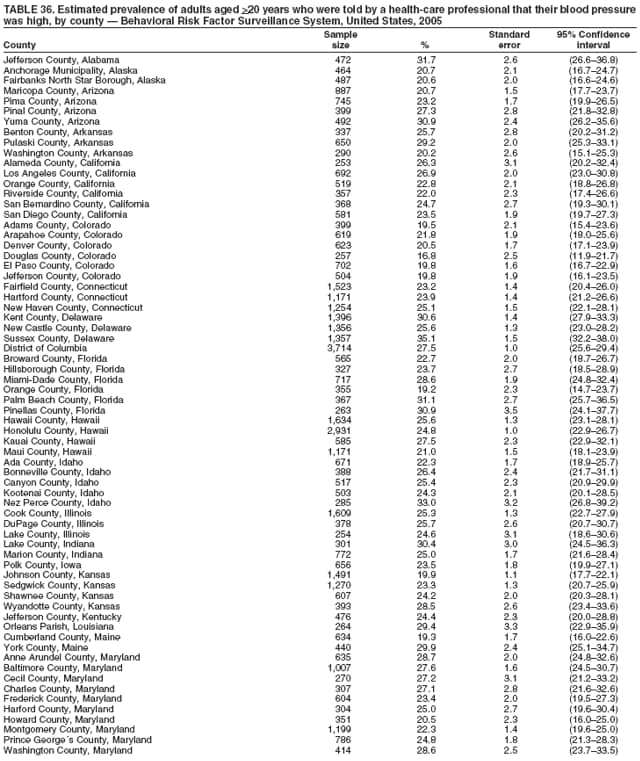 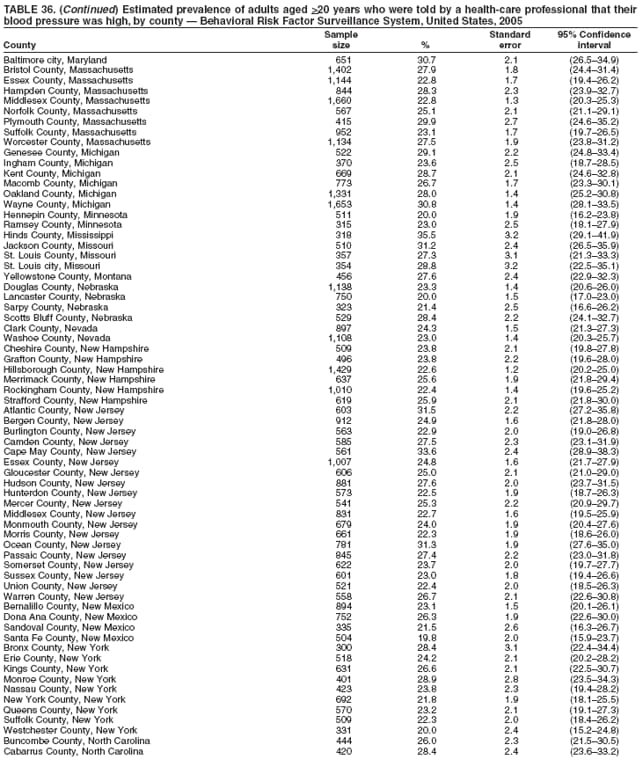  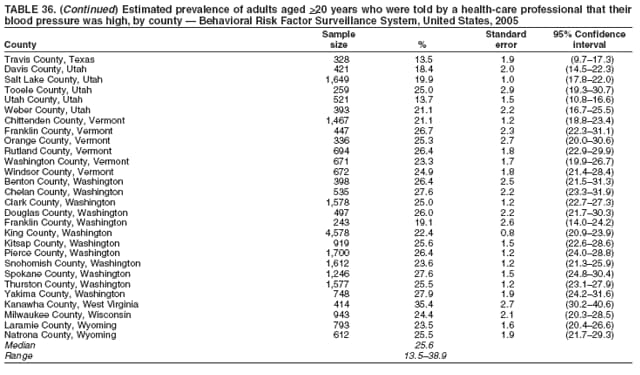 Return to top. Table 37  Return to top. Table 38 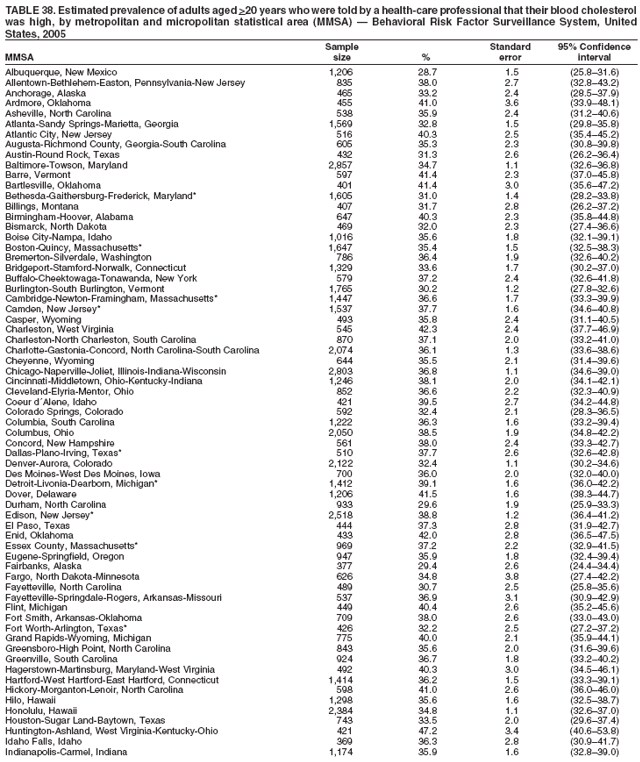 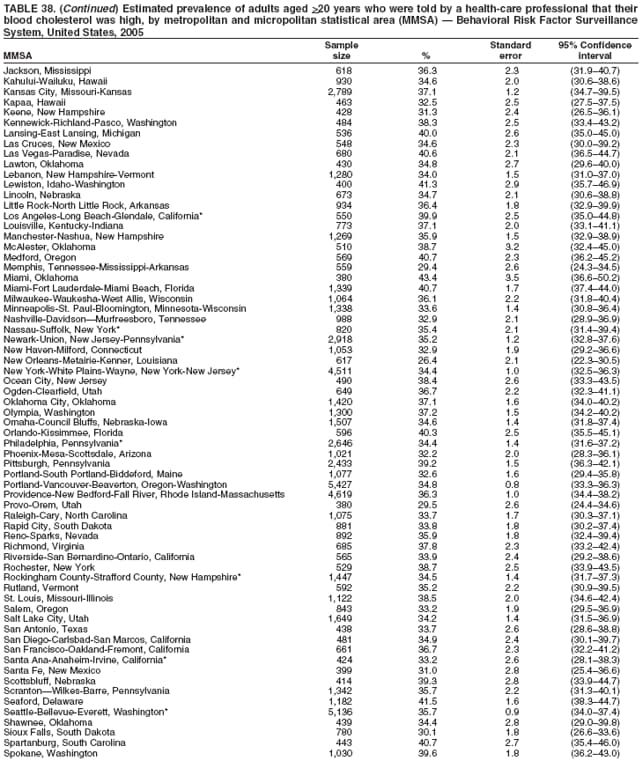 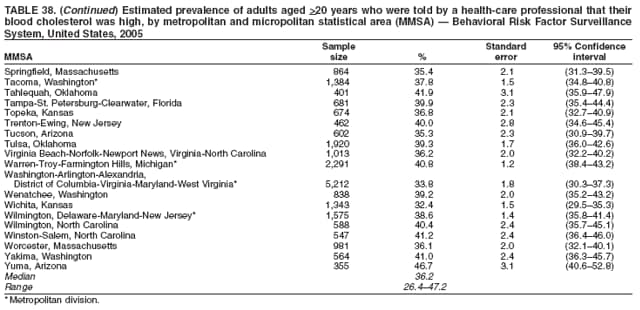 Return to top. Table 39   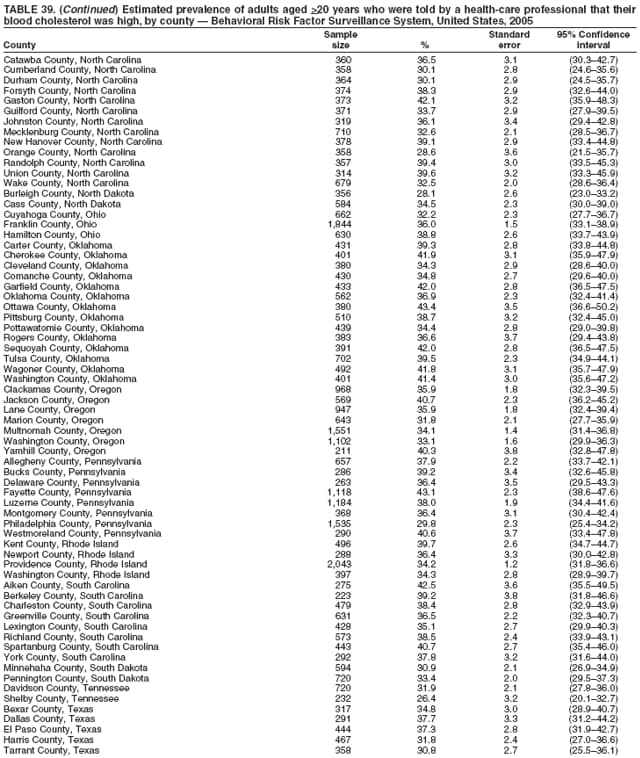 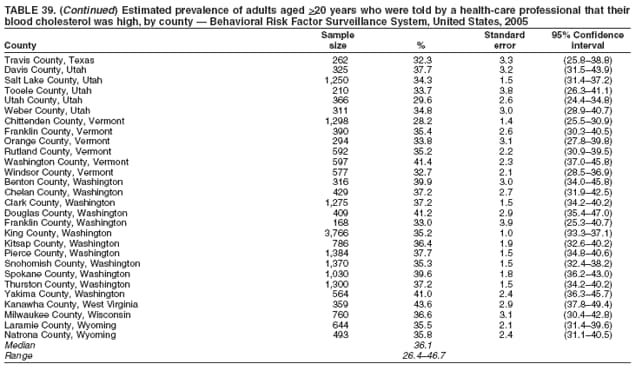 Return to top. Table 40 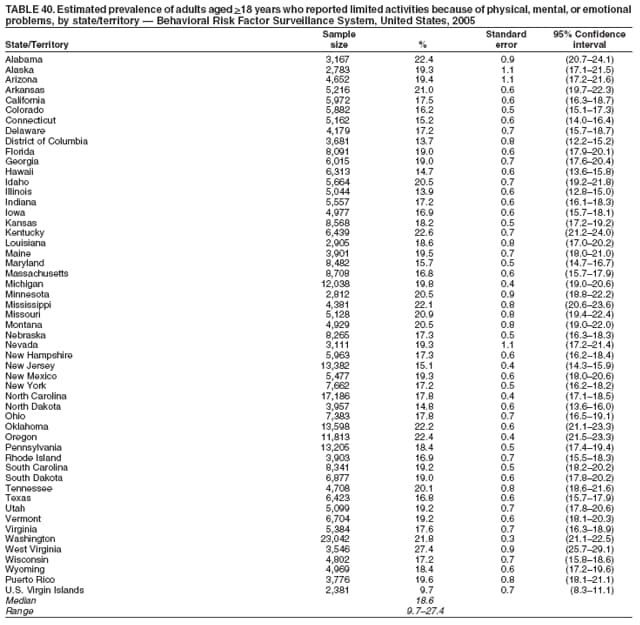 Return to top. Table 41  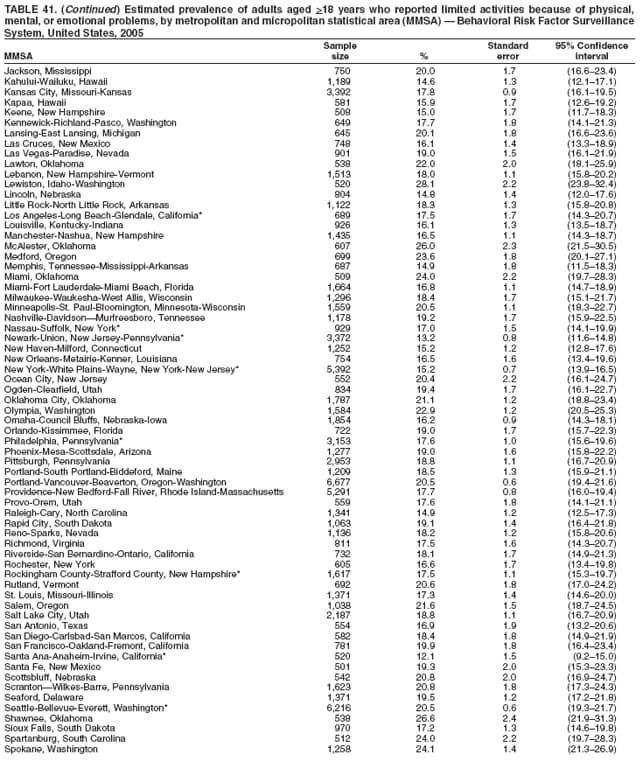 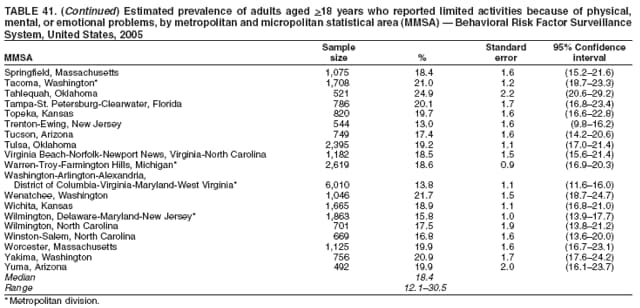 Return to top. Table 42 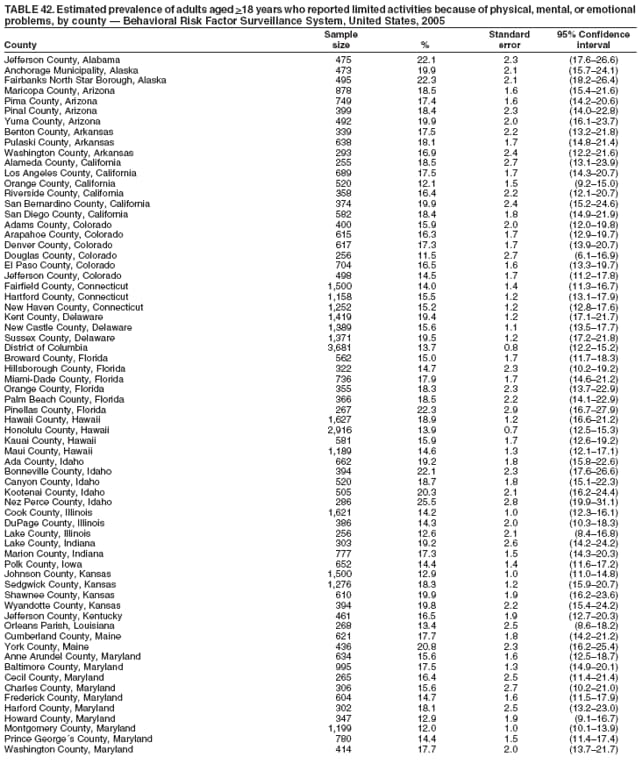  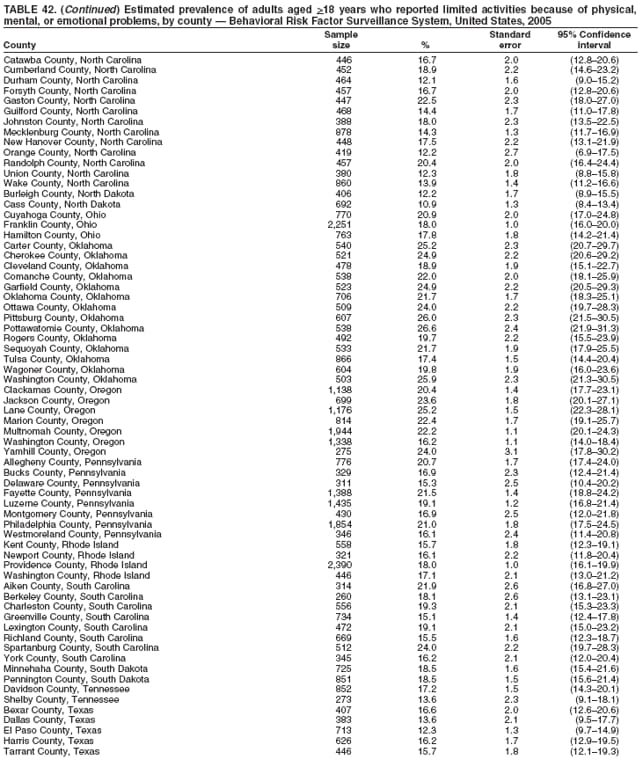 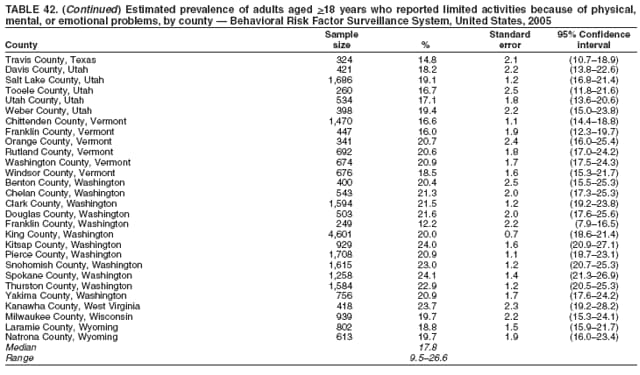 Return to top. Table 43 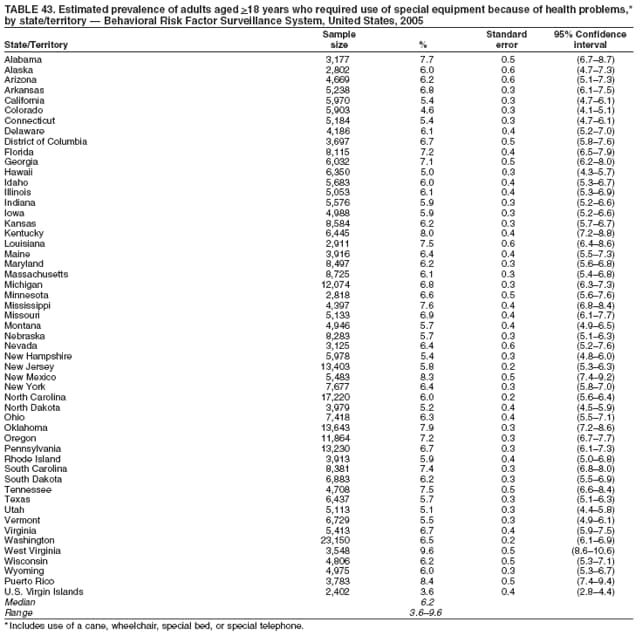 Return to top. Table 44   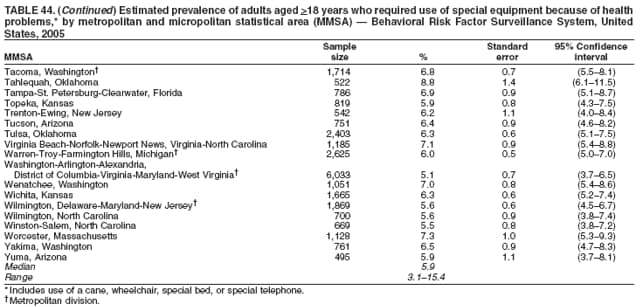 Return to top. Table 45 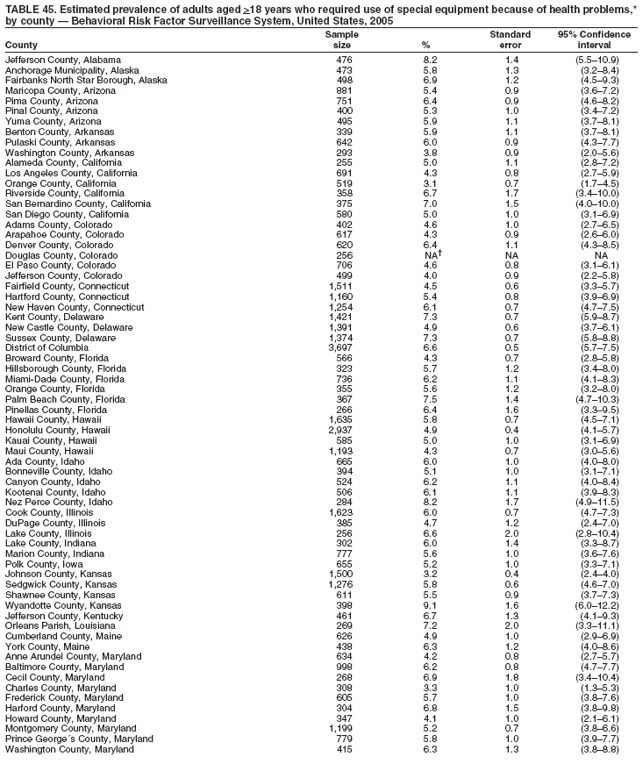 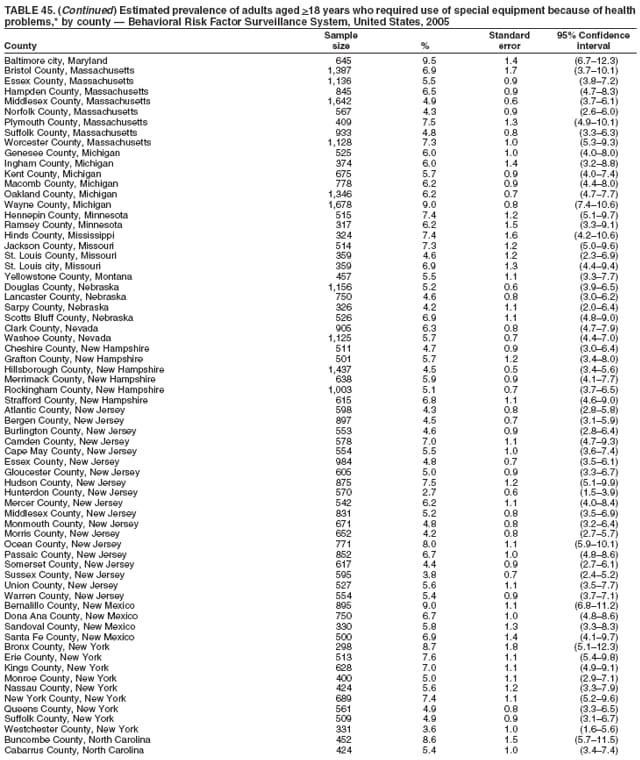  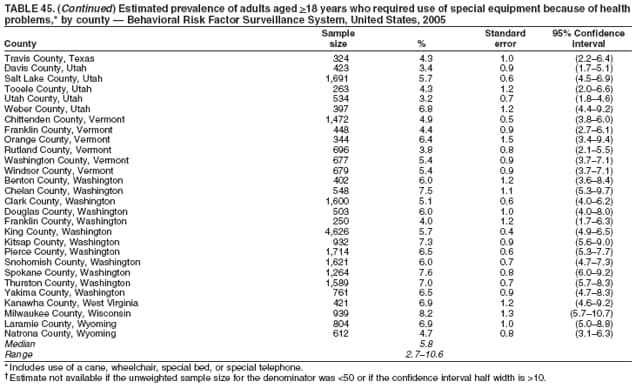 Return to top. Table 46 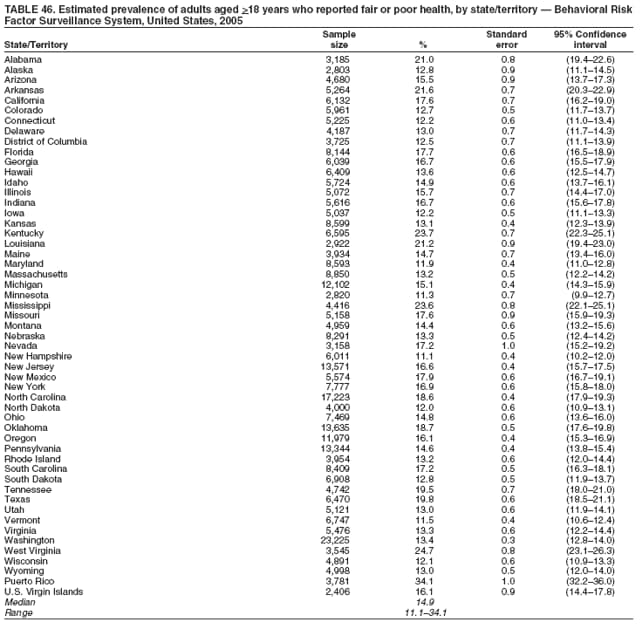 Return to top. Table 47  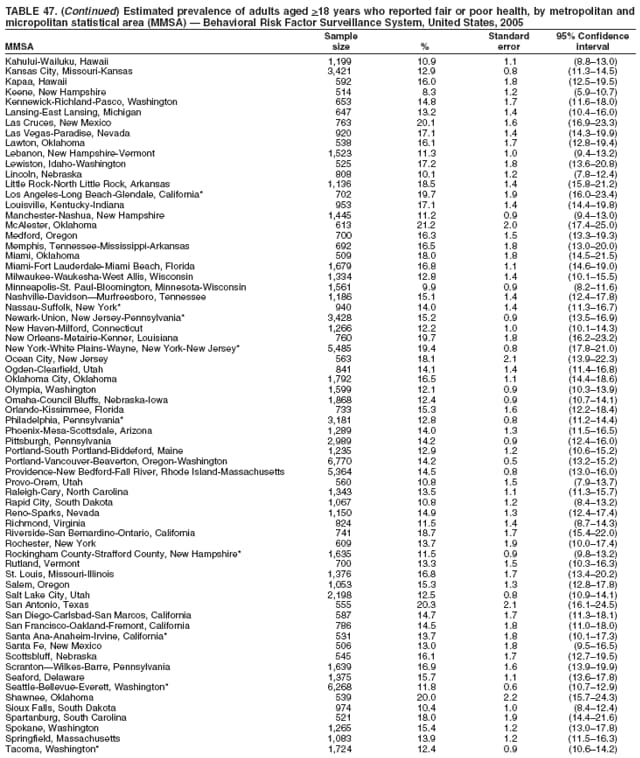 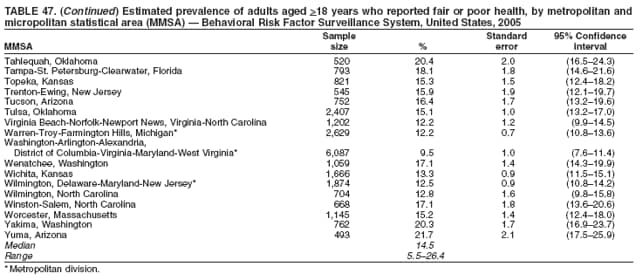 Return to top. Table 48 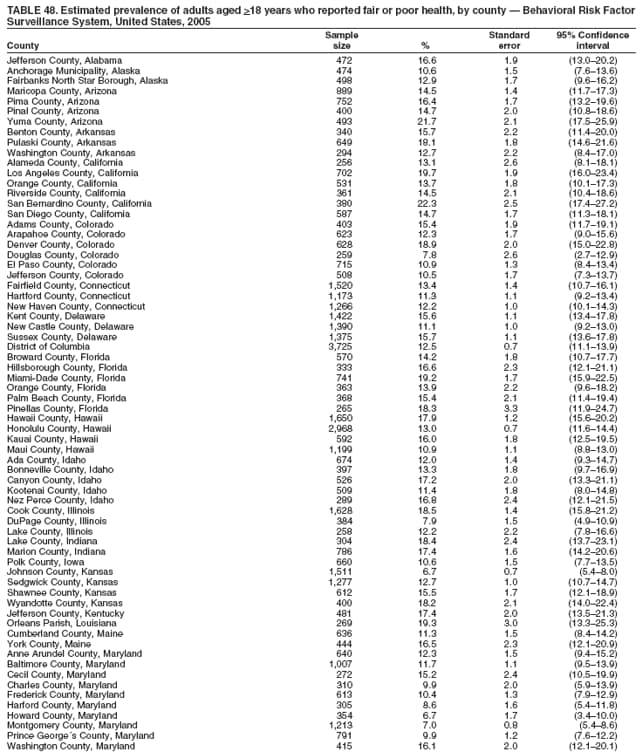  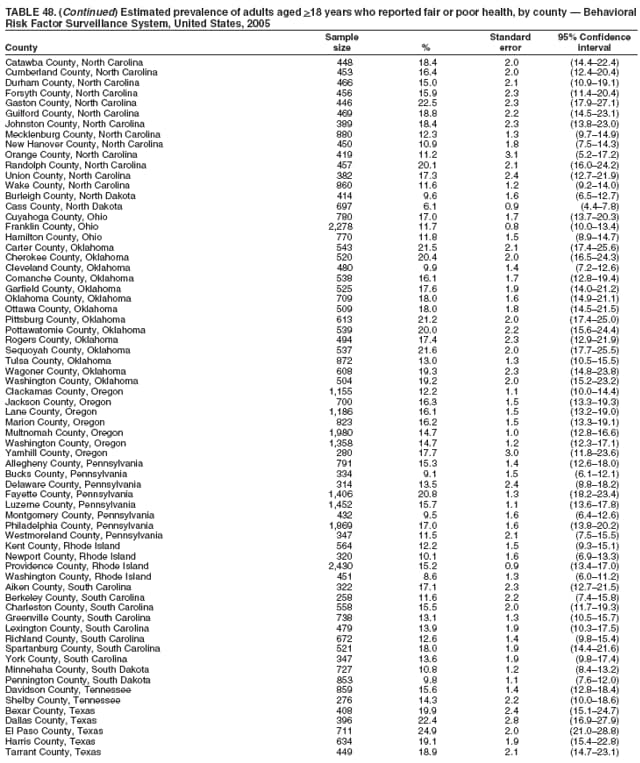 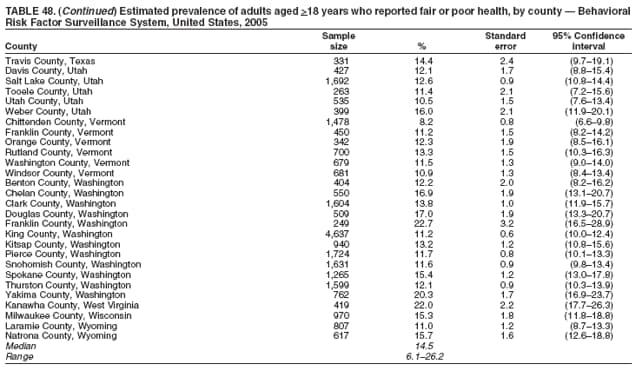 Return to top. Table 49 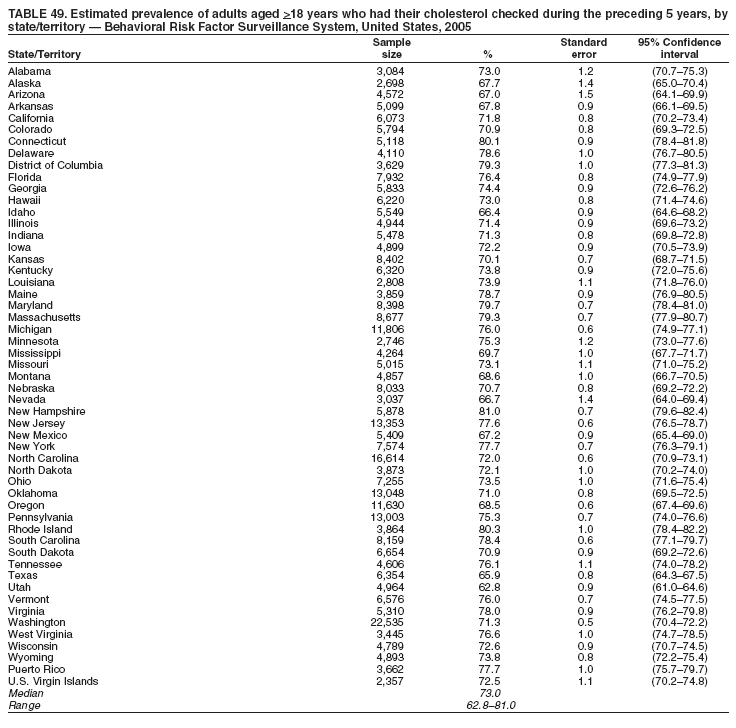 Return to top. Table 50  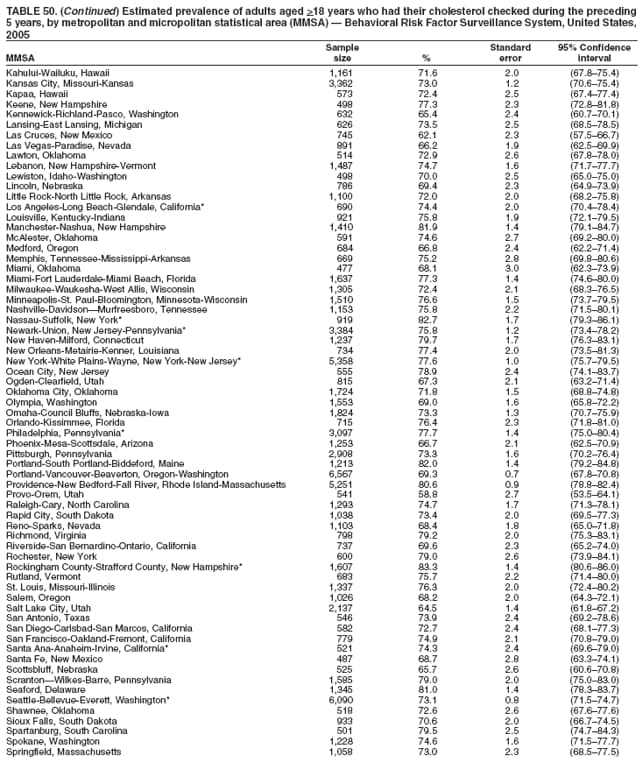 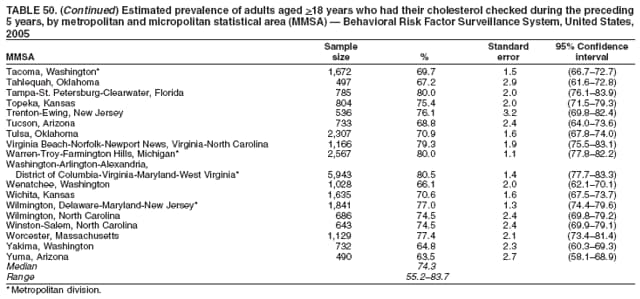 Return to top. Table 51 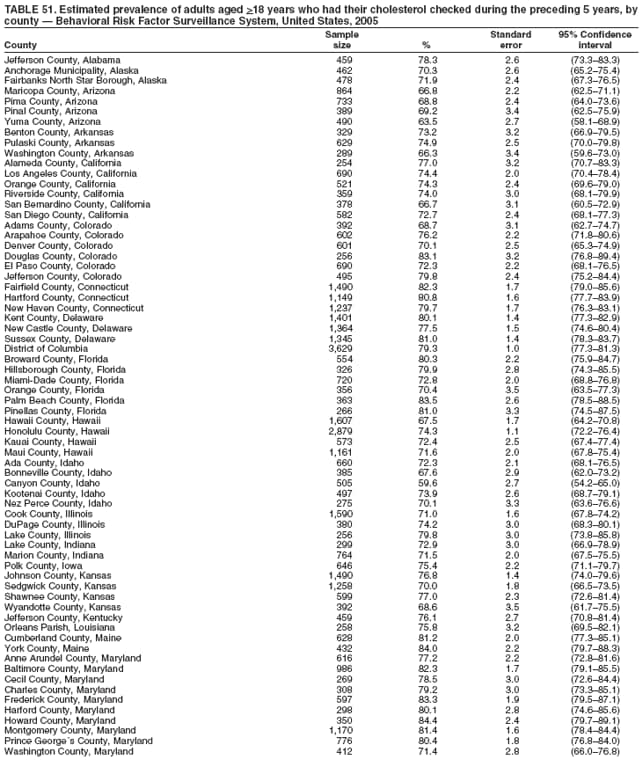 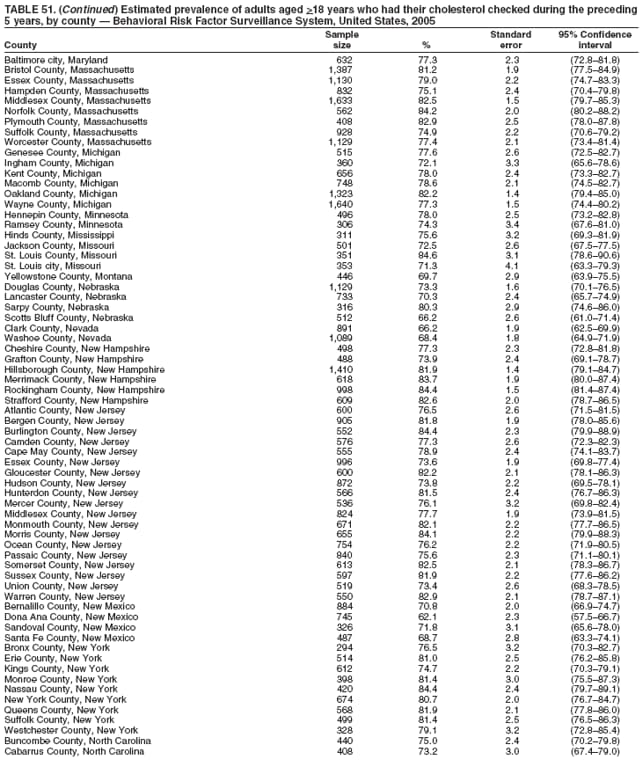 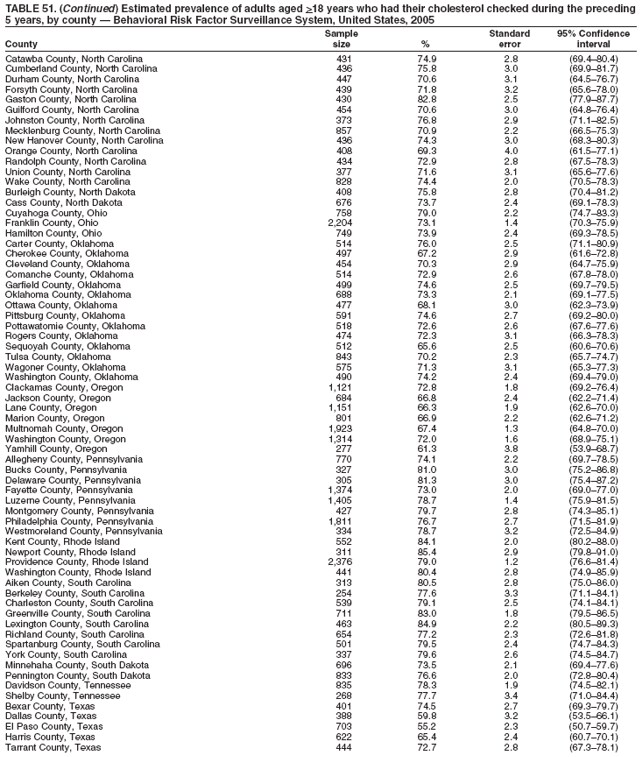  Return to top. Table 52 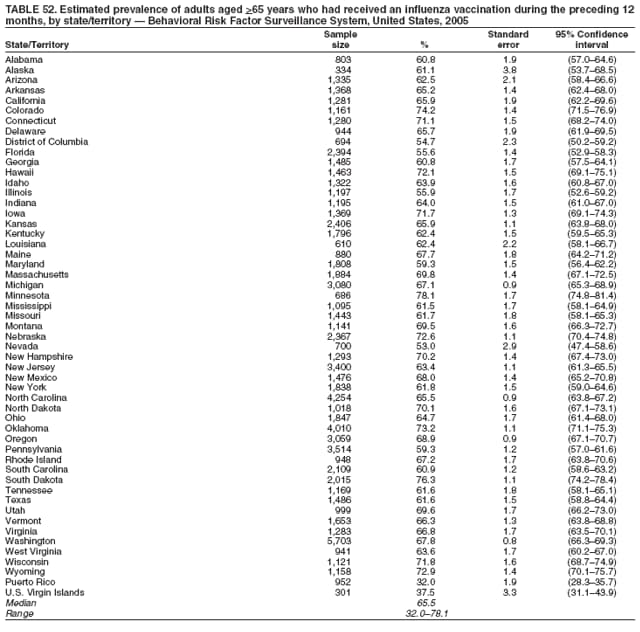 Return to top. Table 53  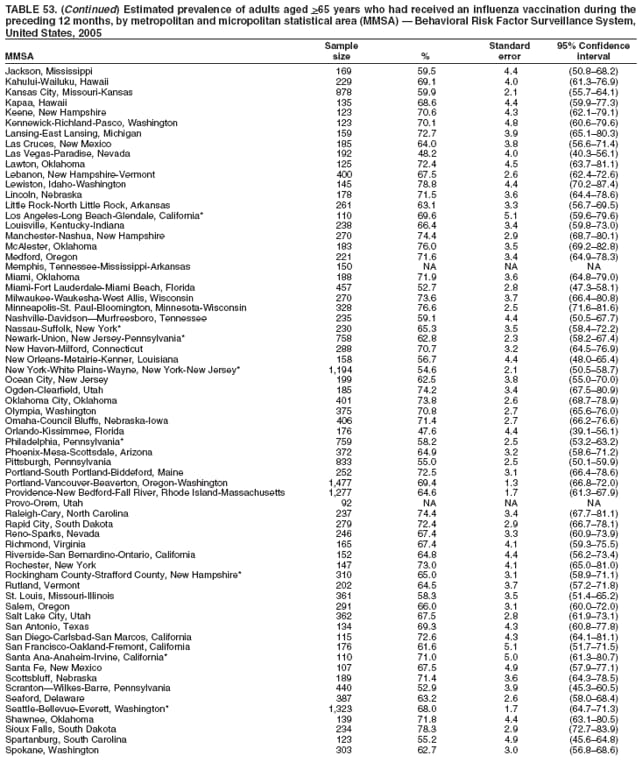 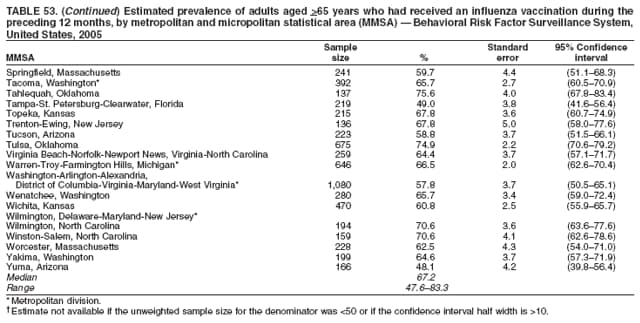 Return to top. Table 54 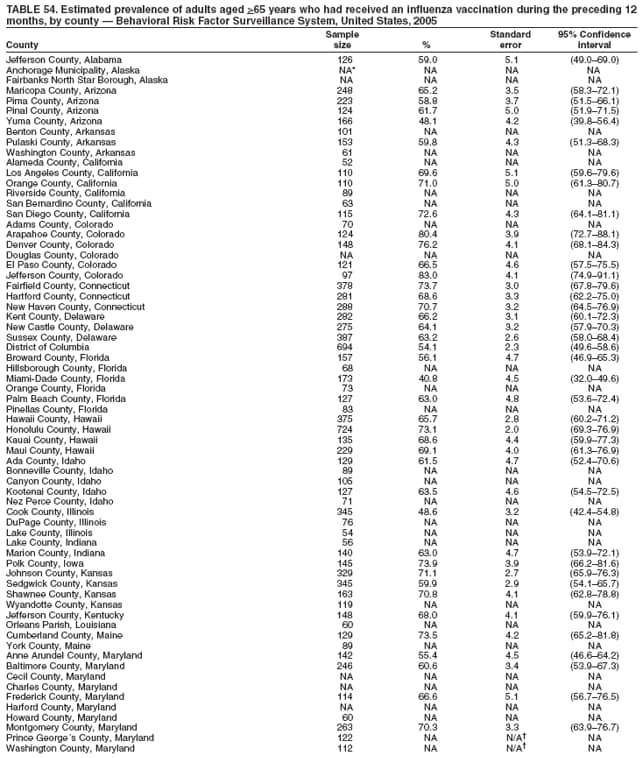 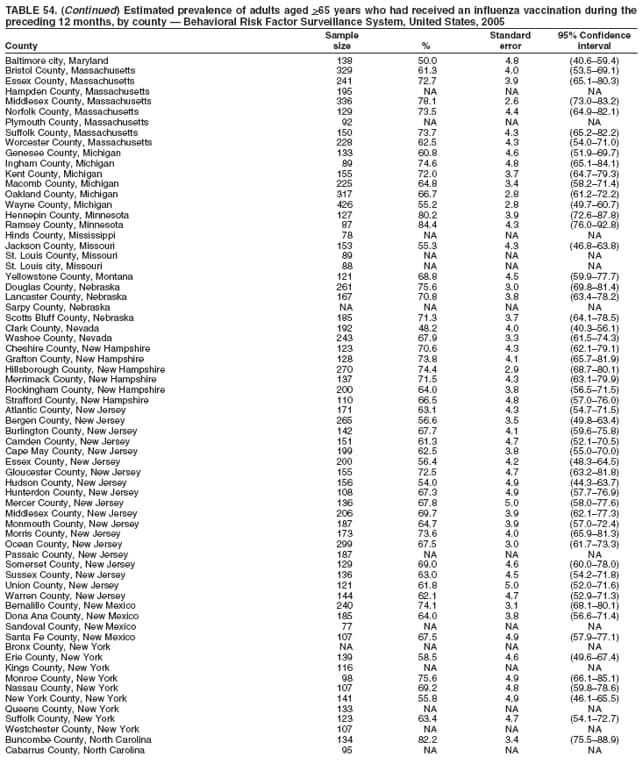  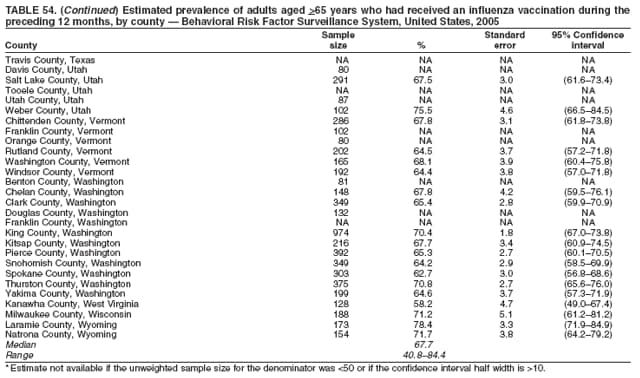 Return to top. Table 55 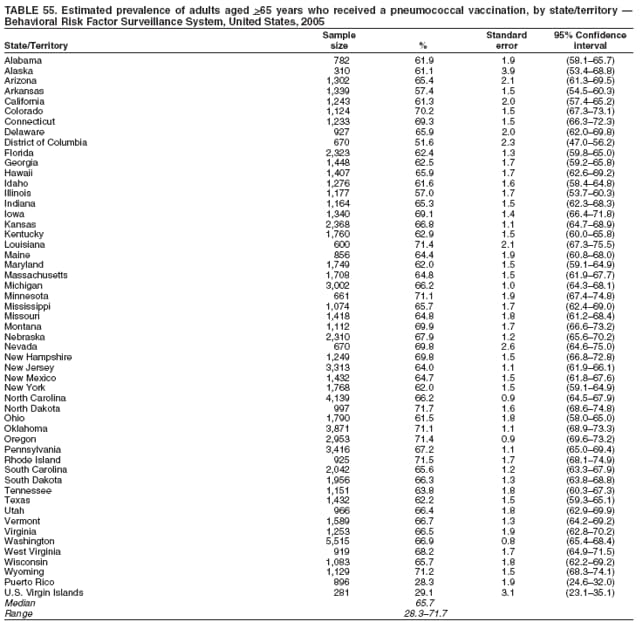 Return to top. Table 56  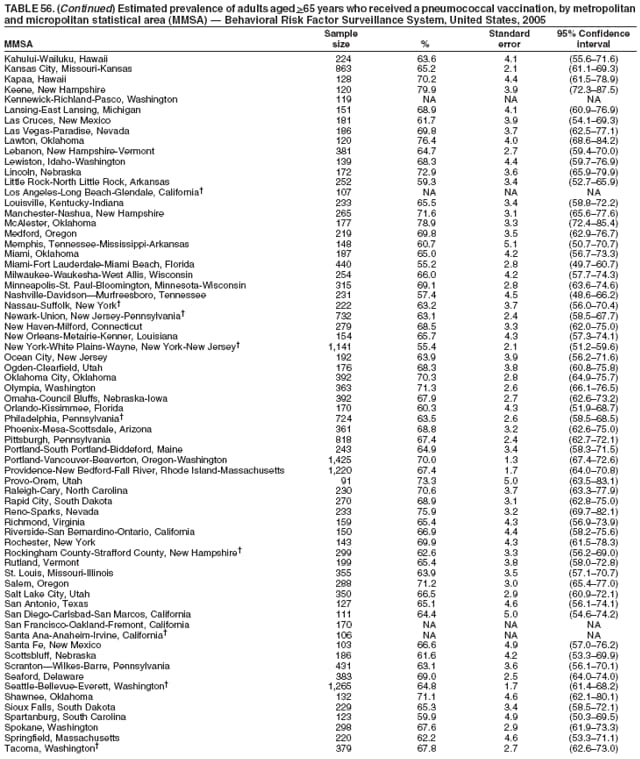 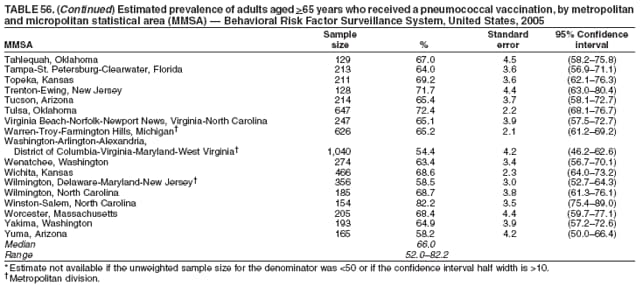 Return to top. Table 57 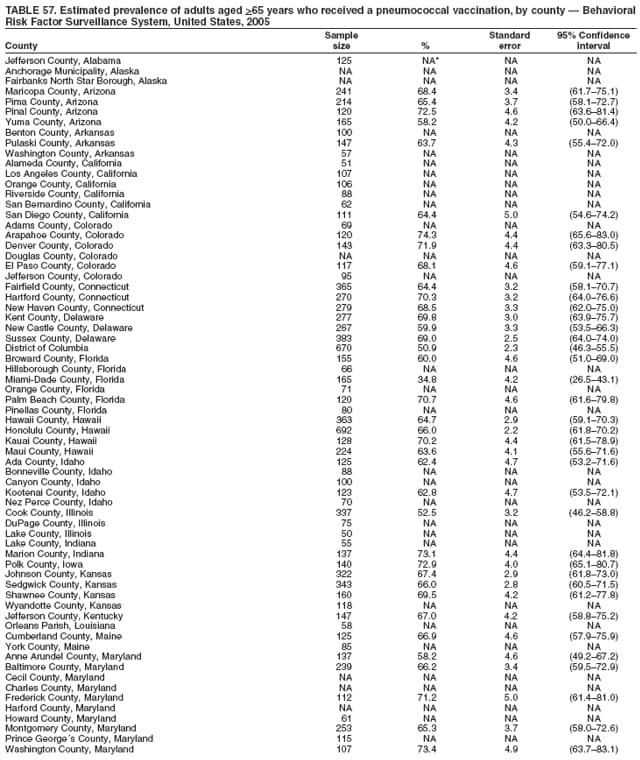 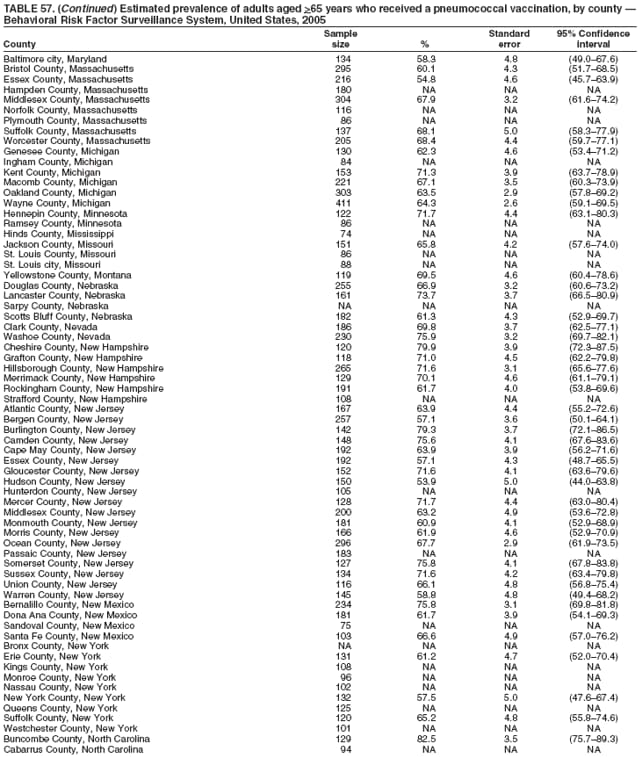 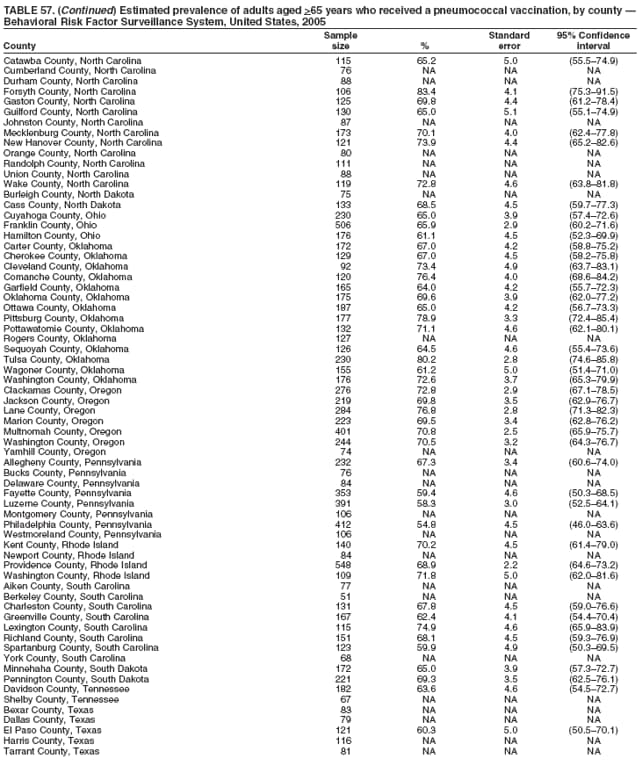  Return to top.
Disclaimer All MMWR HTML versions of articles are electronic conversions from ASCII text into HTML. This conversion may have resulted in character translation or format errors in the HTML version. Users should not rely on this HTML document, but are referred to the electronic PDF version and/or the original MMWR paper copy for the official text, figures, and tables. An original paper copy of this issue can be obtained from the Superintendent of Documents, U.S. Government Printing Office (GPO), Washington, DC 20402-9371; telephone: (202) 512-1800. Contact GPO for current prices. **Questions or messages regarding errors in formatting should be addressed to mmwrq@cdc.gov.Date last reviewed: 4/26/2007 |
|||||||||
|