|
|
|
|
|
|
|
| ||||||||||
|
|
|
|
|
|
|
||||
| ||||||||||
|
|
|
|
|
Persons using assistive technology might not be able to fully access information in this file. For assistance, please send e-mail to: mmwrq@cdc.gov. Type 508 Accommodation and the title of the report in the subject line of e-mail. Prevalence of Autism Spectrum Disorders --- Autism and Developmental Disabilities Monitoring Network, 14 Sites, United States, 2002Autism and Developmental Disabilities Monitoring Network Surveillance Year 2002 Principal Investigators
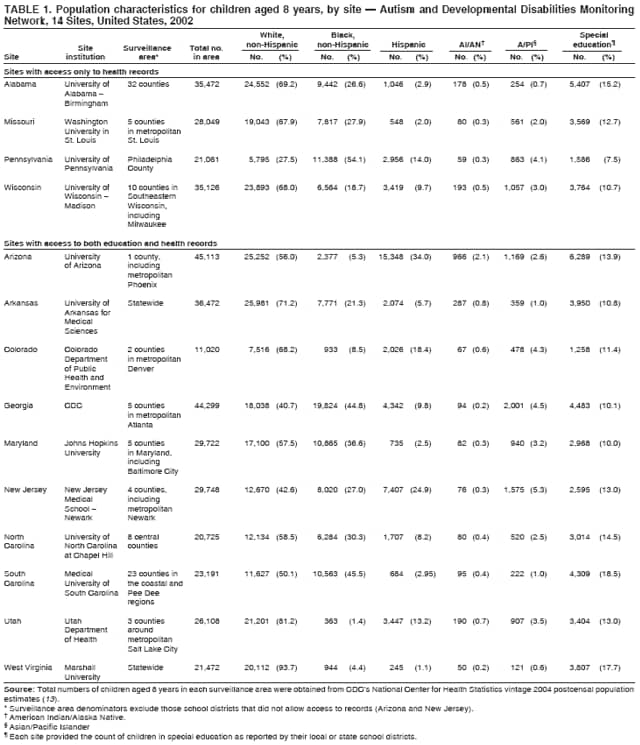
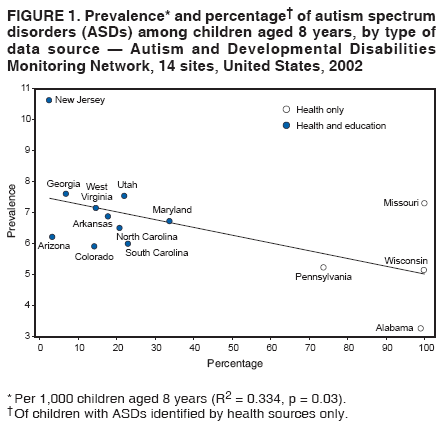
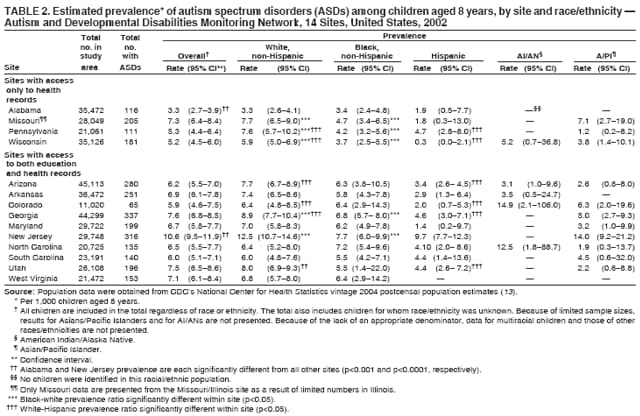
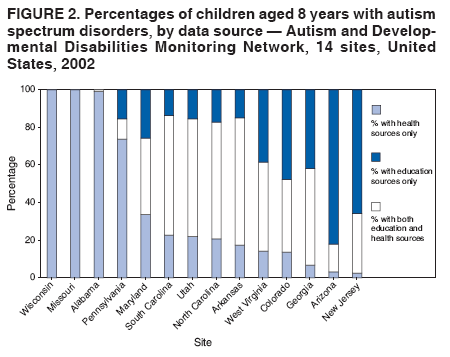
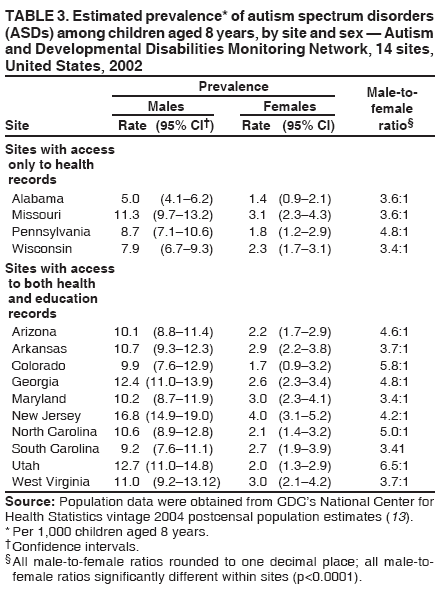
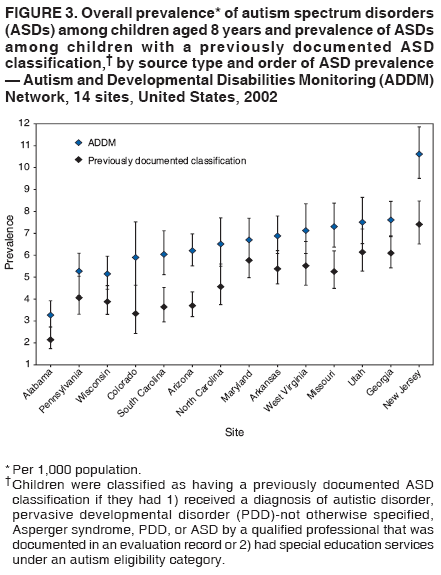
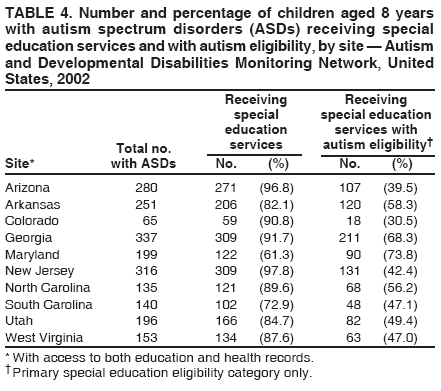
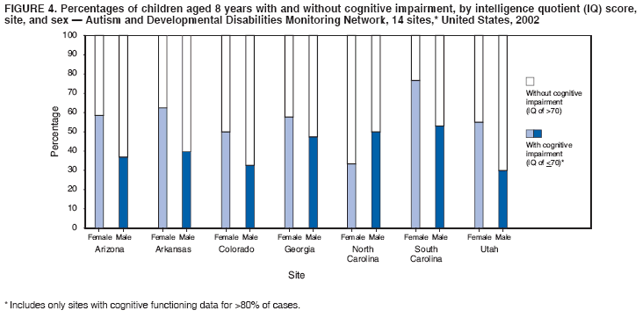
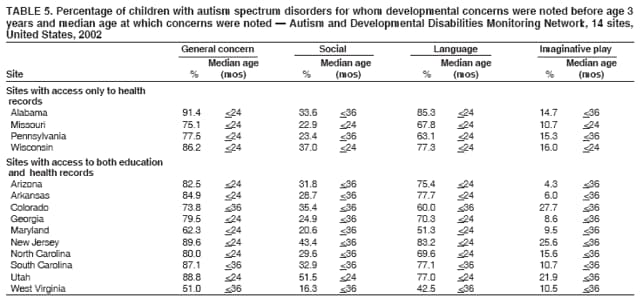
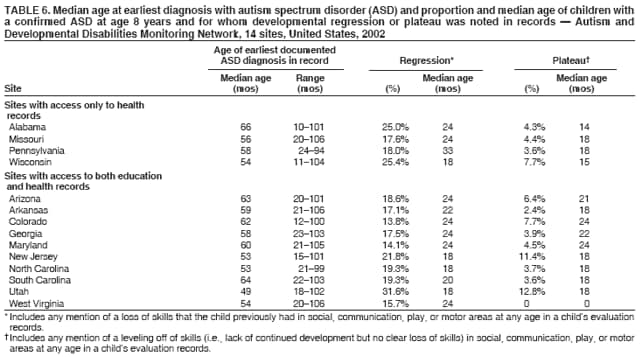
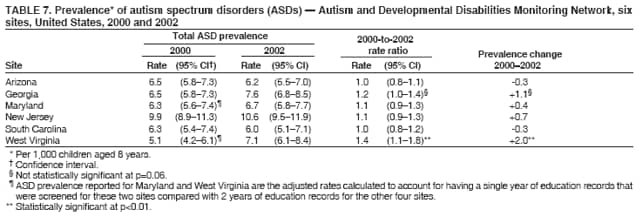
Corresponding author: Catherine Rice, PhD, Division of Birth Defects and Developmental Disabilities, National Center on Birth Defects and Developmental Disabilities, CDC, 1600 Clifton Road, N.E., MS E-86, Atlanta, GA 30333. Telephone: 404-498-3860; Fax: 404-498-3550; E-mail: crice@cdc.gov. AbstractProblem/Condition: Data from a population-based, multisite surveillance network were used to determine the prevalence of autism spectrum disorders (ASDs) among children aged 8 years in 14 areas of the United States and to describe the characteristics of these children. Reporting Period: 2002. Methods: Children aged 8 years were identified as having an ASD through screening and abstraction of evaluation records at health facilities for all 14 sites and through information from psychoeducational evaluations for special education services for 10 of the 14 sites. Case status was determined through clinician review of data abstracted from the records. Children whose parent(s) or legal guardian(s) resided in the respective areas in 2002 and whose records documented behaviors consistent with the Diagnostic and Statistical Manual, Fourth Edition, Text Revision (DSM-IV-TR) criteria for autistic disorder; pervasive developmental disorder, not otherwise specified; or Asperger disorder were classified as having ASDs. Results: For 2002, of 407,578 children aged 8 years in the 14 surveillance areas, 2,685 (0.66%) were identified as having an ASD. ASD prevalence per 1,000 children aged 8 years ranged from 3.3 (Alabama) to 10.6 (New Jersey), with the majority of sites ranging from 5.2 to 7.6 (overall mean: 6.6 [i.e., one of every 152 children across all sites). ASD prevalence was significantly lower than all other sites in Alabama (p<0.001) and higher in New Jersey (p<0.0001). ASD prevalence varied by identification source, with higher average prevalence for ASDs in sites with access to health and education records (mean: 7.2) compared with sites with health records only (mean: 5.1). Five sites identified a higher prevalence of ASDs for non-Hispanic white children than for non-Hispanic black children. The ratio of males to females ranged from 3.4:1.0 in Maryland, South Carolina, and Wisconsin to 6.5:1.0 in Utah. The majority of children were receiving special education services at age 8 years and had a documented history of concerns regarding their development before age 3 years. However, the median age of earliest documented ASD diagnosis was much later (range: 49 months [Utah]--66 months [Alabama]). The proportion of children with characteristics consistent with the criteria for an ASD classification who had a previously documented ASD classification varied across sites. In the majority of sites, females with an ASD were more likely than males to have cognitive impairment. For the six sites for which prevalence data were available from both 2000 and 2002, ASD prevalence was stable in four sites and increased in two sites (17% in Georgia and 39% in West Virginia). Interpretation: Results from the second report of a U.S. multisite collaboration to monitor ASD prevalence demonstrated consistency of prevalence in the majority of sites, with variation in two sites. Prevalence was stable in the majority of sites for which 2 years of data were available, but an increase in West Virginia and a trend toward an increase in Georgia indicate the need for ongoing monitoring of ASD prevalence. Public Health Actions: These ASD prevalence data provide the most complete information on the prevalence of the ASDs in the United States to date. The data confirm that ASD prevalence is a continuing urgent public health concern affecting an approximate average of one child in every 150 and that efforts are needed to improve early identification of ASDs. IntroductionPersons with autism spectrum disorder (ASDs)* have impairments in social, communicative, and behavior development that typically are identified before age 3 years, often accompanied by abnormalities in cognitive functioning, learning, attention, and sensory processing (1). ASDs represent a spectrum of behaviorally defined conditions that are diagnosed through clinical observation of development. The complex nature of these behaviorally defined disorders, coupled with the current lack of genetic or biologic markers for early and consistent identification, make epidemiologic investigation challenging. Although autism was defined previously primarily as autistic disorder and thought to be rare, autism is now considered one of multiple ASDs (2,3). During the 1990s, the number of persons reported to be receiving services for ASDs increased substantially (4--9). In California, the number of persons receiving services for autism increased approximately 300% during 1987--1998 and approximately 100% during 1998--2002 (4,5). After adjusting for changes in population size, prevalence for persons in the 1987--1994 birth cohorts receiving autism services in California increased from 0.6 to 1.5 per 1,000 population (6). In Minnesota, steady increases have been demonstrated in the prevalence of diagnosed autism among three birth cohorts (7); prevalence in children aged 8 years increased from 2.0 per 1,000 population in the 1997--1998 school year to 6.6 per 1,000 population in the 2001--2002 school year. Nationwide, the number of children receiving special education services for autism increased 500% from the 1991--1992 school year to the 1998--1999 school year (8). Data comparing the prevalence of autism with other disabilities for successive birth cohorts of school children indicated that among children aged 10 years, autism prevalence per 1,000 children increased from 0.5 in the 1984 birth cohort to 1.8 in the 1990 birth cohort; increases were greater in children aged 6 years, increasing from 0.5 in the 1986 birth cohort to 2.4 in the 1994 birth cohort (9). Although more children are being identified with an ASD than in the past, receipt of educational or intervention services under an autism classification does not necessarily identify all persons with the behavioral profile indicative of an ASD and might not provide an accurate picture of total prevalence in the population (1,10). Studies that relied exclusively on single-source administrative data sets (e.g., clinic service records or annual reports of special education counts) are reportedly problematic (9,11,12). Single-source service data sets most likely underestimate prevalence and might not adequately capture population changes over time. Elevated public concern regarding the increase in reported ASD prevalence underscores the need for systematic public health monitoring (11,13). In 2000, CDC organized the Autism and Developmental Disabilities Monitoring (ADDM) Network, a multisite, multiple-source, records-based surveillance program to collect data for determining prevalence of ASDs and other developmental disabilities (13). The ADDM Network conducts detailed screening and review of behavioral data from multiple educational and health facilities concerning children who have been evaluated for a range of developmental conditions and applies standard criteria for case identification, ascertainment, and case classification across multiple surveillance sites. Ongoing planning and cooperation among ADDM Network programs has been based on collaboration across multiple disciplines, organizations, and agencies. The first study conducted by the ADDM Network reported results for 2000 from six sites in selected areas of Arizona, Georgia, Maryland, New Jersey, South Carolina, and West Virginia and established baseline period prevalence for ASDs by race/ethnicity and sex and described multiple associated characteristics (e.g., cognitive impairment) (14). In 2000, total ASD prevalence per 1,000 children aged 8 years in the six surveillance sites ranged from 4.5 in West Virginia to 9.9 in New Jersey (overall mean: 6.7). In 2002, to determine the prevalence of ASDs in additional areas of the United States, funding was provided to add eight sites in addition to the six studied previously. This report presents results for 2002 from the 14 sites studied, describes prevalence for ASDs overall and by race/ethnicity and sex and provides information concerning multiple associated characteristics. The additional data provided by the expanded ADDM Network will provide information regarding the prevalence and population characteristics in a large cohort of children in selected U.S. areas. Because six of these sites also collected data on ASD prevalence in 2000, changes in overall prevalence in these sites also are reported. MethodsStudy Sites and Population CharacteristicsCDC and 13 project teams at state health departments or at universities working on behalf of their state health departments (Table 1) collaborated in monitoring reported occurrence of ASDs during 2002 in selected areas of Alabama (northern 32 counties), Arizona (one county, including metropolitan Phoenix), Arkansas (statewide), Colorado (two counties in metropolitan Denver), Georgia (five counties in metropolitan Atlanta), Maryland (five counties, including Baltimore City), Missouri (five counties in metropolitan St. Louis) New Jersey (four counties, including metropolitan Newark), North Carolina (eight central counties), Pennsylvania (Philadelphia County), South Carolina (23 counties in the Coastal and PeeDee regions), Utah (three counties in the Salt Lake City metropolitan area), West Virginia (statewide), and Wisconsin (10 counties in southeastern Wisconsin, including metropolitan Milwaukee). The Missouri site originally included three counties in Illinois that are considered part of metropolitan St. Louis, but data from these counties are not presented because the limited sources of data resulted in incomplete prevalence estimates. The number of children aged 8 years in the 14 surveillance sites ranged from 11,020 in Colorado to 45,113 in Arizona. Distribution according to race or ethnicity among children aged 8 years varied across surveillance sites (15). The percentage of non-Hispanic white children ranged from 27.5% in Pennsylvania to 93.7% in West Virginia; the percentage of non-Hispanic black children ranged from 1.4% in Utah to 54.1% in Pennsylvania. The breakdown by sex was similar across sites, with approximately equal distribution of male and female children. Sites were selected through a competitive process that evaluated their ability to conduct ASD surveillance. They were not selected to reflect a nationally representative sample. The population of children studied (approximately 400,000) represented approximately 10% of the U.S. population aged 8 years in 2002. Each site met applicable local Institutional Review Board or other privacy and confidentiality requirements, or both. In three sites (Colorado, Utah, and West Virginia), ASDs were considered reportable conditions under state public health statute or administrative regulation. Surveillance Methods and Case DefinitionThe methodology used by the ADDM Network was based on CDC's Metropolitan Atlanta Developmental Disabilities Surveillance Program (MADDSP), an active, population-based surveillance program that monitors the occurrence of developmental disabilities among children aged 8 years in the metropolitan Atlanta area (1,16,17). The ADDM Network implemented the basic MADDSP methodology using a common case definition and standardized data abstraction, clinician review, and quality assurance procedures for the first year of surveillance in 2000 (13,14). For 2002, the case definition was modified to incorporate a brief screening, abstraction, and review of children's records if the child already had a documented ASD diagnosis or special education eligibility of autism. Case Definition Children born in 1994 who had at least one parent or legal guardian who resided in the study area during 2002 were classified by clinician reviewers as having an ASD if they either 1) had a documented previous classification of an ASD (i.e., the child had either an uncontradicted record of an autistic disorder or ASD diagnosis provided by a qualified examiner or documentation of qualification for special education services during 1994--2002 under an autism eligibility category) or 2) did not have a documented ASD classification but had an evaluation record from an educational or clinical source indicating unusual social behaviors consistent with an ASD. For children with a documented previous classification of an ASD, case status was confirmed on the basis of the existing ASD classification from the evaluation source records. For children without a documented ASD classification, data were abstracted on all pertinent ASD and developmental behaviors from education or health developmental evaluation to determine whether behaviors described in the child's evaluations by clinical reviewers were consistent with the criteria listed in the Diagnostic and Statistical Manual of Mental Disorders, Fourth Edition, Text Revision (DSM-IV-TR) (2) for autistic disorder, PDD-NOS (including atypical autism), or Asperger disorder. Because the number and quality of criteria specified by DSM-IV-TR are lower for diagnosis of PDD-NOS or Asperger disorder than for autistic disorder, an additional stricter requirement was added that at least one of the autism-specific behaviors be of a sufficient quality or intensity to be highly indicative of an ASD (14). For example, in the case definition, the DSM-IV-TR social criterion of "limited social or emotional reciprocity" was defined as requiring a specific impairment (e.g., "rarely responds verbally or nonverbally to a social approach from others in a familiar setting"). The more stringent criterion for PDD-NOS or Asperger disorder was used because case status was determined solely on the basis of information contained in evaluation records. The case definition focused on identifying the overall presence of an ASD rather than on attempting to identify specific subtypes of ASDs. Case determination was completed in two phases: case ascertainment and clinician review. Case Ascertainment Children suspected of having an ASD who satisfied the age, surveillance year, and residency requirements were identified through screening evaluation records (e.g., assessments to determine the need for special education services or the presence of a developmental disorder). Records were screened at multiple educational or health sources (including state health facilities, hospitals, clinics, diagnostic centers, and other clinical providers), or at both for documented or suspected ASD classifications and for descriptions of behaviors associated with an ASD diagnosis. All sites screened files from health sources that maintained evaluation records for children with developmental disabilities, particularly ASDs. The files that were screened were identified by having a diagnostic or billing International Classification of Diseases, Ninth Revision (ICD-9) (18) code for child neurodevelopmental disorders (e.g., speech and language disorders). All sites were either state health departments or acted as their heath department representative to collect or receive information used for protecting public health (19). On the basis of site-specific collaboration with their state and local departments of education, 10 sites (Arizona, Arkansas, Colorado, Georgia, Maryland, New Jersey, North Carolina, South Carolina, Utah, and West Virginia) (Table 1) also screened the special education evaluation records retained by schools of children receiving special education services during the 2001--2002 or 2002--2003 school years (or both years). One site (Pennsylvania) screened a limited subset of children's special education records after parental authorization to review the records. For children with a previously documented classification of an ASD, limited abstraction and review of evaluation records was conducted. This limited (or "streamlined") review based on data obtained from MADDSP ASD surveillance indicated that 98% of children aged 3--10 years with a previous ASD diagnosis and 99% of children with previous autism eligibility for special education services satisfied the surveillance criteria for having an ASD (1). The streamlined abstraction included demographic and school service data, psychometric test results, developmental history, and evaluation summaries but excluded verbatim descriptions of behaviors associated with autism; this review was employed by 12 of the 14 sites (all except South Carolina and West Virginia). On the basis of local diagnostic practices (3), each site chose one of the three following scenarios to qualify a record for limited abstraction: 1) a record that documented a previous diagnosis of an ASD (i.e., autistic disorder, PDD-NOS, or Asperger disorder) as indicated by a corresponding ICD-9 (19) code or a written diagnosis; 2) a record that documented a previous diagnosis of "autistic disorder" as indicated by a corresponding ICD-9 code or a written diagnosis; or 3) a record that documented that the child had been previously served in a special education program under an autism eligibility category. All other records that were not consistent with the criteria for streamlined abstraction were fully abstracted, including an abstraction of verbatim descriptions of behaviors predetermined to be associated with an ASD. For all abstracted records, information from multiple sources was combined into one composite summary for each child. Clinician Review The clinician review process has been described previously and consists of systematic classification of behaviors and case status by qualified reviewers (1,13). Before clinician review, interrater reliability was established among reviewers according to standards, and only clinicians that met reliability standards were permitted to assign case status. Continuing interrater reliability checks were conducted on a random sample of 15% of fully abstracted records. These were scored independently by a second reviewer. For all sites, the percent of agreement for final case definition was acceptable (79%--100%; Kappa = 0.55--1.00) (3). For records that underwent limited abstraction because of a previously documented ASD classification, children were considered to meet the ASD case definition on the basis of the previously documented diagnosis unless 1) conflicting information was noted in the record, 2) the reviewer needed additional information, or 3) the record indicated that an ASD had been ruled out as a diagnosis. In those circumstances, a full abstraction was performed, and the case was reviewed again by the clinician reviewer. Data abstracted were reviewed and scored by an ASD clinician reviewer according to a coding guide on the basis of DSM-IV-TR criteria (2). Any statement of general developmental concerns or delays in the areas of social skills, language, or symbolic play at age <3 years was scored, as were indications of behavioral regression or a plateau in skill development. Descriptions of associated features (e.g., odd responses to sensory stimuli, or abnormalities in eating, drinking, or sleeping) also were coded. Analytic MethodsThe race/ethnicity of each child was determined from information contained in the source records or, if not located in the source file, from birth certificates (if available). Period prevalence estimates were calculated using as the denominator the number of children aged 8 years residing in the surveillance area according to the National Center for Health Statistics (NCHS) vintage 2004 postcensal population estimates for July 1, 2002 (15). NCHS datasets provide estimated population counts by county, single year of age, race, Hispanic origin, and sex. Poisson approximation to the binomial distribution was used to calculate 95% confidence intervals (CIs) for prevalence (20). Race- or ethnicity-specific rates used five categories: non-Hispanic white, non-Hispanic black, Hispanic, Asian/Pacific Islander, and American Indian/Alaska Native. Prevalence results are reported per 1,000 children aged 8 years. Chi-square tests were used to compare prevalence estimates within and across sites within the 2002 surveillance year, and rate ratios were used to compare prevalence changes within each site from the years 2000 and 2002 (21,22). A maximum p value of <0.05 was used for all tests of statistical significance. The majority of sites considered the same broad criteria of eligible children (i.e., ICD-9 codes and categories of educational exceptionality). However, seven sites (Alabama, Arkansas, Georgia, North Carolina, South Carolina, Utah, and Wisconsin) reviewed records for additional ICD codes because they also were conducting surveillance for other developmental disabilities or because they added locally used codes that might have identified additional cases of ASDs. To facilitate an evaluation of the potential effect on ASD prevalence of reviewing health records for children with ICD-9 codes requested by certain sites, the number of children who were identified solely on the basis of those additional codes were identified (3). Two sites (Arizona and New Jersey) had a few school districts in their entire surveillance area that did not participate. Because school records were critical to case ascertainment and those districts represented clearly defined geographic boundaries, final geographic study areas were finalized by removing these school districts from the surveillance area. Children who resided in nonparticipating school districts were subtracted from the denominator and, if a case was ascertained at a health source, it also was not included in the site's numerator. Because the NCHS postcensal population estimates were available only at the county level (15), enrollment data from nonparticipating school districts were used to curtail denominators. School enrollment data were obtained from the U.S. Department of Education's National Center for Education Statistics (23). Enrollment counts of students in third grade during the 2002--03 school year were noted to differ from NCHS postcensal population estimates (15), which was attributed primarily to children being enrolled out of the customary grade for their age, in private schools, or home-schooled. Because these differences varied by race and sex within the applicable counties, enrollment counts were adjusted by compiling data for all districts within each county, stratifying by race and sex, and comparing to NCHS postcensal counts. This provided an adjustment factor for each race-sex stratum on the basis of its variance from the corresponding NCHS estimate for that county. The appropriate adjustment factor was then applied to the stratified enrollment counts for each nonparticipating district, and the adjusted counts were subtracted from the NCHS postcensal estimates used for each county's denominator. At each site, certain education and health records could not be located for review, and at three sites (Colorado, Maryland, and North Carolina), certain schools in the area elected not to participate. These schools did not represent clearly defined geographic boundaries, so they could not be excluded from the final surveillance area as was the case when entire districts did not participate. Therefore, an analysis of the effect of these missing records on case ascertainment was conducted. All children initially identified for screening were first stratified by two factors highly associated with final case status: information source (education only, health only, or both types of sources) and the presence or absence of either an ASD ICD-9 code or autism special education eligibility. The potential number of cases missed because of missing records was estimated under the assumption that within each of these six strata, the proportion of children with missing records who would ultimately be confirmed as ASD cases would have been similar to that of children with no missing records. ResultsTotal Prevalence EstimatesIn 2002, across the 14 sites, total prevalence of ASDs in children aged 8 years ranged from 3.3 (95% confidence interval [CI] = 2.7--3.9) to 10.6 (CI = 9.5--11.9) per 1,000 children (Table 2). The overall mean prevalence was 6.6 (CI = 6.3--6.8) per 1,000 children. Of the 14 sites, 12 were clustered in a tighter range (5.2--7.6 per 1,000 children), and these rates did not differ from each other significantly. However, Alabama's rate (3.3 per 1,000 population) was significantly (p<0.001) lower than all other sites' rates, and New Jersey's rate (10.6 per 1,000 population) was significantly (p<0.0001) higher than all other sites' rates. Sources of Case Ascertainment and Effects on PrevalenceSites varied in the proportion of children aged 8 years whose records were abstracted in their population, ranging from 0.7% in Wisconsin to 2.2% in Colorado, with the majority of sites ranging from 1.0% to 1.8%. ASD prevalence was correlated with the type of data source (p<0.05) (Figure 1). The weighted average ASD prevalence for sites that relied solely on health records to identify ASD cases was significantly lower (5.1 per 1,000 children aged 8 years; CI = 4.7--5.5) than that of sites that relied on both education and health records (7.2; CI = 6.9--7.5) (p<0.0001). Three of the four sites that had limited or no access to special education records (Alabama, Pennsylvania, and Wisconsin) had the lowest three estimates of ASD prevalence (Table 2). Pennsylvania obtained authorization from only 15% of parents with children aged 8 years who were receiving special education services to review their special education records. The review of this sample yielded 17 additional cases. Thus, 85% of potential records were not reviewed, and the number of potential cases from these records is unknown. The prevalence of ASDs in one site (Missouri) without access to special education records was higher than in six of the sites that had full access to both health and education records. No statistically significant variability in ASD prevalence was observed between nine of the 10 sites (range: 5.9--7.6) with access to both school and health records (Table 2). Only the estimated prevalence in New Jersey (10.6 per 1,000 population) was significantly different (p<0.0001). The percentage of ASD cases identified exclusively from school sources varied from zero in sites without access to special education records to nearly 85% in Arizona (Figure 2). Similarly, the percentage identified only at health sources ranged from <10% in Arizona, Georgia, and New Jersey to 100% in the sites without access to school records. Prevalence by Race or Ethnicity and SexFor multiple sites, ASD prevalence also varied to a certain extent by race and ethnicity (Table 2). In 10 sites, prevalence was higher among non-Hispanic white children than among non-Hispanic black children, but this difference was statistically significant (p<0.05) for only five sites (Georgia, Missouri, New Jersey, Pennsylvania, and Wisconsin). In all sites with prevalence estimates for Hispanic children, prevalence was lower for Hispanic than for non-Hispanic white children; this difference was statistically significant (p<0.05) for six sites (Arizona, Colorado, Georgia, Pennsylvania, Utah, and Wisconsin). Prevalence estimates were lower for Hispanic children than for non-Hispanic black children, except for New Jersey, where prevalence was higher among Hispanic children (9.7 per 1,000 population; CI = 7.7--12.3) than among non-Hispanic black children (7.7 per 1,000 population; CI = 6.0--9.9) (Table 2). Overall, population and case numbers were too limited and CIs too wide to provide reliable prevalence estimates for Asians/Pacific Islanders or American Indians/Alaska Natives (Table 2). A consistent finding in all sites was significantly higher (p<0.0001) prevalence of ASDs among males than among females (Table 3). Prevalence among males ranged from 5.0 per 1,000 population (CI = 4.1--6.2) in Alabama to 16.8 (CI = 14.9--19.0) per 1,000 population in New Jersey. Female prevalence ranged from 1.4 per 1,000 population (CI = 0.9--2.1) in Alabama to 4.0 per 1,000 population (CI = 3.1--5.2) in New Jersey. When male-to-female prevalence was compared, observed sex ratios ranged from 3.4:1.0 in Maryland, South Carolina, and Wisconsin to 6.5:1.0 in Utah. Special Education EligibilityFor the 10 sites that had full access to school records, the percentage of children with ASDs receiving special education services through public schools was determined. This percentage was >60% in all 10 sites and >80% in eight sites (Table 4). The percentage of children with ASDs that received special education services with an autism special education eligibility ranged from 31% in Colorado to 74% in Maryland (Table 4). Previously Documented Classification of ASDChildren with a previously documented ASD classification included those who received special education services under an autism special education exceptionality category or those with a diagnosis of ASD documented in their health or education records, or both. In all sites, the prevalence estimated on the basis of having a previous diagnosis of an ASD was lower than that estimated on the basis of the ADDM Network Surveillance methodology (Figure 3). Cognitive FunctioningData regarding cognitive functioning are reported for seven sites in which >80% of children had psychometric test results. The proportion of children in these sites with ASDs who also had cognitive impairment (defined as having intelligence quotient [IQ] scores of <70) ranged from 33.1% in Utah to 58.5% in South Carolina (average: 44.6%) (Figure 4). In six sites (Arizona, Arkansas, Colorado, Georgia, South Carolina, and Utah), females were more likely than males to have cognitive impairment (Figure 4), and in four sites (Arizona, Arkansas, South Carolina, and Utah), females were significantly (p<0.05) more likely than males to have cognitive impairment. Differences between females and males were not statistically significant in Colorado, Georgia, or North Carolina. Only in South Carolina did more than half of males with ASDs have IQ scores of <70, and only in North Carolina did fewer than half of females with ASDs have IQ scores of <70. North Carolina was also the only site that had a higher proportion of males than females with IQ scores of <70. Across all sites, females were more likely than males (58.2% and 41.8%, respectively) (p<0.001) to have IQ scores in the range of cognitive impairment. Developmental CharacteristicsIn all sites, more than half (range: 51.0%--91.4%) of children meeting surveillance criteria for ASDs by age 8 years had documented developmental concerns before age 3 years (Table 5). The most commonly documented early developmental concern was for language skills, followed by social concerns. Documented developmental concerns with imaginative play were least common. The median age of earliest reported ASD diagnosis identified in a child's record ranged from 49 months in Utah to 66 months in Alabama (Table 6). The percentage of children with a documented indication of regression (i.e., loss of previously acquired skills in social, communication, play, or motor areas) ranged from 13.8% in Colorado to 31.6% in Utah, and the median age of regression ranged from 18 months in New Jersey, North Carolina, Utah, and Wisconsin to 33 months in Pennsylvania (Table 6). The percentage with indications of plateau (i.e., lack of continued development without clear evidence of regression) ranged from 2.4% in Arkansas to 12.8% in Utah. Comparison Between 2000 and 2002 Prevalence EstimatesSix sites had determined ASD prevalence previously using the ADDM Network methodology in 2000. Rate ratios were calculated to compare changes in prevalence during 2000--2002. ASD prevalence was stable for four sites (Arizona, Maryland, New Jersey, and South Carolina) and increased 17% in Georgia (p = 0.06) and 39% in West Virginia (p<0.01) (Table 7). Methodological ResultsNew Jersey had the most evaluations available for review per child identified as having an ASD, with the median number of evaluations abstracted for each child ranging from two in Maryland to eight in New Jersey among children with ASDs, and from one in Maryland to five in New Jersey among children without ASDs. Of the seven sites requesting additional ICD-9 codes while conducting surveillance for other disabilities, three sites (Alabama, Arkansas, and Utah) did not identify any additional cases, two sites (Georgia and North Carolina) identified <1% of their ASD cases exclusively on the basis of the additional codes, and Colorado and Wisconsin identified 1.5% and 3.3% respectively of their ASD cases exclusively from the additional codes. On the basis of these findings, sites that used only the core ICD-9 codes for ASD case finding might have increased their case yield by 0--3%, if additional codes were requested. DiscussionThe ADDM Network surveillance method applies a standardized case definition to detailed behavioral data collected from health and education records of children evaluated for various developmental concerns. In the 14 areas studied in 2002, ASD prevalence estimates for children aged 8 years ranged from 3.3 per 1,000 population in Alabama to 10.6 per 1,000 population in New Jersey. The other 12 sites had a more restricted range (5.2--7.6 per 1,000 children aged 8 years identified with an ASD). The average prevalence estimate of 6.6 per 1,000 population (CI = 6.3--6.8) for all sites and 7.2 per 1,000 population (CI = 6.9--7.5) from sites with access to education information were consistent with the upper end of the prevalence (5.8--6.7 per 1,000 population) from recent epidemiologic studies using active population screening and clinical case confirmation in children (1,14,24--35). The higher rate identified in New Jersey was consistent with rates of 11.6 and 12.1 per 1,000 population recorded in two other recent studies (36,37) indicating that approximately 1% of children were identified with an ASD. The lower rate of ASDs in children aged 8 years in Alabama and the higher rate in New Jersey, compared with the other 12 sites, indicates the importance of continued evaluation of cross-site variation and trends in prevalence in the United States. ASD Prevalence by Race/Ethnicity and SexThe majority of sites had sufficient populations to evaluate differences in ASD prevalence for non-Hispanic white and non-Hispanic black children. A trend was noted for non-Hispanic white children to have slightly higher prevalence estimates than non-Hispanic black children. This difference was statistically significant in three of the four sites for which access to health records only was possible (Missouri, Pennsylvania, and Wisconsin), but in only two of the 10 sites (Georgia and New Jersey) for which access to health and education records existed. In sites for which access to both health and education records existed, a statistically significant overall difference was noted by race, with more non-Hispanic white children (average: 7.7 per 1,000 population) than non-Hispanic black children (average: 6.5 per 1,000 population) identified as having an ASD. With the exception of New Jersey, prevalence for Hispanic children was lower than for non-Hispanic white or non-Hispanic black children. For American Indian/Alaska Native or Asian/Pacific Islander children, great variability was noted in prevalence of ASDs across sites, with small case and population numbers in each population contributing to highly imprecise site estimates. Differences in the racial or ethnic distribution of ASDs for populations other than non-Hispanic white and non-Hispanic black children should be interpreted with caution. Although racial differences are often reported not to be significant in children with ASDs (38), few studies have been based on large, diverse populations (1). These data indicate that ASD prevalence might vary by race/ethnicity; however, reasons for the differences need further investigation. Sociodemographic factors might influence both who gets evaluated for developmental concerns and how those concerns and behaviors are documented (39). Further analysis is needed of the sociodemographic features of the children identified with ASDs and identification patterns in evaluation records. All sites identified more males than females with an ASD, with sex-specific ASD prevalence for males ranging from 5.0 in Alabama to 16.8 in New Jersey, and for females from 1.4 in Alabama to 4.0 in New Jersey. Male-to-female ratios ranged from 3.4:1 in Maryland, South Carolina, and Wisconsin to 6.5:1 in Utah. These ratios were similar to results reported previously (38,40--44). The average ASD prevalence across the 10 sites with access to both health and education sources indicated that ASD prevalence was 11.5 per 1,000 population for males and 2.7 per 1,000 population for females, resulting in a 4.3:1 ratio. Investigation is warranted concerning the possibility of differential identification and documentation of ASD symptoms within and across sites for males and females. Overall, these data confirm that ASDs affect males more than females in all areas, and variation in this phenomenon is not wide. The data also highlight the importance of considering sex differences in etiologic investigations of ASDs. Cognitive FunctioningEpidemiologic studies of ASDs commonly include estimates of intellectual functioning, often reporting the proportion of all ASD cases with mental retardation and occasionally investigating differences according to diagnostic subtype. Other population-based studies have reported sex differences in intellectual functioning among children with ASDs, with certain indication of the male-to-female ASD prevalence ratio as decreasing with greater levels of impairment in intellectual functioning (1,38). The current ADDM Network findings indicate that females aged 8 years with ASDs were significantly more likely than males to score in the range of cognitive impairment on their most recent psychometric test. In the seven sites (Arizona, Arkansas, Colorado, Georgia, North Carolina, South Carolina, and Utah) with sufficient intellectual functioning data available, only one (South Carolina) reported more than half of the males with ASD with scores in the cognitively impaired range, and only North Carolina reported fewer than half of the females with ASDs with scores in the cognitively impaired range. In addition, North Carolina was the only site to have a higher proportion of males with cognitive impairment than females; however, the number of females represented by this comparison was low in North Carolina. Four of the remaining sites (Arizona, Arkansas, South Carolina, and Utah) had a significantly higher proportion of females with cognitive impairment compared with males (p<0.05). Overall, more than half of females (58%) and less than half of males (42%) had scores in the cognitively impaired range. Although the ADDM Network methodology does not provide diagnostic subclassification of all children identified with ASDs, the current findings are consistent with other epidemiologic studies showing a higher proportion of males diagnosed with Asperger disorder and PDD-NOS, and a lower proportion of children with these diagnostic subtypes scoring in the range of cognitive impairment (1,39--44). Developmental CharacteristicsChildren with a previously documented ASD classification included those who had received special education services under an autism special education eligibility and those with a clear diagnosis of ASD documented in the education or health source records, or both. Across the sites for which education information was accessible, the proportion of children identified with ASDs receiving special education services with an autism eligibility ranged from 31% in Colorado to 74% in Maryland. The prevalence estimates derived for children aged 8 years with ASDs who had a previously documented ASD classification ranged from 2.2 per 1,000 population in Alabama to 7.4 per 1,000 population in New Jersey. For all sites, the prevalence calculated from having a previous classification of ASD was lower than the ADDM Network prevalence of having an ASD. These results indicate that if an ASD is identified on the basis only of a documented diagnosis or eligibility for autism on record, prevalence would have been underestimated by as much as 30%. An experienced clinician using standardized methods can reliably diagnose autism in children as young as age 2 years (45). Across the ADDM Network sites, the majority of children aged 8 years had diagnostic evaluations indicating general developmental concerns before age 3 years. Concerns in language development were generally noted at younger ages than concerns in social or imaginative play. However, age at first documented ASD diagnosis in the reviewed records varied greatly, from 10 months in the areas studied in Alabama to as late as 8 years, 10 months in the areas studied in Arkansas, Missouri, and West Virginia. These data confirm an earlier report (46) that a significant lag exists between early concerns and actual identification of an ASD as reported in records in multiple areas of the country, contributing to potentially significant delays in intervention. Given the benefit of early intervention (47), identification of an ASD at earlier ages in the United States is essential to ensure that children receive optimal early intervention services. CDC has been working with caregiver and professional groups to improve the early recognition of developmental concerns and to improve referral for further evaluation and intervention with the "Learn the Signs. Act Early." public awareness campaign (48). Children with an ASD can experience a loss of developmental skills or a plateau in development, or both. Across all ADDM Network sites, 2%--13% of children had a plateau in development that was significant enough to be reported in a developmental evaluation. In addition, 14%--32% of the children were noted to have lost developmental skills at young ages, usually before age 2 years. The majority of ADDM Network sites reported developmental regression below the proportion reported from another study (49) that suggested that 25%--33% of children with an ASD are reported to experience a loss of developmental skills by the second year of life. However, the distinction between a loss of skills and a plateau in skills has not been made in previous studies. Reliance on existing records might not adequately ascertain this feature because certain providers might not evaluate or document the potential for developmental regression. Therefore, these results should be considered a minimal estimate of plateau and regression among ASD cases. Changes in ASD Prevalence During 2000--2002Six sites (in Arizona, Georgia, Maryland, New Jersey, South Carolina, and West Virginia) had previously determined the prevalence of ASD using the ADDM Network methodology in the year 2000 (14). Prevalence was stable for four of these sites (Arizona, Maryland, New Jersey, and South Carolina). In one site (West Virginia), ASD prevalence was significantly higher (p<0.01) in 2002 than in 2000, and the prevalence in Georgia appeared to be increasing, but the change was not statistically significant (p<0.06). New Jersey's ASD prevalence was higher than all other sites in both years, but it did not increase significantly from 2000 to 2002 (among children born in 1992 and 1994, respectively). Whether the disproportionate increase in the West Virginia ASD prevalence was attributable to a true increase in the prevalence of the condition in that state compared with that in the other five areas or was an artifact of the record-review methodology is difficult to determine. Because case status is confirmed by descriptions in records, greater detail in records for the 2002 study year would potentially provide more data that would be needed to confirm cases in this surveillance year than in 2000. An informal, qualitative assessment of differences in the quality and quantity of information contained in evaluation records across sites indicated that the quality and amount of information contained in West Virginia's evaluation records improved over time. However, other factors relating to differential prevalence cannot be ruled out. Future ADDM Network surveillance years will add a rating of the quality of information contained in the records to help evaluate the role that changing quality of records might play in determining prevalence. Further analysis of prevalence in sites with multiple prevalence estimates will be reported in future site-specific analyses and reports. Strengths, Limitations, and Factors Influencing Prevalence EstimatesA strength of the ADDM Network is the consistency in data collection and case determination methods across sites and surveillance years. The ADDM Network surveillance methodology requires standardized training of abstractors and clinician reviewers, ongoing monitoring for quality assurance, and standardization of methods to identify and confirm potential cases and conduct data analysis. The level of detail in the abstracted records from multiple sources, coupled with careful, standardized clinician reviews, improves upon previous estimates based solely on administrative records or single-source surveillance. With the addition of access to both health and education evaluation sources in all sites, the prevalence estimates from this methodology might more closely approximate true prevalence. Although the ADDM Network method has strengths, certain limitations exist. Direct reevaluation of each child to determine case status is not part of a records-based approach to surveillance, thereby minimizing the burden on children and their families. Children identified with an ASD have had case status validated through record review and concordance between having a previous classification of an ASD and being identified as having an ASD is high. However, case identification has not been validated independently against a standard diagnostic reevaluation of each child. A validation study that includes independent examination of children is currently underway at the Georgia site. Multiple factors can contribute to the quality of data and, ultimately, to prevalence estimates (14,50). Variability in prevalence among sites is likely attributable to differences in access to records at all sources, evaluation practices, and the resulting level of detail in records. The majority of ADDM Network sites included as sources of records public schools and major developmental disabilities evaluation and treatment centers serving their respective surveillance areas. The majority of sites did not include private schools, charter schools, and clinical providers or service centers with small numbers of clients (3). The resulting effect on prevalence estimates was difficult to quantify, but might have contributed in some manner to underestimation of prevalence. With the exception of New Jersey's higher prevalence, prevalence estimates were consistent across nine of the 10 sites with access to education evaluations. Prevalence was much more variable among the sites with access only to health evaluations, ranging from 3.3 per 1,000 population in Alabama to 7.3 per 1,000 population in Missouri. Although evaluations at education sources were not reviewed in Missouri, evaluation records were reviewed at regional developmental assessment and intervention centers within the Missouri Department of Mental Health. These sources might have served as a source of detailed ASD case information unique to that site and could have contributed to the Missouri site having the highest ASD prevalence among the sites that did not review education records. For sites with access to education information, a substantial proportion of persons with ASDs (15%--82%) would not have been identified without education data. In addition, a proportion of those cases identified from a combination of education and health data (range: 15%--68% of cases) also might have been missed if the information from education sources was unavailable. Thus, access to information from both health and education sources appears essential for obtaining accurate prevalence and to the success of records-based ASD monitoring in the United States. This emphasizes both the importance of including schools in surveillance activities and of public schools in the evaluation and treatment of children with disabilities. Sources of evaluations by public service agencies doubtlessly provide information on children representing the broad sociodemographic spectrum because all children who show educational impairments are entitled to an evaluation and to a free, appropriate education (50). Because the ADDM Network method screens records of children evaluated or qualified for special education for features of ASDs, regardless of eligibility, this method should eliminate the bias of identifying children with ASD that have additional access to private healthcare sources for evaluation and treatment of developmental concerns. However, further evaluation of potential variability in the quality of information required to confirm ASD case status is needed because there could be systematic variation in information on children's developmental features by type of source or by sociodemographic characteristics of children. A crucial aspect of a records-based surveillance system is being able to actually locate the evaluation record that contains the diagnostic and behavioral information to confirm case status. Sensitivity analyses conducted by all sites determined that files that were eligible for review but not located contributed to an underestimate in prevalence from 0.4% to 20%. Because of unfound files, prevalence might have been underestimated by <5% in eight sites (Alabama, Arizona, Arkansas, Colorado, Georgia, New Jersey, North Carolina, and Wisconsin), by 6%--8% in three sites (Missouri, Utah, and West Virginia), by up to 15% in two sites (Maryland and Pennsylvania), and as high as 20% in South Carolina. The number of the records abstracted at each ADDM Network site could have influenced prevalence estimation (3). A larger pool of children in special education or with evaluations for clinical services could increase the probability of identifying cases; however, sites that abstracted a higher proportion of records per population did not have correspondingly higher prevalence estimates. For example, New Jersey had the highest prevalence, but it did not have a significantly greater proportion of the population identified for special education or a greater proportion of records screened and abstracted than other sites. The majority of sites considered the same broad criteria of eligible children (on the basis of ICD-9 codes and categories of educational exceptionality). However, six sites reviewed records for additional ICD codes because they were also conducting surveillance for other developmental disabilities, or because they added locally used codes. Those extra codes might have identified a few more cases of ASDs, but given the initial breadth of the review criteria, the effect of this activity was likely minimal. A common explanation for increases in ASDs over time has been that changes have occurred in the level of community and professional awareness about the symptoms of ASD and the application of an ASD diagnosis to a wider range of symptomology (10,38,44,51). Because the ADDM Network screens children who have been evaluated for special education or diagnostic services for multiple reasons, the primary way in which increased awareness could account for differences in prevalence across sites, or over time in the same site, is if either differences occurred in who is evaluated for developmental concerns or changes occurred in how the social and other ASD behaviors were documented in the evaluation records. However, across the ADDM Network sites with access to both education and health records, no clear relation existed among sites that identified more students in their populations for special education and the prevalence of ASDs. Using ADDM Network methods in areas in which more children were classified as eligible to receive special education for any reason did not result in identification of more children with an ASD. However, children with an ASD who have not been evaluated or qualified for services documented by the health or education sources might still exist, and this could have underestimated prevalence. For children with evaluation records, the quality of the information in the records might have been a factor. A qualitative review of West Virginia's records during 2000--2002 indicated that more behavioral descriptions existed to confirm case status for the later study year. Also, New Jersey had more evaluations per child and a qualitative review of information indicated more detailed behavioral descriptions. However, if higher prevalence in New Jersey was caused by better symptom documentation in evaluation records, that would suggest that prevalence in other sites might have been underestimated, which would indicate that ASDs could be more common then previously thought. For the 2006 surveillance year, ADDM Network surveillance has included a rating to classify the quality of information in the records. Another factor possibly contributing to variation in prevalence among sites was differential migration in and out of the surveillance area. The prevalence estimates provided in this report are period prevalence based on residency in the study area during 2002. The effects of migration patterns could not be evaluated, but the proportion of children with ASDs who were born in the study areas ranged from 28% in Colorado to 57% in Arizona and Georgia and 85% in Alabama, indicating potentially significant variation in migration patterns across sites. For Colorado, 29% of children identified as having ASDs were born in a neighboring county to the study area counties, indicating potential differential migration around metropolitan Denver based on having a child with a developmental disability. ConclusionThis report has described multiple sources of variability that might be responsible for differences in observed prevalence across study sites. Although certain sources of variability were not easily quantifiable, the inclusion or exclusion of education data was one known source of variability that appeared to have a direct effect on prevalence estimates. Other known and unknown sources of error most likely contributed to an underestimate of ASD prevalence and have been examined elsewhere (3). Despite these limitations, the ADDM Network has provided a comprehensive, population-based monitoring program for ASDs in the United States. Implementation of the ADDM Network requires ongoing collaboration with data sources at each site for access to records. The standardized protocol yielded prevalence estimates that were stable across multiple sites in the country in which access to both education and health records was possible. Although the initial start-up of each site took multiple years, future reports of ASD prevalence should be more timely. In the majority of sites for which 2 years of surveillance data were available, prevalence remained stable; however, a trend existed toward increased prevalence in Georgia and a significant (p<0.01) increase was observed in West Virginia. As the protocol is implemented using the same methods in future years, the ADDM Network will continue to monitor temporal trends in ASD prevalence in specific areas of the United States. Prevalence estimates also will be used to plan policy and educational and intervention services for persons with ASDs. Continuing to monitor the prevalence of ASDs in the United States is important, and more in-depth analyses of case identification by source type, quality of information, and sociodemographic factors should be conducted to improve understanding of these disorders. ADDM Network data provide a solid baseline prevalence with which future estimates can be compared. They also confirm that ASDs are more common then previously thought and are conditions of urgent public health concern. Acknowledgments Information in this report was provided by ADDM Network Surveillance Year 2002 Principal Investigators: Catherine Rice, PhD, Jon Baio, EdS, Kim Van Naarden Braun, PhD, Nancy Doernberg, Division of Birth Defects and Developmental Disabilities, National Center on Birth Defects and Developmental Disabilities, CDC; Russell S. Kirby, PhD, University of Alabama, Birmingham, Alabama; Carole Canino, Mark Swanson, MD, University of Arkansas, Little Rock, Arkansas; Sydney Pettygrove, PhD, Chris Cunniff, MD, F. John Meaney, PhD, University of Arizona, Tucson, Arizona; Lisa Miller, MD, Colorado Department of Public Health and Environment, Denver, Colorado; Cordelia Robinson, PhD, University of Colorado at Denver and Health Sciences Center, Denver, Colorado; Craig Newschaffer, PhD, Johns Hopkins University,Rebecca Landa, PhD, Kennedy Krieger Institute, Baltimore, Maryland; Edwin Trevathan, MD, John Constantino, MD, Washington University in St. Louis, St. Louis, Missouri; Julie Daniels, PhD, University of North Carolina, Chapel Hill, North Carolina; Walter Zahorodny, PhD, Franklin Desposito, MD, New Jersey Medical School, Newark, New Jersey; Jennifer Pinto-Martin, PhD, Ellen Giarelli, EdD, University of Pennsylvania, Susan Levy, MD, Children's Hospital of Philadelphia, Philadelphia, Pennsylvania; Jane Charles, MD, Medical University of South Carolina, Charleston, South Carolina; Judith Zimmerman, PhD, William McMahon, University of Utah, Salt Lake City, Utah; Barbara Becker-Cottrill, EdD, Marshall University, Huntington, West Virginia; Maureen Durkin, PhD, DrPH, University of Wisconsin, Madison, Wisconsin. Additional contributions were provided by Pauline Thomas, MD, New Jersey Medical School, Newark, New Jersey; Joyce Nicholas, PhD, Lydia King, PhD, Medical University of South Carolina, Charleston, South Carolina; Rob Fitzgerald, MPH, Washington University in St. Louis, St. Louis, Missouri. Data collection was coordinated at each site by ADDM Network project coordinators: Meredith Hepburn, University of Alabama, Birmingham, Alabama; Mary Jo Lewno, University of Arkansas, Little Rock, Arkansas; Jennifer Ottolino, University of Arizona, Tucson, Arizona; Andria Ratchford, MSPH, Colorado Department of Public Health and Environment, Denver, Colorado; Maria Kolotos, Johns Hopkins University, Baltimore, Maryland; Rob Fitzgerald, MPH, Washington University in St. Louis, St. Louis, Missouri; Laura Davis, MPH, University of North Carolina, Chapel Hill, North Carolina; Susie Kim, New Jersey Medical School, Newark, New Jersey; Rachel Meade, University of Pennsylvania, Philadelphia, Pennsylvania; Lydia King, PhD, Medical University of South Carolina, Charleston, South Carolina; Lynne MacLeod, MStat, Utah Department of Health, Salt Lake City, Utah; Julie O'Malley, Marshall University, Huntington, West Virginia; Jackie Roessler, MS, University of Wisconsin, Madison, Wisconsin; Anita Washington, MPH, Battelle Memorial Institute, Atlanta, Georgia; Sally Brocksen, PhD, Division of Birth Defects and Developmental Disabilities, National Center on Birth Defects and Developmental Disabilities, CDC. Other ADDM principal investigators include Judith Grether, PhD, Gayle Windham, PhD, California Department of Health Services, Richmond, California; Lisa Croen, PhD, Northern California Kaiser Permanente Division of Research, Sacramento, California; Keith Scott, PhD, Marygrace Yale Kaiser, PhD, University of Miami, Miami, Florida. Additional assistance was provided by project staff, including data abstractors, epidemiologists, data management/programming support. Ongoing support was provided by Joanne Wojcik, Marshalyn Yeargin-Allsopp, MD, Division of Birth Defects and Developmental Disabilities, National Center on Birth Defects and Developmental Disabilities, CDC. References
* In this report, ASD is used to refer to autistic disorder; pervasive developmental disorder, not otherwise specified (PDD-NOS); and Asperger disorder. The terms ASD and autism are used interchangeably. Table 1
Disclaimer All MMWR HTML versions of articles are electronic conversions from ASCII text into HTML. This conversion may have resulted in character translation or format errors in the HTML version. Users should not rely on this HTML document, but are referred to the electronic PDF version and/or the original MMWR paper copy for the official text, figures, and tables. An original paper copy of this issue can be obtained from the Superintendent of Documents, U.S. Government Printing Office (GPO), Washington, DC 20402-9371; telephone: (202) 512-1800. Contact GPO for current prices. **Questions or messages regarding errors in formatting should be addressed to mmwrq@cdc.gov.Date last reviewed: 1/22/2007 |
|||||||||
|