|
|
|
|
|
|
|
| ||||||||||
|
|
|
|
|
|
|
||||
| ||||||||||
|
|
|
|
|
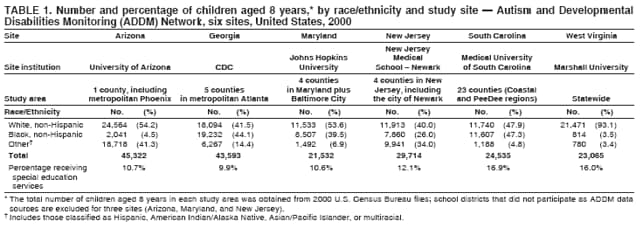
Persons using assistive technology might not be able to fully access information in this file. For assistance, please send e-mail to: mmwrq@cdc.gov. Type 508 Accommodation and the title of the report in the subject line of e-mail. Prevalence of Autism Spectrum Disorders --- Autism and Developmental Disabilities Monitoring Network, Six Sites, United States, 2000Autism and Developmental Disabilities Monitoring Network Surveillance Year 2000 Principal Investigators
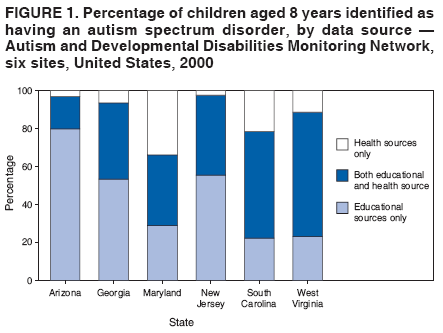
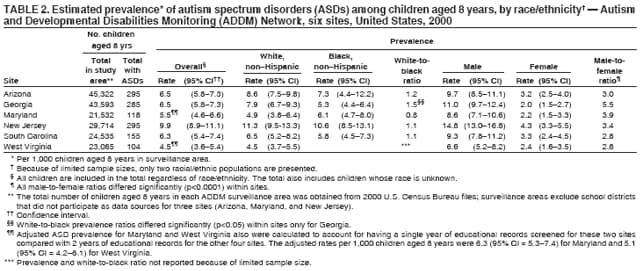
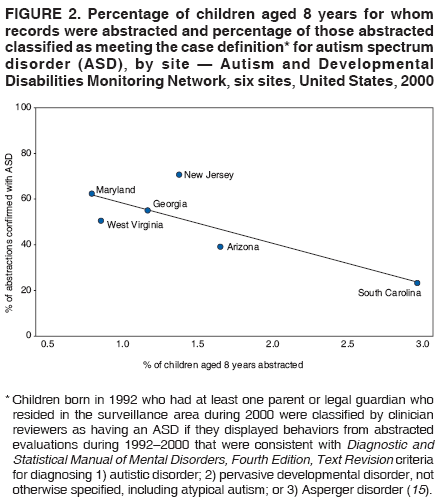
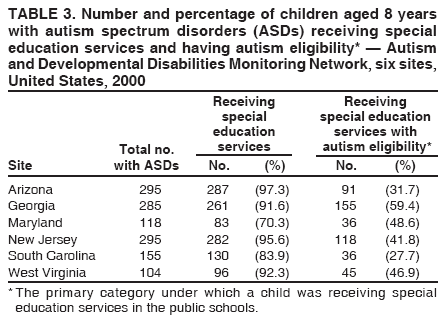
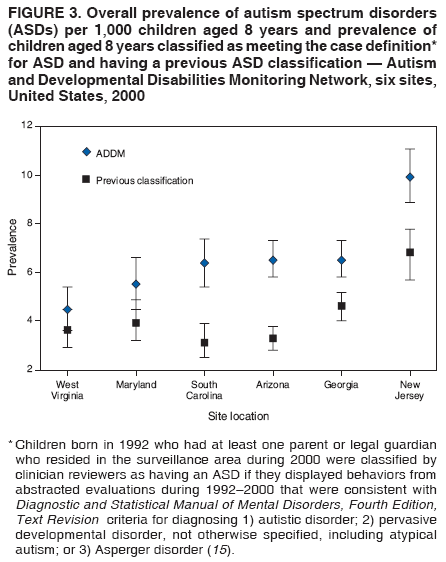
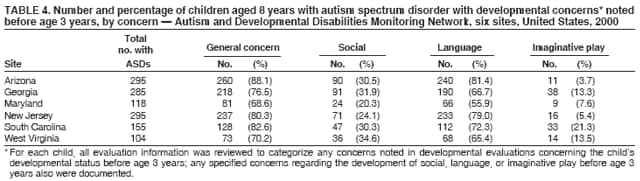
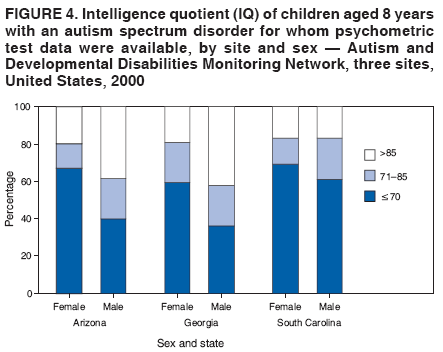
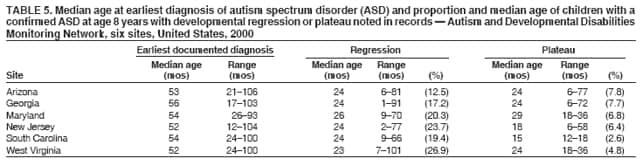
Corresponding author: Catherine Rice, PhD, Division of Birth Defects and Developmental Disabilities, National Center on Birth Defects and Developmental Disabilities, CDC, 1600 Clifton Road, N.E., MS E-86, Atlanta, GA 30333. Telephone: 404-498-3860; Fax: 404-498-3550; E-mail: crice@cdc.gov. AbstractProblem/Condition: Data from a population-based, multisite surveillance network were used to determine the prevalence of children aged 8 years with autism spectrum disorder (ASD) in six areas of the United States and to describe the characteristics of these children. Reporting Period: 2000. Methods: Children aged 8 years were identified as having an ASD through screening and abstraction of evaluation records at multiple sources, with clinician review of abstracted records to determine case status. Children whose parent(s) or legal guardian(s) resided in one of the six surveillance areas during 2000 and whose records documented behaviors consistent with the American Psychiatric Association's criteria for diagnosing 1) autistic disorder, 2) pervasive developmental disorder-not otherwise specified, or 3) Asperger disorder were classified as having an ASD. Results: For 2000, across six sites, a total of 1,252 children aged 8 years were identified as having an ASD. The overall prevalence of ASDs per 1,000 children aged 8 years ranged from 4.5 in West Virginia to 9.9 in New Jersey. With the exception of one surveillance site (Georgia), no statistically significant (p<0.05) differences were identified in the rate of ASDs between non-Hispanic black and non-Hispanic white children. The ratio of male-to-female prevalence varied (range: 2.8:1.0--5.5:1.0). The majority of children with ASDs received special education services and had a documented history of concerns regarding their development before age 3 years. The prevalence of children with a previously documented ASD classification varied across sites, but the median age of earliest documented ASD diagnosis was similar across sites (age 52--56 months). For three sites with sufficient data on intelligence quotient (IQ), cognitive impairment (i.e., IQ of <70) was reported for 40%--62% of children whose conditions were consistent with the case definition for ASD. Interpretation: Findings from this first U.S. multisite collaborative study to monitor ASD prevalence demonstrated consistency across the majority of sites, with prevalence statistically significantly (p<0.001) higher in New Jersey. Average ASD prevalence across all six sites was 6.7 per 1,000 children aged 8 years. These results indicate that ASDs are more common than was believed previously. Public Health Actions: Collecting data regarding prevalence of ASDs by associated characteristics (e.g., cognitive impairment, age of first documented concerns, and history of ASD diagnosis), race/ethnicity, and sex will provide important baseline standards that can be compared with follow-up surveillance data to track changes in ASD prevalence. Knowledge of these characteristics has implications for identification and intervention strategies and for medical and educational service planning for children with ASDs. IntroductionPersons with an autism spectrum disorder (ASD)* have impairments in social, communicative, and behavior development that typically are present before age 3 years and that often are accompanied by abnormalities in cognitive functioning, learning, attention, and sensory processing (1). Autism was thought previously to be rare, but during the 1990s, the number of persons reported to be receiving services for ASDs increased substantially (1--7). This increase has elevated public concern regarding prevalence of conditions in the autism spectrum and underscores the need for systematic public health monitoring. The complex nature of these behaviorally defined disorders, together with the current lack of genetic or biologic markers for early and consistent identification, make epidemiologic investigation challenging (8--10). Population-based studies conducted worldwide before 1985 indicated that prevalence of autism and related conditions was 0.4--0.5 per 1,000 children aged <18 years (11--14). The most recent studies using current Diagnostic and Statistical Manual of Mental Disorders, Fourth Edition, Text Revision (DSM-IV-TR) (15) and International Classification of Diseases, Tenth Revision (ICD-10) (16) criteria have identified ASD rates ranging from 2.0 to 12.0 per 1,000 children (1,4,17--23), with "best-estimate" rates of 2.0--6.0 per 1,000 children (14,24--26). Recent findings reflect the expansion of the definition of autism to encompass a spectrum of disorders that might include co-occurring mental retardation (MR) or cognitive impairment, and the findings have challenged previously accepted ideas concerning the population characteristics of persons with ASDs. For example, certain studies have identified male-to-female ratios twice the four-to-one male-to-female ratio often identified in older studies (22) and much lower rates of co-occurring MR (approximately 25%--50% rather than the typically cited 70%) (21,26). Studies of ASD prevalence in the United States during the 1990s have identified rates of 2.0--7.0 per 1,000 children (1--3, 5,7,18,27--29), a greater-than-tenfold increase from rates of 0.1--0.4 per 1,000 children identified during the 1980s (30--32). Certain studies have used data from single-service provision systems (e.g., numbers of children classified as having autism for special education or public health disability services) (2,3,5,7,27,29). Tracking the number of persons identified for services is important to measure the intervention needs and costs of care for persons with an identified ASD. However, because the number of persons identified for services is dependant on multiple factors (e.g., changing eligibility criteria, increased awareness, and changes in service availability), aggregate data might underestimate prevalence and should be used with caution in examining population-based trends (7,8,29,33). CDC-conducted surveys of parent reports of diagnosed autism in their children (34) indicated that 5.5--5.7 per 1,000 children aged 4--17 years received a diagnosis of autism during 2003--2004, corroborating recent best estimates of approximately six ASD cases per 1,000 children (14,24--26). In addition, CDC funds projects that track the number of children with ASDs, conducts studies to identify what factors might lead to a child having an ASD, and offers education and outreach materials for the early identification of autism and other developmental disabilities. Information regarding these projects is available at http://www.cdc.gov/autism. To improve understanding of prevalence, population characteristics, and the public health impact of these conditions, CDC also has conducted population-based surveillance projects, including a community-based investigation in Brick Township, New Jersey (18) and ongoing surveillance in the greater Atlanta metropolitan area (1,35,36). In 2000, CDC organized the Autism and Developmental Disabilities Monitoring (ADDM) Network, a multisite, multiple-source, records-based surveillance program to collect data for determining prevalence of ASDs and other developmental disabilities (9). The ADDM Network, as with CDC's Atlanta population-based surveillance program, employs systematic screening of developmental evaluation records for behaviors associated with autism rather than depending on a previously documented diagnosis or classification of autism or a related disorder to identify children with ASDs (1,9). Because this methodology collects data from multiple health and service provision sources rather than from a single source, these data can be used to estimate a closer approximation of true population prevalence than would a single source of special education or clinical administrative data alone. CDC reports published previously regarding population-based prevalence of ASDs in two U.S. communities documented prevalences of 3.4 and 6.7 per 1,000 children aged 3--10 years (1,18). In the larger of these population studies conducted in Atlanta, the highest prevalence of ASDs was for children aged 8 years, which is consistent with observations of peak ASD prevalence among elementary-school--aged children (26). Therefore, to determine peak prevalence and evaluate trends, the ADDM Network uses an index age of 8 years. Specified procedures for case identification and reliability among clinician reviewers who verify case status provide confidence in this methodology (9). This report presents findings for 2000 from the first six ADDM Network sites in the United States and establishes a baseline period prevalence for ASDs by race/ethnicity, sex, and multiple associated characteristics. Data from the ADDM Network will provide information regarding the clinical features of children with ASDs in select U.S. populations and make possible a comprehensive understanding of trends in rates of ASDs. Knowledge of these characteristics has implications for identification and intervention strategies and for medical and educational service planning for children with ASDs. MethodsStudy Sites and Population CharacteristicsCDC and academic researchers at five universities (Table 1) working on behalf of their state health departments collaborated in identifying the occurrence of ASDs during 2000 in selected areas of Arizona (one county, including metropolitan Phoenix), Georgia (five counties in metropolitan Atlanta), Maryland (four counties and Baltimore), New Jersey (four counties, including metropolitan Newark), South Carolina (23 counties in the Coastal and PeeDee regions), and West Virginia (statewide) (Table 1). The number of children aged 8 years residing in each site during 2000 ranged from 21,532 in Maryland to 45,322 in Arizona. The proportion of non-Hispanic white children was similar across the majority of sites (range: 40% [New Jersey]--54% [Arizona and Maryland]), with the exception of West Virginia, for which distribution was 93% (37). Greater variation was reported across sites in the distribution of non-Hispanic black children (range: 4% [West Virginia]--47% [South Carolina]). Breakdowns by sex were similar across sites, with roughly equal distribution of male and female children. Sites were chosen by CDC through a competitive objective review process on the basis of their ability to conduct ASD surveillance; sites were not selected to reflect a nationally representative sample. Each site satisfied local Institutional Review Board and other privacy and confidentiality requirements. Surveillance Methods and Case DefinitionThe ADDM methodology was adapted from that used by CDC's Metropolitan Atlanta Developmental Disabilities Surveillance Program (MADDSP), an ongoing active population-based surveillance program that monitors the occurrence of developmental disabilities among children aged 8 years in the metropolitan Atlanta area (1,9,18,35,36). The ADDM Network implemented the basic MADDSP methodology using common data abstraction, case definition, clinician review, and quality assurance procedures (9). Records of children born in 1992 who had at least one parent or legal guardian who resided in the surveillance area during 2000 were reviewed. Children were classified by clinician reviewers as having an ASD if they displayed behaviors from abstracted evaluations during 1992--2000 that were consistent with DSM-IV-TR criteria for diagnosing 1) autistic disorder; 2) pervasive developmental disorder, not otherwise specified (PDD-NOS), including atypical autism; or 3) Asperger disorder (15). Because the number and quality of ASD criteria specified by DSM-IV-TR are less stringent for diagnosis of PDD-NOS or Asperger disorder than for autistic disorder, an additional stricter requirement was added. A condition was classified as being consistent with an ASD case status if the criteria for PDD-NOS or Asperger were present to the extent that at least one of the autism-specific behaviors was of a sufficient quality or intensity to be highly indicative of an ASD. For example, in the case definition, the DSM-IV-TR social criterion of "limited social or emotional reciprocity" was defined as requiring a specific impairment (e.g., "rarely responds verbally or nonverbally to a social approach from others in a familiar setting"). The stricter requirement for PDD-NOS or Asperger disorder was used because case status was determined solely on the basis of information contained in evaluation records. The case definition focused on identifying the overall presence of an ASD rather than on attempting to identify specific subtypes of ASDs. Case determination was completed in two phases: case ascertainment and clinician review. Case Ascertainment Children suspected of having an ASD who satisfied the age, surveillance year, and residency requirements were identified through screening source files (1,9) at multiple settings, including education sources (i.e., public schools†) and health sources (e.g., state health facilities, hospitals, clinics, diagnostic centers, and other clinical providers for children with developmental disabilities, particularly ASDs) for documented or suspected ASD classifications and for descriptions of behaviors associated with ASD diagnostic criteria. At educational sources, the evaluation records of children receiving special education services during either the 1999--2000 or the 2000--2001 school year were reviewed. Two sites (West Virginia during 1999--2000 and Maryland during 2000--2001) screened records from a single school year, and four sites (Arizona, Georgia, New Jersey, and South Carolina) screened records from both school years to identify additional cases. Demographic and exceptionality category for special education services, verbatim descriptions of behaviors associated with autism from evaluations, psychometric test results, developmental history, and evaluation summaries were abstracted from evaluation records for each child identified as possibly having an ASD. Screening and abstraction of information in evaluation records was conducted by abstractor staff who met initial and ongoing reliability standards (9). If information regarding a child was available from multiple sources, data were combined into a composite record. Each child was assigned a study classification number, and all information abstracted was protected by multiple confidentiality procedures. Clinician Review All abstracted evaluations from the case ascertainment phase were reviewed and scored by an ASD clinician reviewer (i.e., a qualified diagnostician with an advanced degree and/or certification in the assessment and diagnosis of children with developmental disabilities, especially ASDs). The clinician reviewer used a coding guide developed on the basis of DSM-IV-TR criteria (15) to determine if the child's condition was consistent with the ASD case definition. Any statement of an overall developmental concern or a delay in social skills, language, or symbolic play at age <3 years was scored, as were any indications of behavior regression or a plateau in skill development. Descriptions of associated features (e.g., odd responses to sensory stimuli) also were coded. A child was defined as having a previously documented case of an ASD if any evaluation contained a diagnosis of an ASD from a professional examiner qualified by education and training to evaluate the developmental status of children. Interrater reliability was established among ASD clinician reviewers to standards of 80%--85% agreement for individually scored items and 90% for agreement on overall case status. For ongoing interrater reliability checks, a random sample of records (10%) was scored independently by a second reviewer with acceptable (81%--100%) percentage agreements on final case definition. Analytic MethodsFor each child, race and ethnicity were determined from information contained in the source records or, if missing, from birth certificates. Period prevalence estimates were calculated using the denominator of the number of children aged 8 years in the surveillance area during 2000 according to U.S. Census Bureau estimates. Three sites (in Arizona, Maryland, and New Jersey) excluded nonparticipating school districts located in the study area from their population denominator, and cases identified from health sources in these districts were excluded from the numerator. Poisson approximation to the binomial distribution was used to calculate 95% confidence intervals (CIs) for prevalence rates (38). Prevalence results are reported per 1,000 children. Race-specific rates used the categories non-Hispanic white, non-Hispanic black, and other (which included persons who were Hispanic, Asian/Pacific Islander, and American Indian/Alaska Native). Chi-square analyses were used, and a p value of <0.05 was used for all tests of statistical significance. To assess whether screening special-education files from a second school year might improve detection, two sites (Maryland and West Virginia) linked electronic records from the school year that were screened to an additional list of children receiving special education. This procedure was based on the assumption that the probability of identifying a child with a confirmed case of ASD from the school records screened would apply to those children who were identified through a second screening of education files. At each site, certain school and clinical records could not be located for screening, and the potential impact of these missing records on case ascertainment was assessed. For children who did have records to screen, a percentage case yield was calculated by the type of data source (i.e., education only, health only, or both education and health) and the presence of an ASD classification code (i.e., a diagnostic or special education eligibility code for ASD). To estimate the impact of missing records on final prevalence estimates, the percentage of case yield from the records identified was applied to the children for whom all or partial records were missing. ResultsCase AscertainmentAcross sites, the percentage of children with an ASD identified exclusively at educational sources ranged from 22% to 80%, and the percentage identified only at health sources ranged from 2% to 34%. Those identified at both educational and health sources ranged from 17% to 65% (Figure 1). The median number of evaluations abstracted for each child differed across sites, ranging from two (Georgia and Maryland) to eight (New Jersey) for those with an ASD and from one (Georgia, Maryland, and West Virginia) to five (New Jersey) for those without an ASD. The proportion of reviewed records abstracted to the population of children aged 8 years in each surveillance area ranged from 0.8% to 2.9%. With the exception of two sites (New Jersey and West Virginia), a strong inverse correlation was observed between the percentage of the total number of children abstracted and those classified as having an ASD (Figure 2). In New Jersey, the final case count was higher than expected on the basis of the population abstracted, whereas the reverse was true for West Virginia. Analyses were conducted for Maryland and West Virginia to evaluate possible missed cases attributable to screening a single year of special education data; the results of these analyses indicated that an estimated 17 cases would have been added for Maryland and an estimated 14 for West Virginia as a result of screening a second year of data. The estimated impact on prevalence of the files that could not be located for initial screening (i.e., the percentage of missed cases) varied (range: 3.4% [Georgia]--16.7% [Maryland]). Prevalence Estimates and DemographicsAcross the six sites, the prevalence of ASDs ranged from 4.5 to 9.9 per 1,000 children aged 8 years (Table 2, Figure 3). Three sites had similar overall prevalence estimates: 6.3 per 1,000 population in South Carolina and 6.5 per 1,000 in Arizona and Georgia. The Maryland estimate (5.5 per 1,000 population) did not differ significantly from each of these three midrange estimates (p = 0.223, 0.112, and 0.105, respectively), whereas the West Virginia estimate (4.5 per 1,000 population) was significantly lower (p = 0.001, 0.006, and 0.001, respectively). However, when the impact of screening only 1 year of special education records for Maryland and West Virginia was taken into account, prevalence estimates for these sites increased to an estimated 6.3 per 1,000 population (CI = 5.3--7.4) for Maryland and 5.1 (CI = 4.2--6.1) for West Virginia. Estimated prevalence for New Jersey (9.9 per 1,000 population) was significantly higher (p<0.001) than those for all other sites. Across sites, prevalence estimates exhibited heterogeneity by race/ethnicity. Within-site comparisons demonstrated a significant difference in ASD prevalence between non-Hispanic white and non-Hispanic black children only in Georgia, and only among males. Sex-specific ASD prevalence ranged from 6.6 to 14.8 for males and from 2.0 to 4.3 for females. The lowest male-to-female ratio was 2.8:1.0 (South Carolina and West Virginia); the highest was 5.5:1.0 (Georgia) (Table 2). Prevalence was based on period prevalence estimates of ASDs for children aged 8 years who resided in their respective surveillance areas during 2000. The proportion of children with ASDs who also were born in the surveillance areas was 67% in Arizona, 54% in Georgia, 77% in Maryland, 84% in New Jersey, 66% in South Carolina, and 81% in West Virginia. Special Education EligibilityThe estimated proportion of children aged 8 years with ASDs receiving special education services through public schools ranged from 70.3% in Maryland to 97.3% in Arizona (Table 3). Across sites, the proportion of children with ASDs receiving special education services with an autism eligibility classification ranged from 27% in South Carolina to 59% in Georgia. Previously Documented Classification of ASDsChildren with a previously documented ASD classification included children who received special education services under an autism special education eligibility and those documented in the source records as having an ASD diagnosis. Prevalence estimates per 1,000 population derived for children with an ASD with a previous ASD classification were 3.1 in Arizona and South Carolina, 3.6 in West Virginia, 3.9 in Maryland, 4.6 in Georgia, and 6.8 in New Jersey. For all sites, ASD prevalence calculated on the basis of a child having received a previous classification of ASD was significantly (p<0.05) lower than prevalence estimated using the ADDM Network methodology, with the exception of West Virginia (Figure 3). Developmental CharacteristicsCognitive functioning as indicated by IQ findings is reported for the three sites in which >85% of children had psychometric test results: Arizona with 90%, Georgia with 94%, and South Carolina with 89%. Of the children with ASDs who had a cognitive or developmental IQ test result, the proportion of children with cognitive impairment (IQ of <70) was 46% (N = 123) in Arizona, 40% (N = 107) in Georgia, and 62% (N = 86) in South Carolina. The distribution of cognitive functioning in females was similar across sites. The proportion of males with cognitive impairment ranged from 36% in Georgia to 61% in South Carolina, and the proportion of males with average or above-average cognitive functioning (i.e., IQ of >85) ranged from 17% in South Carolina to 39% in Arizona (Figure 4). The majority (69%--88%) of children with ASDs had documented developmental concerns before age 3 years. Across all sites, the most commonly documented early developmental concern was for language, followed by social concerns. Documented developmental concerns with imaginative play were least common across all sites (Table 4). The median age of earliest reported ASD diagnosis identified in the child's record was similar (range: 52--56 months) across sites (Table 5). The percentage of children with indications of regression (loss of previously acquired skills in social, communication, play, or motor areas) and plateau (lack of continued development without clear evidence of regression) in records ranged from 13% to 27% and 3% to 8%, respectively, across sites (Table 5). The median age of regression ranged from 23 to 26 months. DiscussionBecause ASDs are diagnosed on the basis of behavioral criteria, and clinicians might apply criteria differently to arrive at a diagnosis of autism and related subtypes, determining prevalence is challenging (1,8,9). The ADDM Network surveillance approach involved collecting detailed behavior data from multiple data sources regarding a substantial number of children with indications of a potential ASD. This methodology minimized reliance on a child's previously documented diagnoses or special education eligibility category to classify a child as having an ASD. Applying the ADDM Network approach in six areas of the United States generated ASD prevalence estimates for children aged 8 years ranging from 4.5 to 9.9 per 1,000 children aged 8 years. The estimate for West Virginia (4.5 per 1,000 children aged 8 years) was significantly lower, and the estimate for New Jersey (9.9 per 1,000 children aged 8 years) was significantly higher, than the mid-range estimates. The average prevalence of 6.7 per 1,000 children aged 8 years identified in this report is consistent with the upper end of prevalence (5.8--6.7 per 1,000 children) from epidemiologic studies using active population screening and clinical case confirmation within the preceding 10 years (18--21). However, the significantly higher prevalence from New Jersey also was in line with a few studies indicating higher ASD rates (11.6 and 12.1 per 1,000 children aged 7--10 years) (22,39). The higher rate of ASDs in children aged 8 years in New Jersey indicates the importance of continuing to evaluate community variation and trends in prevalence in the United States. ASD prevalence among children aged 8 years varied from 6.6 to 14.8 per 1,000 boys and from 2.0 to 4.3 per 1,000 girls. The male-to-female ratio (2.8:1.0--5.5:1.0) is consistent with previous literature indicating an average male-to-female ratio of 4.3:1.0 (26). Although a limited number of studies have reported race-specific ASD prevalence, the available data are inconsistent. Administrative data from California suggest a slightly higher prevalence in black than in white children (40), but a previous report from Georgia indicated a similar prevalence for black and white children (1). An analysis of claims data from Pennsylvania Medicaid recipients receiving services for autistic disorder demonstrated that being white was associated with receiving a first diagnosis at an earlier age (41), which might affect age-specific prevalence estimates and reflect access to diagnostic services. In this report, the confidence intervals for race-specific prevalence estimates overlapped considerably, with the exception of Georgia. The proportion of children with ASDs who had cognitive impairment (IQ <70) ranged from 40% to 62% in the three sites for which IQ data were available. Children with ASDs in South Carolina, particularly males, were more likely to be classified with cooccurring cognitive impairment compared with children with ASDs in Arizona and Georgia. Females showed a similar distribution in level of cognitive impairment across these three sites, with the majority of females with ASDs also having cooccurring cognitive impairment. These proportions are below the 75% of children having cognitive impairment typically reported in earlier epidemiologic in which cases were identified solely on the basis of autistic disorder (26) but above estimates from studies conducted during the 1990s using active screening to identify all ASD cases (20,22). If these data are accurate, additional high-functioning children with ASDs might remain unidentified. Children with a very mild ASD might not be counted because inclusion in this system required that the child was evaluated for special educational or health-care needs. Variation exists in the proportion of children in the population identified for special education across study areas (Table 1); however, a clear pattern does not exist in which sites that identified more children for special education in the base population ultimately had a higher or lower prevalence of ASD. Early identification and participation in intervention can improve the long term outcome for children with an ASD (42). The majority of children identified in these six sites received diagnostic evaluations that noted developmental concerns before age 3 years, primarily in the development of language skills; 11%--27% lost developmental skills at a young age (median age: 23--26 months); and 3%--8% demonstrated a plateau in development that was substantial enough to be reported in a developmental evaluation. The median age of the first documented ASD diagnosis was age 52--56 months. CDC has been working with caregiver and professional groups to improve the recognition of developmental concerns and to improve referral for further evaluation and intervention with the "Learn the Signs. Act Early." public awareness campaign (43). As noted previously (1), the ability to access information from sources outside clinical sources typically utilized for public health surveillance sources is critical to the success of a records-based ASD monitoring effort. For example, a substantial proportion (range: 22%--80%, depending on site) of the children with a reported ASD would not have been identified without educational data. In addition, a proportion of those identified from a combination of educational and health data (range: 17%--65%, depending on site) also would have been missed if the information from educational sources had been unavailable. The added benefit of educational records in the monitoring system is derived primarily from the detailed behavior data in the evaluations contained in school records rather than the single label provided by a special education classification. As previous studies have indicated, reliance on special education classification alone to estimate population autism prevalence is problematic (7,30,33). In five of the six ADDM Network sites, less than half (as low as 27%) of the children with a confirmed ASD were served under an autism special education classification. Prevalence estimates derived from using a documented previous ASD classification as the numerator ranged from 20% in West Virginia to 52% in South Carolina, lower than the estimates derived by using the ADDM Network monitoring approach (Figure 3). One strength of the ADDM Network is its consistency of data collection and case determination across sites. The surveillance methodology uses standardized abstractor and clinician reviewer training, ongoing quality assurance monitoring, and similar standards to identify and confirm potential cases and to analyze data (9,44). Although the proportion of reviewed records abstracted in each surveillance area ranged from 0.8% to 2.9%, sites with a higher percentage of abstracted records actually had lower percentages of confirmed cases. This suggests that the standardized methods used for clinical review resulted in consistent application of the case definition across sites (Figure 2). Although the intent of the ADDM Network sites was to use comparable methods, multiple sources of variability might be responsible for differences in prevalence across study sites. These include variation in state standards for evaluation and classification of children with ASDs, exclusion of certain sources (e.g., private schools), use of special education child count data from one rather than two school years, and inability to locate source files. Sites also varied in the percentage of records abstracted and in the quantity and quality of information available in some of the abstracted files. Because the ADDM methodology is records-based, the number and content of the records abstracted at any site could influence prevalence estimation. All ADDM sites included public schools and the major developmental disabilities evaluation and treatment centers serving their surveillance areas as sources of records. The effect of excluding private schools, charter schools, and smaller clinical providers on prevalence estimates is difficult to quantify but might have contributed to underestimation of prevalence, except for New Jersey, whose school system maintains records and evaluations for children receiving special education who attend nonpublic schools. Behavior descriptions contained in educational and health records might have overstated or understated autism symptoms; in addition, the information available probably was not complete enough to allow reviewers to determine whether a possible case was consistent with ASD criteria. A limitation of using a records-based approach is that the amount and quality of information available varied across sites. Two sites (Maryland and West Virginia) screened special education files from one rather than two school years, which appears to account, in part, for the lower prevalence rates from these sites. After the impact of screening 1 year rather than 2 years of special education data was taken into account, prevalence estimates from Maryland and West Virginia (6.3 and 5.1 per 1,000 children aged 8 years, respectively) were similar to the majority of the other sites. One factor that affected all sites was the number of files not located at data sources during the case-ascertainment phase. Sensitivity analyses conducted by all sites to determine the effect of files that were not located indicated a possible prevalence underestimation of 3.4% to 16.7%, with the greatest impact in Maryland. Among children whose case status was consistent with the ASD case definition, the median number of evaluations identified and abstracted for each child from birth to age 8 years ranged from two each in Georgia and Maryland to eight in New Jersey. Among children without ASDs, the median number of evaluations abstracted for each child ranged from one each in Georgia and Maryland to five in New Jersey. A qualitative review of each site's records indicates that in addition to New Jersey having the greatest number of evaluations per child, New Jersey evaluation records also contained more detailed information. In certain cases, the availability of information in records might have been affected by state law or by local school regulations. For example, New Jersey frequently employed multidisciplinary evaluations to confirm eligibility for special education, which might have resulted in more evaluations per child compared with sites for which a single evaluation was used to determine eligibility. Also, the substantial difference in the presence of cognitive functioning data on cases is a byproduct primarily of state policy regarding cognitive testing (e.g., in Arizona, Georgia, and South Carolina, all children with an autism exceptionality are required to have an IQ test, whereas no such requirement exists in New Jersey, Maryland, and West Virginia). Another factor possibly contributing to variation in estimates is differential in- and out-migration in these six areas because prevalence estimates in this report are period prevalence estimated on the basis of residency in the study area during 2000. Although the reasons why families might have moved in or out of the study area could not be determined, the proportion of children with ASDs who were born in the study areas ranged from 54% in Georgia to 84% in New Jersey, indicating a potential for differential migration patterns in the sites. However, the high proportion of children with ASDs that were born in the New Jersey surveillance area compared with the other sites indicates that differential in-migration might not be a substantial contributor to New Jersey's higher prevalence of ASDs. Etiologic differences also might contribute to across-site variation in prevalence. Conclusions about specific etiologic factors cannot be drawn from prevalence data alone and will need to be addressed through future studies. For example, following concern about high prevalence of ASD in Brick Township, New Jersey (18), an investigation was conducted to assess specific environmental exposures in that township, and no specific associations were identified between hazard exposure from the municipal drinking water supply, town river, or landfill and ASD cases (45). In addition to better understanding of consistency and variance in ASD prevalence in different U.S. communities, specific studies are needed to investigate the complex genetic and environmental interactions likely at play in the development of heterogeneous conditions such as ASDs. The initial findings presented in this report are derived from data collected by the first comprehensive U.S. monitoring network devoted to ASDs. Prevalence of ASDs in five of the six sites was consistent with the upper end of recent community and survey-based epidemiologic study estimates (1,17,18,20,21,34,46), and one site demonstrated a significantly higher (p<0.001) prevalence similar to two non-U.S. studies (22,39). These findings indicate that ASDs are more common than were once believed and are conditions of urgent public health concern. Since its inception, the ADDM Network has expanded to include additional sites that will continue to provide baseline ASD prevalence data and descriptive information regarding the ASD population in the United States. Ongoing surveillance to monitor trends in ASD prevalence and studies that include clinical validation of cases and noncases will be particularly useful for furthering the understanding of the prevalence of ASDs and of the characteristics of persons with ASDs. Acknowledgments Information in this report was provided by ADDM Surveillance Year 2000 Principal Investigators: Catherine Rice, PhD, Jon Baio, EdS, Kim Van Naarden Braun, PhD, Nancy Doernberg, Division of Birth Defects and Developmental Disabilities, National Center on Birth Defects and Developmental Disabilities, CDC; Sydney Pettygrove, PhD, Chris Cunniff, MD, F. John Meaney, PhD, University of Arizona, Tucson, Arizona; Craig Newschaffer, PhD, Johns Hopkins University, Baltimore, Maryland; Walter Zahorodny, PhD, Franklin Desposito, MD, New Jersey Medical School, Newark, New Jersey; Jane Charles, MD, Medical University of South Carolina, Charleston, South Carolina; Barbara Becker-Cottrill, EdD, Marshall University, Huntington, West Virginia. Contributions to the preparation of this manuscript were provided by Michael Brimacombe, PhD, New Jersey Medical School, Newark, New Jersey; Laura Arnstein Carpenter, PhD, Lydia King, PhD, Medical University of South Carolina, Charleston, South Carolina. Data collection was coordinated at each site by ADDM Network project coordinators: Jennifer Ottolino, University of Arizona, Tucson, Arizona; Maria Kolotos, Johns Hopkins University, Baltimore, Maryland; Susie Kim, New Jersey Medical School, Newark, New Jersey; Lydia King, PhD, Medical University of South Carolina, Charleston, South Carolina; Julie O'Malley, Marshall University, Huntington, West Virginia; Anita Washington, MPH, Battelle Memorial Institute, Atlanta, Georgia; Sally Brocksen, PhD, Oakridge Research Institute on Science and Education (ORISE) Fellow, Division of Birth Defects and Developmental Disabilities, National Center on Birth Defects and Developmental Disabilities, CDC. Additional assistance was provided by project staff, including data abstractors, epidemiologists, data management/programming support. Technical support was provided by Jian-Ping He, MD, Mohammad Hossein Rahbar, PhD, Data Coordinating Center, Michigan State University, East Lansing, Michigan. Ongoing project management support was provided by Joanne Wojcik and Marshalyn Yeargin-Allsopp, MD, CDC. Technical advice on the project and comments on the report were provided by Diana Schendel, PhD, Laura Schieve, PhD, Division of Birth Defects and Developmental Disabilities, National Center on Birth Defects and Developmental Disabilities, CDC. References
* In this report, ASD is used to refer to autistic disorder; pervasive developmental disorder, not otherwise specified (PDD-NOS); and Asperger disorder. The terms ASD and autism are used interchangeably. † Educational sources consisted of public education systems in each surveillance area. Data were not obtained from private schools unless they were affiliated with one of the health sources or documentation was kept by the private schools. Table 1
Disclaimer All MMWR HTML versions of articles are electronic conversions from ASCII text into HTML. This conversion may have resulted in character translation or format errors in the HTML version. Users should not rely on this HTML document, but are referred to the electronic PDF version and/or the original MMWR paper copy for the official text, figures, and tables. An original paper copy of this issue can be obtained from the Superintendent of Documents, U.S. Government Printing Office (GPO), Washington, DC 20402-9371; telephone: (202) 512-1800. Contact GPO for current prices. **Questions or messages regarding errors in formatting should be addressed to mmwrq@cdc.gov.Date last reviewed: 1/22/2007 |
|||||||||
|