 |
|
|
|
|
|
|
| ||||||||||
|
|
|
|
|
|
|
||||
| ||||||||||
|
|
|
|
|
Persons using assistive technology might not be able to fully access information in this file. For assistance, please send e-mail to: mmwrq@cdc.gov. Type 508 Accommodation and the title of the report in the subject line of e-mail. Health-Related Quality of Life Surveillance --- United States, 1993--2002Hatice S. Zahran, MD The material in this report originated in the National Center for Chronic Disease Prevention and Health Promotion, Janet Collins, PhD, Director, and the Division of Adult and Community Health, Wayne H. Giles, MD, Acting Director. Corresponding author: David G. Moriarty, Division of Adult and Community Health, National Center for Chronic Disease Prevention and Health Promotion, 4770 Buford Highway, NE, Atlanta, GA 30334, MS K-51; Telephone: 770-488-5455; Fax: 770-488-5964; E-mail: dgm1@cdc.gov. Abstract Problem/Condition: Population-based surveillance of health-related quality of life (HRQOL) is needed to promote the health and quality of life of U.S. residents and to monitor progress in achieving the two overall Healthy People 2010 goals: 1) increase the quality and years of healthy life and 2) eliminate health disparities. Reporting Period: This report examines surveillance-based HRQOL data from 1993 through 2002. Description of System: Survey data from a validated set of HRQOL measures (CDC HRQOL-4) were analyzed for 1993--2001 from the Behavioral Risk Factor Surveillance System (BRFSS) surveys for the 50 states and the District of Columbia (DC) and for 2001--2002 from the National Health and Nutrition Examination Survey (NHANES). These measures assessed self-rated health; physically unhealthy days (i.e., the number of days during the preceding 30 days for which physical health, including physical illness and injury, was not good); mentally unhealthy days (i.e., the number of days during the preceding 30 days for which mental health, including stress, depression, and problems with emotions, was not good); and days with activity limitation (i.e., number of days during the preceding 30 days that poor physical or mental health prevented normal daily activities). A summary measure of overall unhealthy days also was computed from the sum of a respondent's physically unhealthy and mentally unhealthy days, with a maximum of 30 days. Results and Interpretation: During 1993--2001, the mean number of physically unhealthy days, mentally unhealthy days, overall unhealthy days, and activity limitation days was higher after 1997 than before 1997. During 1993--1997, the percentage of respondents with zero overall unhealthy days was stable (51%--53%) but declined to 48% by 2001. The percentage of respondents with >14 overall unhealthy days increased from 15%--16% during 1993--1997 to 18% by 2001. Adults increasingly rated their health as fair or poor and decreasingly rated it as excellent or very good. Women, American Indians/Alaska Natives, persons of "other races," separated or divorced persons, unmarried couples, unemployed persons, those unable to work, those with a <$15,000 annual household income, and those with less than a high school education reported worse HRQOL (i.e., physically unhealthy days, mentally unhealthy days, overall unhealthy days, and activity limitation days). Older adults reported more physically unhealthy days and activity limitation days, whereas younger adults reported more mentally unhealthy days. A seasonal pattern was observed in physically unhealthy days and overall unhealthy days. During 1993--2001, BRFSS respondents in 13 states reported increasing physically unhealthy days; respondents in 13 states and DC reported increasing mentally unhealthy days; respondents in Alabama, Connecticut, Maine, New Jersey, New Mexico, North Carolina, and Oregon reported both increasing physically and mentally unhealthy days; and respondents in 16 states and DC reported increasing activity limitation days. During 2001--2002, NHANES respondents with one or more medical conditions (e.g., arthritis or stroke) reported worse HRQOL than those without such conditions, and those with an increasing number of medical conditions reported increasingly worse HRQOL. Public Health Action: Policy makers and researchers should continue to monitor HRQOL and its correlates in the U.S. population. In addition, public health professionals should expand monitoring to populations currently missed by existing surveys, including institutionalized and homeless persons, adolescents, and children. A key aspect is to study and identify the personal and community determinants of HRQOL in prevention research and population studies, to understand how to improve HRQOL, and to reduce HRQOL disparities. In addition, population health assessment professionals should continue to refine and validate HRQOL, functional status, and self-reported health measures. IntroductionPopulation-based surveillance of physical and mental health is an important component of tracking population trends, identifying health disparities, and monitoring progress in achieving the two overall national health goals for Healthy People 2010: 1) increase the quality and years of healthy life and 2) eliminate health disparities (1). CDC developed a set of standard health-related quality of life (HRQOL) measures (CDC HRQOL-4) used in Behavioral Risk Factor Surveillance System (BRFSS) surveys since 1993 and, since 2000, in the National Health and Nutrition Examination Survey (NHANES) to track the HRQOL of adults (2,3). For this surveillance report, HRQOL was defined as perceived physical and mental health over time (2). The CDC HRQOL-4 measures (also known as the Healthy Days measures) have demonstrated reliability and validity for population health surveillance (4--6). The measures predict morbidity, health-care use, and mortality, and are associated with chronic diseases, disability, risky health behaviors, and sociodemographic factors (7--10). The CDC HRQOL-4 measures include questions regarding self-rated health and the number of recent days when physical health was impaired, mental health was impaired, and activities were limited because of poor health. Additional optional BRFSS questions regarding recent days of pain, depression, anxiety, sleeplessness, and vitality are available for states to use (http://www.cdc.gov/hrqol). This report summarizes the perceived physical and mental health of the U.S. population, assesses HRQOL among adults with different sociodemographic characteristics, identifies vulnerable populations, examines seasonal patterns and geographic variations, and evaluates HRQOL among persons with chronic medical conditions. The report also provides data on U.S. adult HRQOL so community groups and clinicians can compare their HRQOL findings with state and national populations. MethodsQuestionnairesFor this analysis, data were derived from the 1993--2001 BRFSS surveys and the 2001--2002 NHANES. BRFSS is an ongoing, random-digit--dialed telephone survey of the noninstitutionalized, U.S. civilian population aged >18 years conducted in all 50 states and the District of Columbia (DC). BRFSS monitors the prevalence of key health- and safety-related behaviors and characteristics of the U.S. population. Details regarding design and content of BRFSS are available at http://www.cdc.gov/brfss. NHANES is an ongoing series of cross-sectional surveys on health and nutrition designed to be nationally representative of the noninstitutionalized, U.S. civilian population by using a complex, multistage probability design. The 2001--2002 NHANES oversampled low-income persons, persons aged 12--19 years, persons aged >60 years, non-Hispanic blacks, and Mexican Americans. NHANES includes a household interview and health examination component. The health examination component was performed in a mobile examination center (MEC) and included the MEC interview, physical examination, and laboratory examination (11). During the household interview, NHANES participants aged >20 years were asked to self-report whether they had ever been diagnosed with a chronic medical condition. The CDC HRQOL-4 questions were asked during the MEC interview. Details regarding design and content of NHANES are available at http://www.cdc.gov/nchs/nhanes.htm. Health-Related Quality of Life MeasuresThe CDC HRQOL-4 measures included in BRFSS and NHANES (11,12) were
During 1993--2001, a total of 1,291,986 persons (52% female) participated in BRFSS. The median state response rate† ranged from 71.4% in 1993 to 51.1% in 2001 (12). During 2001--2002, a total of 13,156 persons were selected for the NHANES sample; of these, 11,039 (83.9%) completed the household interview, and 10,480 (79.7%) completed the health examination component. Data for respondents aged >18 years who were asked the Healthy Days measures (n = 5,130; 52% female) at the MEC were analyzed (11). BRFSS contains only a limited number of self-reported chronic health conditions, and not all conditions are assessed annually. Therefore, to assess perceived disease burden, the associations between HRQOL and chronic medical conditions were examined among NHANES respondents aged >20 years who were asked questions regarding common medical conditions during the household interview (12). To compare HRQOL reported by BRFSS respondents with that from NHANES respondents, comparable age and sociodemographic groups and periods were examined from each surveillance system. Because BRFSS included the HRQOL questions in only 21 states in 2002, data for 2002 were excluded from the comparative analysis. Only data from the 2001 BRFSS were examined. Data AnalysisBRFSS 1993--2001 The following characteristics for the Healthy Days measures were examined: time trends, sociodemographic characteristics, month (seasonality), and state of residence. Percentages, means, and 95% confidence intervals (CIs) were calculated, as well as percentages of responses to the self-rated health measure. Self-rated health was dichotomized into two groups (i.e., fair or poor versus excellent, very good, or good); calculated percentages in these categories have been reported previously (1,2). Overall unhealthy days were calculated, which is the sum of each respondent's physically or mentally unhealthy days, with a maximum of 30 unhealthy days (2). For those respondents who reported no physically and mentally unhealthy days, activity limitation days were imputed as zero. Although Healthy Days measures were categorized into responses indicating zero days, 1--13 days, and >14 days of physically unhealthy days, mentally unhealthy days, overall unhealthy days, and activity limitation days, only the percentages of persons with zero days and >14 days were assessed (13,14). The pattern of responses to the Healthy Days measures across sociodemographic groups was consistent regardless of interview year or state of residence. For example, persons with less than a high school degree reported more overall unhealthy days than those with a college degree, regardless of interview year or state of residence. Therefore, to increase the reliability of estimates, aggregate data were used from 1993 through 2001 to examine HRQOL. For BRFSS data, 95% CIs were calculated by using the z distribution (point estimates + [standard error X 1.96]). To examine seasonal patterns and monthly differences, a 3-month moving average was calculated from monthly BRFSS 1993--2001 HRQOL data for physically unhealthy days, mentally unhealthy days, overall unhealthy days, and activity limitation days for each year during 1998--2001 and for comparable monthly periods during the previous 5 years (15). Data were weighted to estimate population means and percentages and age-standardized to the 2000 U.S. standard population. Trends were analyzed by using multiple linear and logistic regression analyses that controlled for sex, age, race/ethnicity, education, income, marital status, employment status, and health insurance status. Unadjusted, multivariable-adjusted, age-standardized values, and 95% CIs were calculated by using SUDAAN to account for the complex survey design. County-level estimates were obtained from BRFSS and temporally aggregated into two periods: 1993--1997 and 1998--2001. Data were age-standardized to the 2000 U.S. standard population. Data were spatially smoothed using a nonparametric median smoothing technique (16--18). Data values were then classified into six ranges with substantively meaningful break points, corresponding to whole-day values. The geographically varying nature of the mean number of unhealthy days reported by adults during the two periods was determined. NHANES 2001--2002 Means and 95% CIs were calculated by sociodemographic characteristics, chronic medical conditions, and number of medical conditions. Self-rated health was dichotomized into two groups (i.e., fair or poor versus excellent, very good, or good), and crude and age-standardized (to the 2000 U.S. standard population) percentages were calculated in these categories by chronic medical conditions and by number of medical conditions. For NHANES data, 95% CIs were calculated by using the Student's t-distribution with 15 degrees of freedom to account for sample clustering. Data were weighted to estimate population means and percentages, and SUDAAN was used to account for the complex survey design. NHANES responses to the CDC HRQOL-4 questions were compared with those from the 2001 BRFSS by sociodemographic characteristics. Substantial differences in HRQOL between NHANES and BRFSS data sets were assessed by examining nonoverlapping 95% CIs. Only significant differences were documented. ResultsBRFSS 1993--2001After multivariable adjustment, trend analysis indicated that, during 1993--2001, the percentage of respondents who reported poor health increased from 3.3% to 4.1%; fair health, from 9.7% to 11.4%; and good health, from 27.2% to 29.8%. The percentage of respondents who reported excellent health decreased from 25.8% to 21.7%, and those who reported very good health decreased from 34.1% to 33.0% (Table 1). Age-standardized results also indicated increases in the percentage of respondents who reported poor, fair, and good health and a decrease in the percentage of respondents who reported excellent health (Table 1, Figure 1). During the same period, multivariable adjusted mean number of physically unhealthy days increased from 2.9 to 3.4, mentally unhealthy days increased from 2.9 to 3.5, overall unhealthy days increased from 5.2 to 6.1, and activity limitation days increased from 1.6 to 2.0 (Table 2). The increases in the age-standardized mean number of physically unhealthy, mentally unhealthy, overall unhealthy, and activity limitation days were significant (Table 2, Figure 2). The multivariable adjusted percentage of respondents with zero physically unhealthy days, mentally unhealthy days, overall unhealthy days, or activity limitation days decreased, whereas the multivariable adjusted percentage of respondents with >14 days of physically unhealthy days, mentally unhealthy days, overall unhealthy days, or activity limitation days increased (Table 3, Figure 3). HRQOL by Selected Sociodemographic Subgroups Sex. A higher percentage of women reported fair or poor health (15.5%) compared with men (13.3%) (Table 4). Regardless of race/ethnicity, when compared with men, women reported significantly more physically unhealthy days (3.6 versus 2.7), mentally unhealthy days (3.5 versus 2.5), overall unhealthy days (6.3 versus 4.6), and activity limitation days (2.0 versus 1.6) (Table 5). Similarly, compared with men, a higher percentage of women reported >14 physically unhealthy days (10.8% versus 8.0%), mentally unhealthy days (10.6% versus 7.2%), overall unhealthy days (19.1% versus 13.4%), and activity limitation days (6.0% versus 4.9%) (Table 6). Age. A total of 33.2% of older adults (i.e., aged >75 years) reported fair or poor health, whereas only 7.5% of young adults (i.e., aged 18--24 years) reported fair or poor health (Table 4). Adults aged >75 years reported the highest numbers of physically unhealthy days (6.0), overall unhealthy days (6.9), and activity limitation days (3.0). Adults aged 18--24 years reported the highest number of mentally unhealthy days (3.7) (Table 5). As age increased, mean number of physically unhealthy days, overall unhealthy days, and activity limitation days increased, and mentally unhealthy days decreased. Adults aged >75 years reported the highest percentage with >14 physically unhealthy days (20.3%), overall unhealthy days (22.7%), and activity limitation days (10.3%). Adults aged 18--24 years reported the highest percentage of >14 mentally unhealthy days (10.5%) (Table 6). Race/Ethnicity. Compared with non-Hispanic whites (12.8%), more Hispanics (21.9%), American Indians/Alaska Natives (21.1%), and non-Hispanic blacks (19.8%) reported fair or poor health, and fewer Asians/Pacific Islanders (9.0%) reported fair or poor health (Table 4). The percentages of Hispanic men (19.6%), American Indian/Alaska Native men (19.2%), and black men (17.3%) with fair or poor health were higher and the percentage of Asian/Pacific Islander men (8.8%) with fair or poor health was lower than that of white men (12.0%) (Table 7). Similarly for women, percentages of Hispanic women (24.2%), American Indian/Alaska Native women (23.1%), and black women (21.6%) with fair or poor health were higher and the percentage of Asian/Pacific Islander women (9.2%) with fair or poor health was lower than that of white women (13.6%). Reported mean number of physically unhealthy days was higher among American Indian/Alaska Native men (3.9) than among men of "other races" (3.1), and black (3.0), white (2.7), and Hispanic (2.7) men (Table 8). American Indian/Alaska Native women (4.9) and women of "other races" (4.1) reported more mean number of physically unhealthy days than black (3.8), Hispanic (3.8), and white (3.5) women. Asian/Pacific Islander men and women reported the fewest physically unhealthy days (1.8 and 2.2, respectively). Reported mean number of mentally unhealthy days was higher among American Indian/Alaska Native men (4.1) and men of "other races" (3.5) than Hispanic (2.9), black (2.7), and white (2.4) men (Table 8). American Indian/Alaska Native women (5.0) and women of "other races" (4.9) reported more mentally unhealthy days than Hispanic (4.0), black (3.8), and white (3.5) women. Asian/Pacific Islander men and women reported the fewest mentally unhealthy days (2.1 and 2.6, respectively). In addition, American Indian/Alaska Native men (6.7) and men of "other races" (5.8) reported more overall unhealthy days than black (4.9), Hispanic (4.9), and white (4.5) men (Table 8). American Indian/Alaska Native women (8.4) and women of "other races" (7.9) reported more overall unhealthy days than black (6.7), Hispanic (6.7), and white (6.2) women. Asian/Pacific Islander men and women reported the fewest overall unhealthy days (3.6 and 4.5, respectively). Reported activity limitation days were higher among American Indian/Alaska Native men (2.6) than among men of "other races" (2.1), and black (1.9), white (1.6), and Hispanic (1.6) men (Table 8). American Indian/Alaska Native women (3.1) and women of "other races" (2.9) also reported more activity limitation days than black (2.4), Hispanic (2.1), and white (1.9) women. Asian/Pacific Islander men and women reported the fewest activity limitation days (1.1 and 1.2, respectively). More American Indians/Alaska Natives (13.5%) reported >14 physically unhealthy days and fewer Asians/Pacific Islanders (5.1%) reported >14 physically unhealthy days than persons of "other races" (10.9%), blacks (10.5%), Hispanics (10.0%), and whites (9.3%) (Table 6). More American Indians/Alaska Natives (14.4%) and persons of "other races" (12.9%) reported >14 mentally unhealthy days and fewer Asians/Pacific Islanders (6.2%) reported >14 mentally unhealthy days than whites (8.6%), blacks (10.3%), and Hispanics (10.5%). In addition, more American Indians/Alaska Natives (23.8%) and persons of "other races" (20.4%) reported >14 overall unhealthy days and fewer Asians/Pacific Islanders (10.6%) reported >14 overall unhealthy days than Hispanics (18.1%), blacks (18.0%), and whites (16.0%). The percentages of persons who reported >14 activity limitation days were higher among American Indians/Alaska Natives (9.2%), persons of "other races" (7.6%), and blacks (6.9%) and were lower among Asians/Pacific Islanders (2.9%) than Hispanics (5.7%) and whites (5.2%) (Table 6). In comparison, the percentages of blacks and Hispanics with >14 physically unhealthy days, mentally unhealthy days, and overall unhealthy days did not differ but were higher than whites. Marital status. Higher percentages of widowed (31.1%), separated (23.1%), and divorced (18.5%) persons reported fair or poor health, compared with married persons (13.0%) (Table 4). Widowed (5.7), separated (4.5), and divorced (4.2) persons reported the most mean number of physically unhealthy days (Table 5). Mean number of overall unhealthy days and activity limitation days was higher among separated (8.8 and 3.0), divorced (7.3 and 2.7), and widowed (7.3 and 3.0) persons than among married persons (4.9 and 1.6), never married persons (5.4 and 1.5), and unmarried couples (6.5 and 1.7). Separated (5.9), divorced (4.4), and unmarried couples (4.4) also reported more mentally unhealthy days than never married (3.5), widowed (2.9), and married (2.5) persons. The same patterns were observed among groups reporting >14 physically unhealthy days, overall unhealthy days, mentally unhealthy days, and activity limitation days. Higher percentages of widowed (19.1%), separated (14.1%), and divorced (13.2%) persons reported >14 physically unhealthy days, compared with married persons (8.7%), unmarried couples (7.8%), and never married persons (5.9%) (Table 6). More separated (28.3%), widowed (23.9%), and divorced (22.8%) persons reported >14 overall unhealthy days than unmarried couples (19.1%), never married persons (15.1%), and married persons (14.3%). More separated (19.4%), divorced (13.9%), and unmarried couples (12.9%) reported >14 mentally unhealthy days, and more widowed (10.0%), separated (9.6%), and divorced (8.6%) persons reported >14 activity limitation days than other groups. Education. The percentage of adults with less than a high school education (34.6%) who reported fair or poor health was higher than that of high school graduates (15.7%), those with some college (10.7%), and college graduates (6.1%) who reported fair or poor health (Table 4). Those with less than a high school education reported more physically unhealthy days (5.5), mentally unhealthy days (3.9), overall unhealthy days (7.8), and activity limitation days (3.2) than those of higher education. High school graduates reported 3.2 physically unhealthy days, 3.1 mentally unhealthy days, 5.7 overall unhealthy days, and 1.8 activity limitation days, whereas college graduates reported 2.1 physically unhealthy days, 2.3 mentally unhealthy days, 4.0 overall unhealthy days, and 1.1 activity limitation days (Table 5). Compared with other education subgroups, higher percentages of persons with less than a high school education reported >14 physically unhealthy days (18.2%), mentally unhealthy days (13.0%), overall unhealthy days (25.8%), and activity limitation days (10.8%) (Table 6). Lower percentages of persons with a college education reported >14 physically unhealthy days (5.3%), mentally unhealthy days (6.0%), overall unhealthy days (10.6%), and activity limitation days (2.9%). Annual household income. The percentage of adults with an annual household income of <$15,000 who reported fair or poor health (31.5%) was significantly higher than adults with annual household incomes of $15,000--$24,999 (19.9%), $25,000--$49,999 (10.3%), and >$50,000 (5.1%) (Table 4). Persons with an annual household income of <$15,000 reported more physically unhealthy days (5.9), mentally unhealthy days (4.8), overall unhealthy days (8.8), and activity limitation days (3.8), whereas those with an annual household income of >$50,000 reported fewer physically unhealthy days (1.9), mentally unhealthy days (2.3), overall unhealthy days (4.0), and activity limitation days (1.0) (Table 5). Similarly, more adults with a <$15,000 annual household income reported >14 physically unhealthy days (19.3%), >14 mentally unhealthy days (15.6%), >14 overall unhealthy days (28.5%), and >14 activity limitation days (12.6%) than adults in higher income households (Table 6). Employment status. Persons who were retired (27.6%), unemployed for <1 year (15.8%), unemployed for >1 year (27.2%), and unable to work (67.0%) more often reported fair or poor health than adults employed for wages (7.8%) and self-employed adults (8.4%) (Table 4). In addition, persons who were retired (5.0), unemployed for <1 year (3.5), unemployed for >1 year (5.6), and unable to work (16.5) reported more physically unhealthy days than adults employed for wages (1.9) and self-employed adults (2.1) (Table 5). Persons who were unemployed for <1 year (5.1), unemployed for >1 year (5.9), and unable to work (9.7) reported more mentally unhealthy days than other groups. The mean number of overall unhealthy days was comparatively high among persons who were retired (6.1), unemployed for <1 year (7.6), unemployed for >1 year (9.5), and those unable to work (19.8). Activity limitation days were also comparatively high among retired persons (2.5), <1 year unemployed persons (2.8), >1 year unemployed persons (4.5), and those unable to work (13.4). However, retired persons reported the fewest mentally unhealthy days (2.0), whereas persons who were self-employed and employed for wages reported the fewest physically unhealthy days (2.1 and 1.9), overall unhealthy days (4.3 and 4.4), and activity limitation days (1.0 and 0.9), compared with persons with other employment status. Compared with persons with any other employment status, more retired persons (16.7%), unemployed persons (10.6%--18.7%), and those unable to work (58.2%) reported >14 physically unhealthy days; more retired persons (19.7%), unemployed persons (23.9%--30.5%), and those unable to work (67.8%) reported >14 overall unhealthy days; and more retired persons (8.5%), unemployed persons (8.5%--15.8%), and those unable to work (47.7%) reported >14 activity limitation days (Table 6). Conversely, significantly fewer retired persons (6.1%) reported >14 mentally unhealthy days, and more unemployed persons (16.1%--19.3%) and those unable to work (34.3%) reported >14 mentally unhealthy days. Health-care plan status. Except for physically unhealthy days, all measures were associated with not having health insurance. Adults without health insurance (18.5%) more often reported fair or poor health (Table 4) and more mentally unhealthy days (4.3), overall unhealthy days (6.6), and activity limitation days (2.0) than adults with health insurance (Table 5). The percentage of adults without health insurance with >14 mentally unhealthy days (13.4%), overall unhealthy days (20.2%), and activity limitation days (6.2%) was higher than those with health insurance (8.3%, 15.7%, and 5.3%, respectively) (Table 6). SeasonalityAlthough mean number of mentally unhealthy days (Figure 4) and activity limitation days (Figure 5) did not change seasonally, mean number of physically unhealthy days (Figure 6) and overall unhealthy days (Figure 7) during winter months exceeded that during summer months. Furthermore, for these measures, the monthly means for the months during 1998--2001 exceeded that for the previous 5 years (Figures 4--7). Associations Between Self-Rated Health and HRQOLSelf-rated health was strongly associated with unhealthy days in both BRFSS and NHANES data. In BRFSS, persons with excellent health reported the least number of physically unhealthy days (0.9), mentally unhealthy days (1.7), overall unhealthy days (2.5), and activity limitation days (0.5) (Table 9). Persons with fair or poor health reported substantially more physically unhealthy days (11.8), mentally unhealthy days (6.5), overall unhealthy days (14.8), and activity limitation days (6.9). Similar patterns were observed in NHANES data (Table 10). Comparison of NHANES 2001--2002 and BRFSS 2001Mean number of physically unhealthy days, mentally unhealthy days, overall unhealthy days, and activity limitation days among different sociodemographic subgroups was generally comparable among 2001--2002 NHANES respondents and 2001 BRFSS respondents. For example, in both data sets, women, persons with less than a high school education, and persons with a <$15,000 annual household income reported worse HRQOL than men and those with more education and annual household income (Tables 10 and 11). HRQOL by Medical Condition (NHANES 2001--2002)During 2001--2002, NHANES respondents with one or more chronic medical condition reported worse HRQOL than those without such conditions. Compared with persons without any chronic medical conditions, persons with such conditions more often reported fair or poor health. For example, whereas only 7.1% of those without any chronic medical conditions reported fair or poor health, 27.5% of those with arthritis reported fair or poor health. An increasing number of medical conditions increased the percentage of those reporting fair or poor health (age-standardized) (Table 12). For example, 13.6% of those with one medical condition, 21.4% of those with two conditions, 29.4% of those with three conditions, 44.9% of those with four conditions, and 75.4% of those with five conditions reported fair or poor health. Persons with any chronic medical condition reported significantly more physically unhealthy days, mentally unhealthy days, overall unhealthy days, and activity limitation days than those without such a condition. For example, compared with those without any chronic conditions, those with arthritis reported an average of 6.7 (versus 2.2) physically unhealthy days, 5.1 (versus 2.9) mentally unhealthy days, 10.0 (versus 4.8) overall unhealthy days, and 2.9 (versus 0.9) activity limitation days (Table 13). As the number of medical conditions increased, the mean number of physically unhealthy days, mentally unhealthy days, overall unhealthy days, and activity limitation days increased. Persons with five or more conditions reported mentally unhealthy days and overall unhealthy days two times more; physically unhealthy days, three times more; and activity limitation days, at least four times more than those with one chronic medical condition. HRQOL Trends Within States (BRFSS 1993--2001)During 1993--2001, age-standardized mean number of physically unhealthy days increased in 13 states§ and remained stable in all other states (Table 14). The median age-standardized mean number of physically unhealthy days for all states over all years and both sexes was 3.2, with state means ranging from 2.4 to 3.9. In all but three states (Arizona, Louisiana, and West Virginia) and DC, women reported significantly more physically unhealthy days (median: 3.4 days; range: 2.4--4.1 days) than men (median: 2.8 days; range: 2.1--3.8 days) (Table 15). During the same period, an increase was observed in mentally unhealthy days in 13 states¶ and DC, and a decrease was observed in North Dakota (Table 16). The median age-standardized mean number of mentally unhealthy days for all states over all years and both sexes was 3.0, with state means ranging from 2.2 to 4.3. Women reported more mentally unhealthy days (median: 3.5 days; range: 2.7--5.2 days) than men (median: 2.3 days; range: 1.8--3.4 days), regardless of their state of residence (Table 17). During 1993--2001, a total of 17 states** and DC had increasing levels of overall unhealthy days (Table 18). Only North Dakota had a significant decline in overall unhealthy days. The median age-standardized mean number of overall unhealthy days for all states over all years and both sexes was 5.3, with state means ranging from 4.1 to 6.8. In every state, women reported more overall unhealthy days (median: 6.2 days; range: 4.6--7.7 days) than men (median: 4.6 days; range: 3.6--5.8 days) (Table 19). The age-standardized mean number of activity limitation days increased in 16 states†† and DC (Table 20). The median age-standardized mean number of activity limitation days for all states over all years and both sexes was 1.7, with state means ranging from 1.2 to 2.8. In 22 states, women reported more activity limitation days (median: 1.9 days; range: 1.3--2.8 days) than men (median: 1.6 days; range: 1.1--2.8 days) (Table 21). During 1993--2001, significant increases were observed in mean number of physically unhealthy days, mentally unhealthy days, overall unhealthy days, and activity limitation days in six census divisions (i.e., Middle Atlantic, New England, East North Central, East South Central, South Atlantic, and West South Central). Among these six divisions, the East South Central region (i.e., Alabama, Kentucky, Mississippi, and Tennessee) had the worst HRQOL (Tables 15, 17, 19, and 21). From 1993--1997 to 1998--2001, mean overall unhealthy days increased nationally; the majority of states had more areas that averaged six or more overall unhealthy days during 1998--2001 than during 1993--1997 (Figures 8 and 9). The percentage of all counties that averaged six or more overall unhealthy days (age-standardized) increased from 29% during 1993--1997 to 42% during 1998--2001. DiscussionThe findings in this report indicate that, during 1993--2001, the perceived physical and mental health of U.S. adults worsened. Mean number of unhealthy days, activity limitation days, and self-rated health substantially differed among socioeconomic and demographic subgroups. Women; American Indians/Alaska Natives; persons of "other races," non-Hispanics; persons with a <$15,000 annual household income; persons with less than a high school degree; persons without health insurance; and persons who were divorced, separated, or widowed reported more days of impaired physical and mental health. These findings are consistent with previously reported findings among the U.S. adult population (2,3,19,20). The aging of the U.S. population does not explain these worsening trends because age standardization did not alter these findings (7). Women reported more unhealthy days and activity limitation days than men, consistent with previous studies (2,3,7). Unique physiologic (e.g., reproductive cycle and pregnancy), psychologic (e.g., willingness to disclose mental health distress), socioeconomic status (e.g., education, income, and occupation), and social factors (e.g., work and child or adult care giving stress, lack of social support) might explain these differences (21,22). Consistent with previous study findings, older adults reported more physically unhealthy days and activity limitation
days, whereas younger adults reported more mentally unhealthy days
(2,3). Older adults are more likely to have chronic
diseases that impair their physical health. The greater number of mentally unhealthy days among young adults is of public
health concern because they might indicate an increased risk for adoption of risky behaviors (e.g., cigarette smoking, alcohol use,
and violence) that have serious consequences for impaired health as young adults age
(23,24). Young adults might be at increased risk for psychological distress because they are adjusting to new social roles (e.g., occupation and parenthood), have
less resilience in dealing with stressful life events, and might have fewer financial resources to buffer them from stress
(25--30). However, older adults who might benefit from the additional resources conferred with age (e.g., income and wealth, access
to Social Security and Medicare) also might have successfully resolved stressful life events that account for greater
psychologic distress (28,31,32). In addition, this observed age difference in mentally unhealthy days is limited to
community-dwelling older adults and underrepresents older adults who are more likely to reside in institutions and who might have poor
cognitive or psychologic outcomes. Therefore, mentally unhealthy days might have been underestimated in older adults
(9,10). Among racial/ethnic populations, worse HRQOL among American Indians/Alaska Natives might be partly attributed to factors such as income, education, occupation, disease status, behavioral risk factors, social and cultural factors (e.g., disenfranchisement and discrimination) that can impair perceived physical and mental health. The percentage of Hispanics who reported fair or poor health was as high as American Indians/Alaska Natives; however, Hispanics reported fewer mean number of physically unhealthy days, mentally unhealthy days, overall unhealthy days, and activity limitation days than American Indians/Alaska Natives. The differences in HRQOL by race/ethnicity might be associated with cultural differences (33) or with the difference in the nature of information obtained by the self-rated health question and Healthy Days questions (34). For example, the "days" questions refer to physical or mental distress within the preceding 30 days, whereas self-rated health is a measure of perceived health that can include a broad period (34). Although Hispanics might not report recent physical or mental health distress, they might be more likely to report lifetime impaired health associated with a number of health and psychosocial factors. This finding warrants further study. The findings in this report provide additional evidence regarding the strong associations between HRQOL and marital status, socioeconomic status (i.e., employment, income, and education), and health insurance status (19,20,35). HRQOL responses among the respondents with similar socioeconomic and demographic characteristics did not differ substantially from the 2001 BRFSS to the 2001--2002 NHANES. This indicates the comparability of responses to the Healthy Day measures across the surveys. Although only North Dakota had fewer mentally unhealthy days and overall unhealthy days over time, the remaining states and DC either had increases or no changes in mean number of physically unhealthy days, mentally unhealthy days, overall unhealthy days, and activity limitation days. The geographic maps indicate increasingly more areas with six or more overall unhealthy days within the majority of states. Environmental, economic, and social differences among and within states might account for these HRQOL differences and warrant future studies and possible intervention to improve HRQOL. A seasonal pattern was observed in physical health; the mean number of physically unhealthy days during winter months was higher than during summer months. This might be attributable, in part, to the increased incidence of medical conditions (e.g., influenza) or to the exacerbation of existing chronic conditions (e.g., pulmonary and cardiovascular disease) (36--40). For respondents with at least one chronic medical condition, findings indicated that both their perceived physical health and mental health were impaired, consistent with other findings (7--10,41). As the number of chronic medical conditions increased, mean number of physically unhealthy days, mentally unhealthy days, and activity limitation days also increased. Stress, anxiety, depression, and uncertainty often occur with chronic illness, as illness can affect a person's ability to cope with daily activities. Furthermore, psychologic distress might lead to adoption of unhealthy coping behaviors, further impairing physical health. The high number of mentally unhealthy days among persons with chronic medical conditions warrants further examination. The strong associations between self-rated health and the HRQOL measures provide additional evidence of the validity of the HRQOL measures described in this report. LimitationsThe findings in this report are subject to at least six limitations. First, because NHANES and BRFSS surveys include only noninstitutionalized adults, persons in institutions, persons in households without telephones, and the homeless (i.e., populations that might have worse HRQOL than others) were excluded (9,10). Second, because NHANES and BRFSS surveys are cross-sectional surveys, HRQOL and the characteristics studied (e.g., unemployment, inability to work, and marital status) were assessed at a single point in time. Thus, determining whether the association of some of these characteristics with HRQOL preceded or followed these HRQOL responses was not possible. Third, because the results for the selected sociodemographic subgroups were crude estimates, adjusting for these sociodemographic characteristics might have changed the results. Fourth, other variables not studied such as risky health behaviors, the physical and the social environment (e.g., air pollution, poor housing, and violence), functional status, stressful life events, and unmeasured socioeconomic factors (e.g., wealth and type of employment) might account for additional HRQOL differences among population subgroups. Fifth, although evidence exists indicating good measurement properties for the HRQOL measures (http://www.cdc.gov/hrqol/measurement_properties/index.htm), reliability might vary by subgroups (e.g., age, income level, race/ethnicity, and acculturation), by scaling methods used (e.g., grouping responses into categories of 0, 1--13, >14 days), and by response shift (e.g., changes in health perceptions after the onset of a chronic illness or injury), affecting judgment and responses to the Healthy Days questions (42). Finally, the HRQOL mental health measure was not validated for detection of mental illness with clinical psychiatric examinations. Public Health ActionFindings from ongoing national surveillance of HRQOL are useful for identifying vulnerable subpopulations, tracking population trends, and monitoring progress in achieving Healthy People 2010 goals. The findings in this report indicate that women, the youngest adults, older adults, those with annual household incomes of <$15,000, those with less than a high school education, American Indians/Alaska Natives, and those without health-care coverage are vulnerable populations that could benefit from interventions designed to reduce their burden of impaired HRQOL. Because interventions on diet, physical activity, and smoking have indicated improved health outcomes, the evidenced-based programs in the Guide to Community Preventive Services (http://www.thecommunityguide.org) might be useful in improving HRQOL. Examples of how national, state, and local programs have used Healthy Days measures are documented on the CDC HRQOL website (http://www.cdc.gov/hrqol) and in previously published reports (43,44). Population HRQOL tracking with the Healthy Days measures is recommended to assess the perceived physical and mental health needs of adults, prioritize population health needs and disparities, and document the health effects of policies and interventions. Although the Healthy Days measures have been used in studies with adolescents (45--47), more research is needed to assess validity and reliability of these and similar measures in populations aged <18 years. To develop a more comprehensive population HRQOL surveillance system, additional self-rated health and HRQOL data from other national surveys such as the National Health Interview Survey (NHIS), the Medical Expenditure Panel Survey (MEPS), and Current Population Survey should also be analyzed and evaluated. Where sample size permits, additional analysis of Healthy Days surveillance data at the metropolitan area, county, and sub-county levels is recommended to identify community-level factors that influence population health. Assessing the perceived physical and mental health effects of natural and man-made disasters in collaboration with federal, state, and community partners should be a priority. Healthy Days surveillance data currently available from the 2001--2002 NHANES for adolescents aged >12 years should also be analyzed, as well as older adult Healthy Days data currently available from the 2003 and later Center for Medicare and Medicaid Services Health Outcome Study (48). The CDC HRQOL-4 measures, recently recommended as standard cross-cutting measures for chronic disease surveillance (49), should be continued each year in the core BRFSS and in NHANES. When feasible, these and other HRQOL measures should also be included in other key national, state, and local surveillance systems (e.g., NHIS, MEPS, the General Social Survey, and the Youth Risk Behavior Survey) to permit direct HRQOL comparisons across major surveillance systems and to help identify health-related behaviors, policies, and interventions that can improve population health and reduce health disparities. In addition, population health assessment professionals should continue to refine and validate HRQOL, functional status, and self-reported health measures. Acknowledgments State Behavioral Risk Factor Surveillance System coordinators and the National Center for Health Statistics, Division of Health Examination Statistics contributed data for this report. The project was supported through a cooperative agreement between CDC and the Association of Teachers of Preventive Medicine, Washington, DC, and through an interagency agreement between CDC and the U.S. Department of Energy and administered by the Oak Ridge Institute for Science and Education, Oak Ridge, Tennessee. References
* School was included in only NHANES. † According to the methodology of the Council of American Survey Research Organizations, the response rate includes the number of completed interviews in the numerator and an estimate of interviewees and those whose eligibility is undetermined in the denominator. § Alabama, Alaska, Connecticut, Maine, Michigan, Mississippi, New Hampshire, New Jersey, New Mexico, New York, North Carolina, Oregon, and South Carolina. ¶ Alabama, Arkansas, Connecticut, Kentucky, Maine, New Jersey, New Mexico, North Carolina, Oregon, South Dakota, Texas, Utah, and Virginia. ** Alabama, Alaska, Arkansas, Connecticut, Kentucky, Maine, Michigan, Mississippi, New Jersey, New Mexico, New York, North Carolina, Oregon, South Dakota, Utah, Virginia, and Washington. †† Alabama, Connecticut, Florida, Idaho, Louisiana, Maine, New Mexico, New York, North Carolina, Ohio, Oregon, South Carolina, Tennessee, Virginia, Washington, and Wyoming. Table 1  Return to top. Figure 1 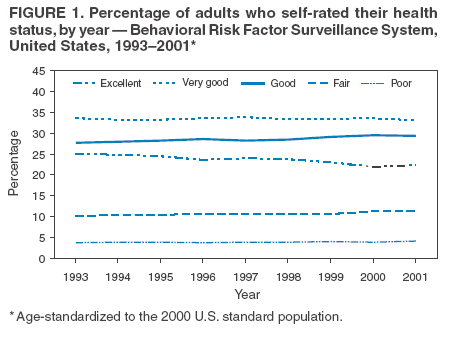 Return to top. Table 2  Return to top. Figure 2 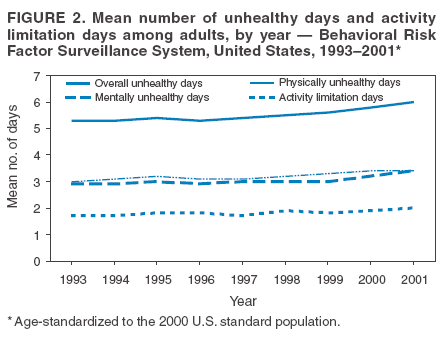 Return to top. Table 3  Return to top. Figure 3 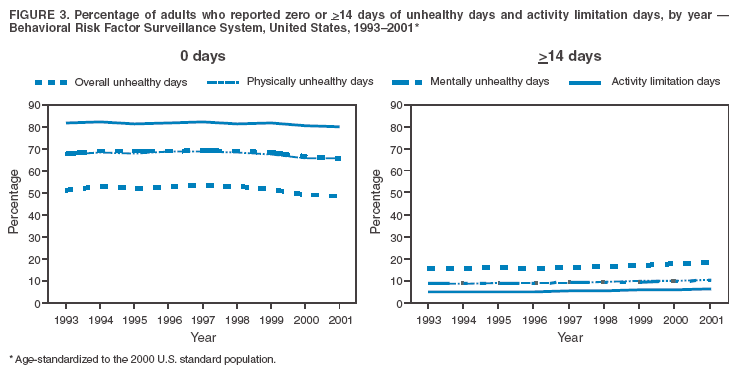 Return to top. Table 4 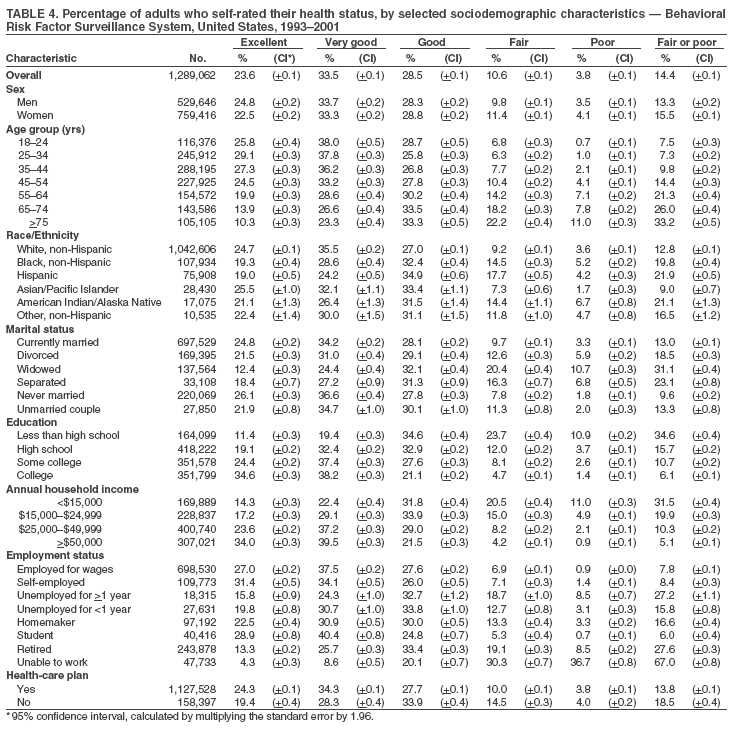 Return to top. Figure 4 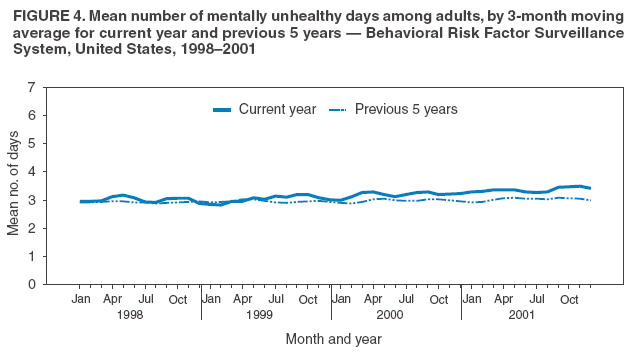 Return to top. Table 5 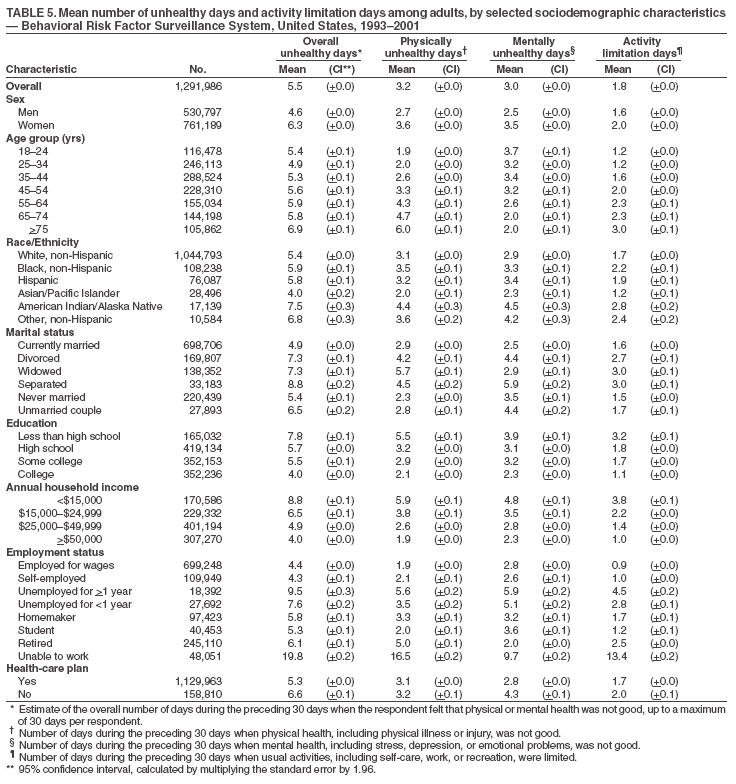 Return to top. Figure 5  Return to top. Table 6 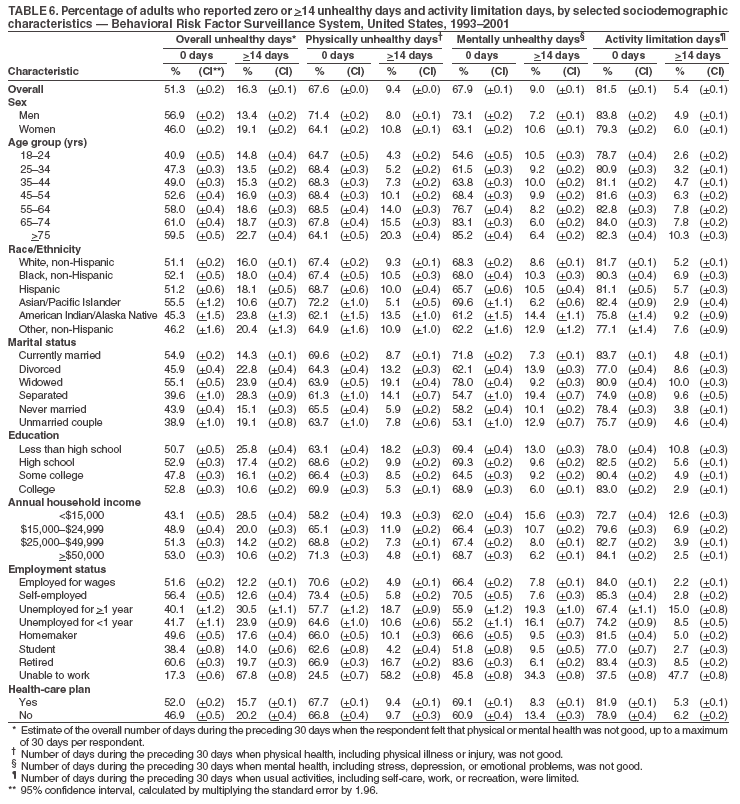 Return to top. Figure 6 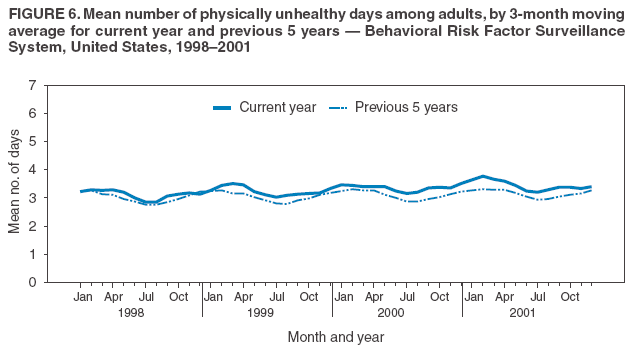 Return to top. Table 7 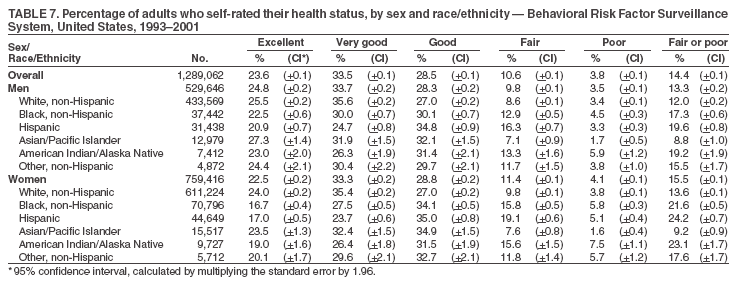 Return to top. Figure 7 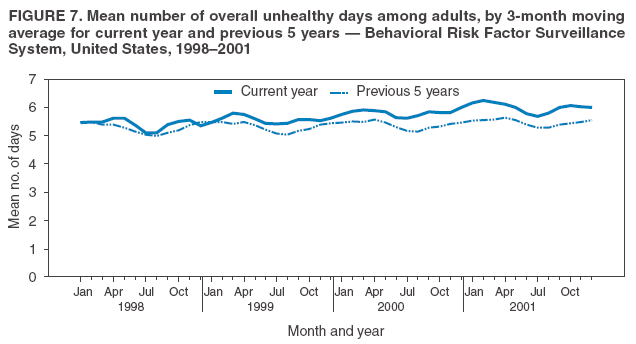 Return to top. Table 8 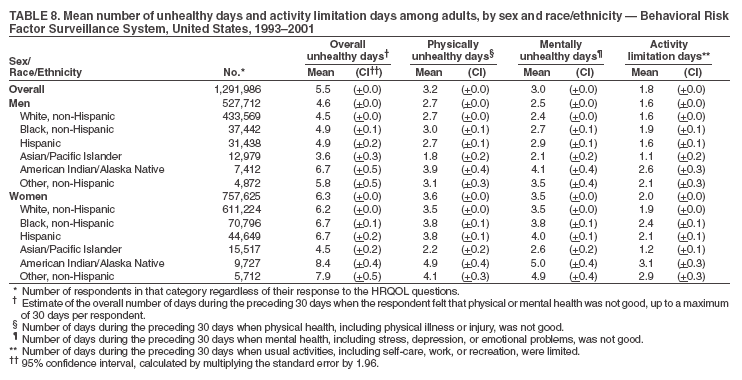 Return to top. Figure 8 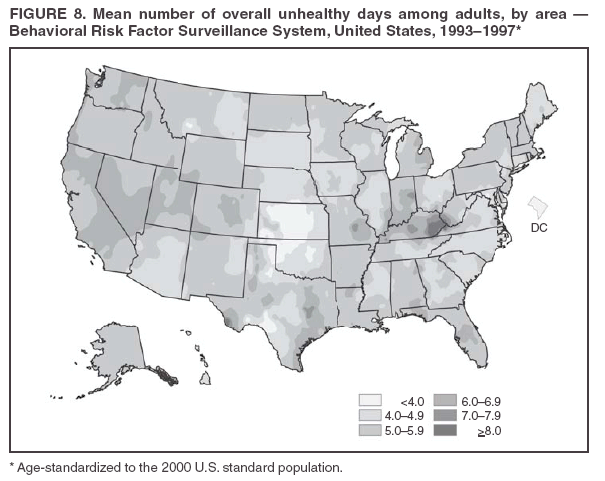 Return to top. Table 9 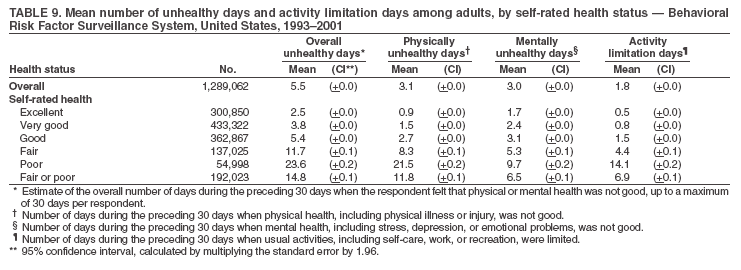 Return to top. Figure 9 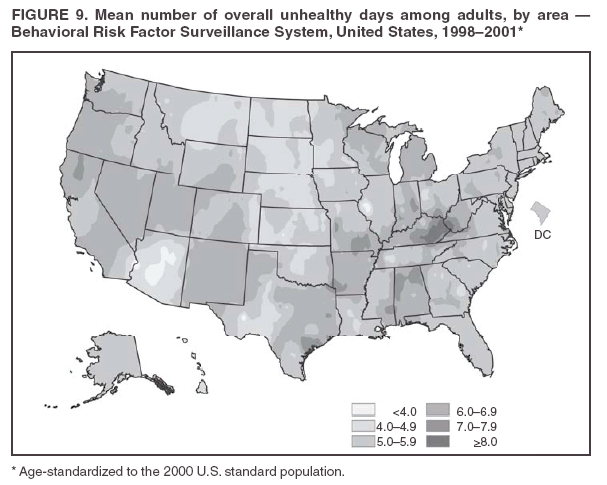 Return to top. Table 10 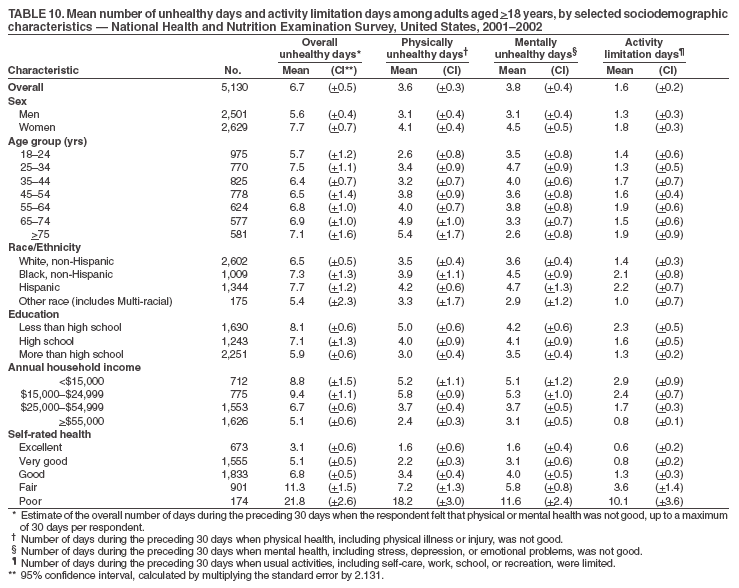 Return to top. Table 11 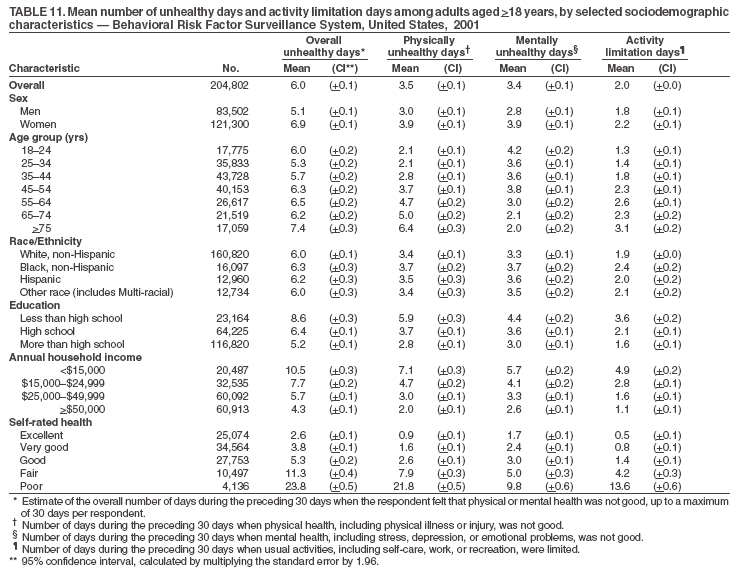 Return to top. Table 12 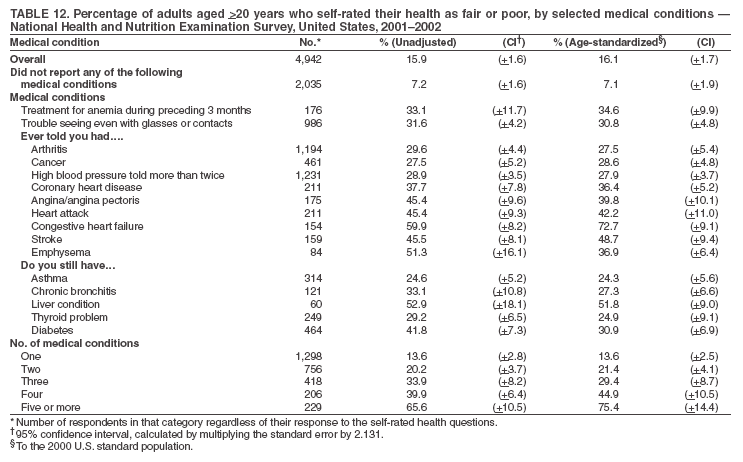 Return to top. Table 13  Return to top. Table 14 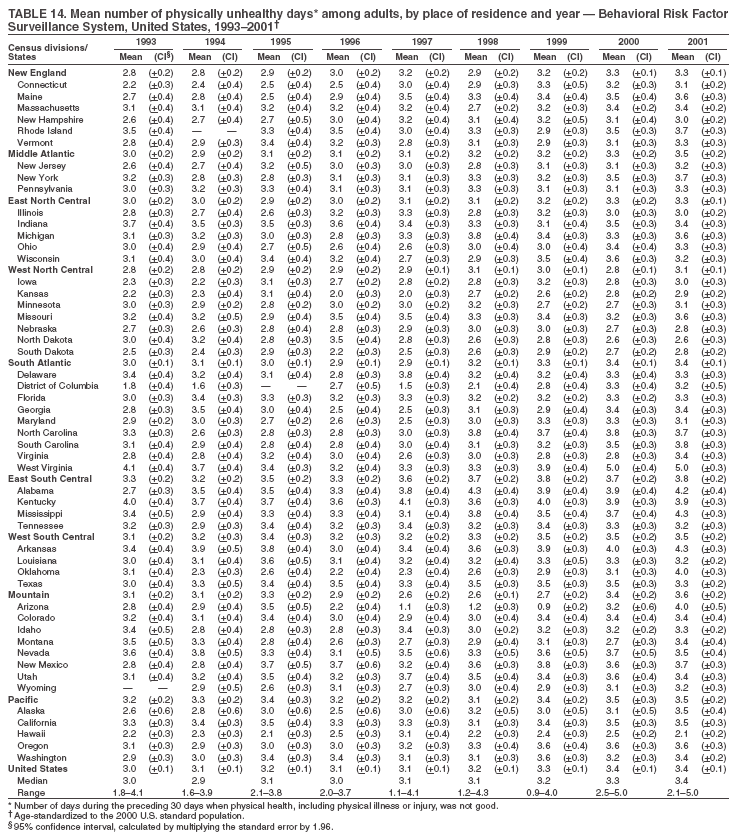 Return to top. Table 15 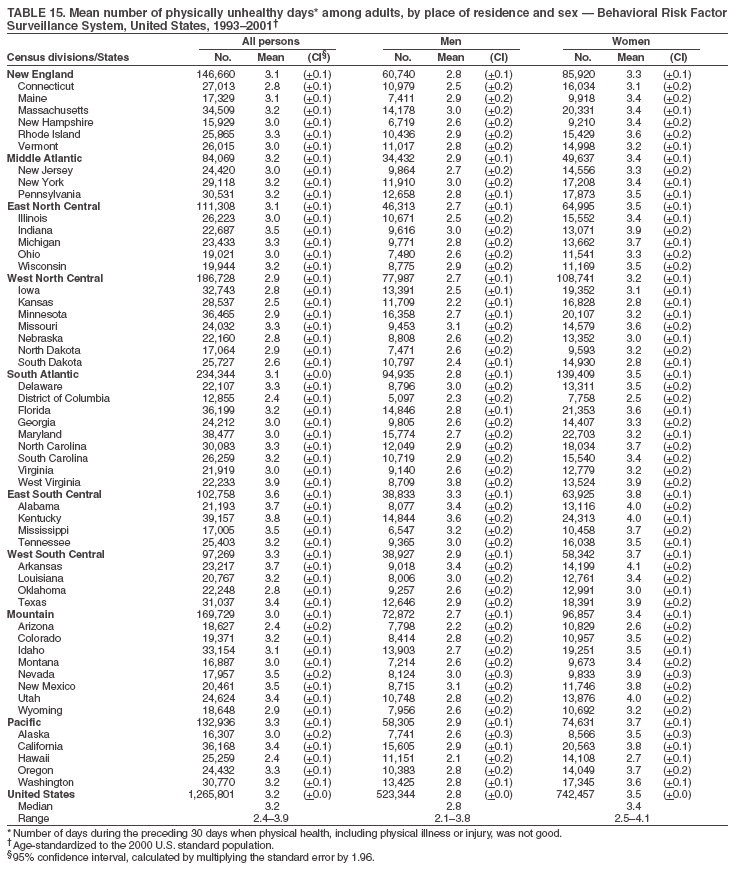 Return to top. Table 16  Return to top. Table 17 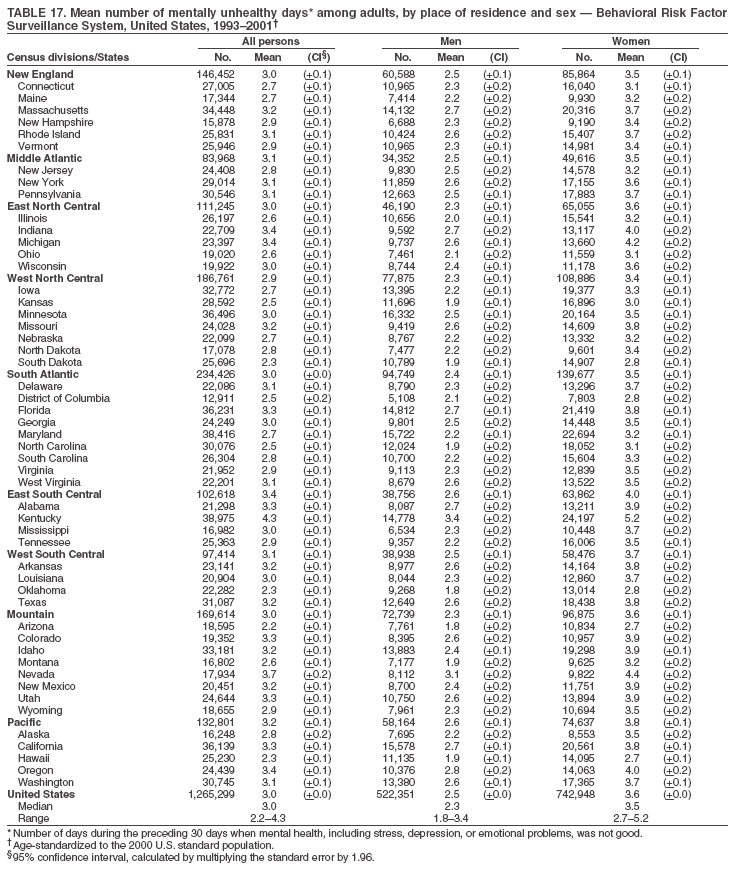 Return to top. Table 18  Return to top. Table 19 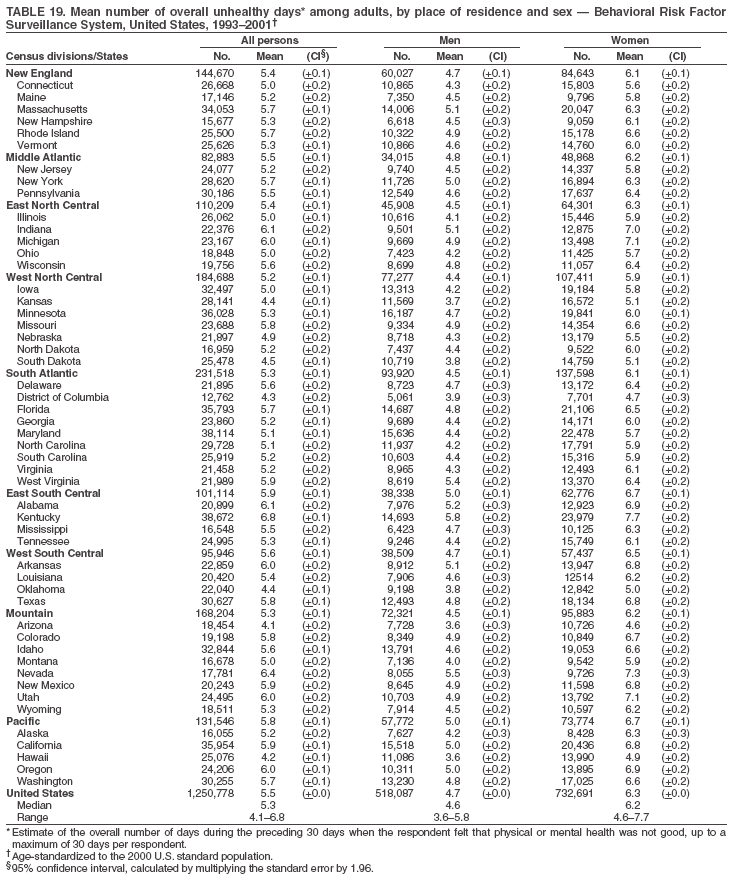 Return to top. Table 20  Return to top. Table 21 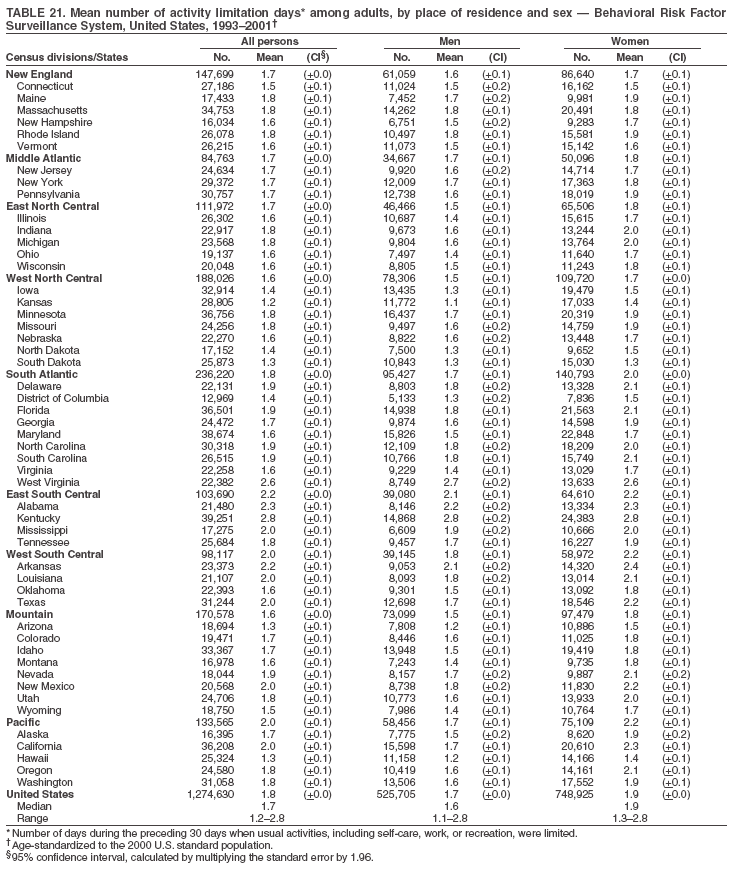 Return to top.
Disclaimer All MMWR HTML versions of articles are electronic conversions from ASCII text into HTML. This conversion may have resulted in character translation or format errors in the HTML version. Users should not rely on this HTML document, but are referred to the electronic PDF version and/or the original MMWR paper copy for the official text, figures, and tables. An original paper copy of this issue can be obtained from the Superintendent of Documents, U.S. Government Printing Office (GPO), Washington, DC 20402-9371; telephone: (202) 512-1800. Contact GPO for current prices. **Questions or messages regarding errors in formatting should be addressed to mmwrq@cdc.gov.Date last reviewed: 10/12/2005 |
|||||||||
|