 |
|
|
|
|
|
|
| ||||||||||
|
|
|
|
|
|
|
||||
| ||||||||||
|
|
|
|
|
Persons using assistive technology might not be able to fully access information in this file. For assistance, please send e-mail to: mmwrq@cdc.gov. Type 508 Accommodation and the title of the report in the subject line of e-mail. Surveillance for Sensory Impairment, Activity Limitation, and Health-Related Quality of Life Among Older Adults -- United States, 1993-1997Vincent A. Campbell, Ph.D.1 1Division of Birth Defects, Child Development, and Disability and Health Abstract Problem/Condition: Increases in life expectancy in the United States are accompanied by concerns regarding the cumulative impact of chronic disease and impairments on the prevalence of disability and the health status and quality of life of the growing number of older adults (defined as persons aged greater than or equal to 65 years). Although older adults are the focus of these surveillance summaries, persons aged 55-64 years have also been included, when data were available, as a comparison. One important public health goal for an aging society is to minimize the impact of chronic disease and impairments on the health status of older adults, maintain their ability to live independently, and improve their quality of life. This report examines three dimensions of health status: sensory impairments, activity limitations, and health-related quality of life among older adults. Reporting Period: This report examines data regarding activity limitations and sensory impairments for 1994 and health-related quality of life for 1993-1997. Description of System: The 1994 National Health Interview Survey (NHIS) Core, NHIS disability supplement (NHIS-D1), and the 1994 NHIS Second Supplement on Aging (SOA II) were used to estimate vision impairments, hearing loss, and activity limitation. Data from the Behavioral Risk Factor Surveillance System (BRFSS) for 1993 through 1997 were used to estimate two general measures of health-related quality of life: a) the prevalence of self-rated fair or poor general health and b) the number of days during the preceding 30 days when respondents reported their physical or mental health was "not good." Results: Sensory impairments are common among older adults. Among adults aged greater than or equal to 70 years, 18.1% reported vision impairments, 33.2% reported hearing impairments, and 8.6% reported both hearing and vision impairments. Although older adults who reported vision and hearing impairments reported more comorbidities than their nonhearing-impaired and nonvisually impaired peers, impaired adults with sensory loss were able to sustain valued social participation roles. Advancing age was associated with increased likelihood of difficulty in performing functional activities and instrumental and basic activities of daily living, regardless of race/ethnicity, sex, and region of residence in the United States. Unhealthy days (a continuous measure of population health-related quality of life) was consistent with self-rated health (a commonly used categorical measure) and useful in identifying subtle differences among sociodemographic groups of older adults. An important finding was that adults aged 55-64 years with low socioeconomic status (i.e., less than a high school education or an annual household income of less than $15,000) reported substantially greater numbers of unhealthy days than their peers aged 65-74 years. Interpretation: Sensory impairments are common in adults aged greater than or equal to 70 years, and prevalence of activity limitations among older adults is high and associated with advancing age. Health-related quality of life is less closely related to age, particularly when health-related quality of life includes aspects of mental health. INTRODUCTION Increases in life expectancy in the United States are accompanied by the cumulative impact of chronic disease and impairments on the prevalence of disability and the health status and quality of life among the growing number of older adults (1-3). Although declines in the prevalence of disability associated with chronic disease among older adults might have occurred, advancing age is associated with an increase in the number of health conditions that can lead to disability (4,5). Important public health goals for older adults include minimizing the impact of chronic disease and impairments on their health status, maintaining their ability to live independently, and improving their quality of life (6). This report examined three dimensions of health status: sensory impairments, activity limitations, and health-related quality of life (HRQOL) among older adults. METHODS Vision and Hearing Impairments Data from the 1994 National Health Interview Survey (NHIS) Core and the 1994 NHIS Second Supplement on Aging (SOA II) were used to estimate vision impairments, hearing loss, and activity limitation. NHIS is an ongoing, annual, cross-sectional household survey of the U.S. civilian, noninstitutionalized population (7). Whenever possible, all adult family members participate in the interview; proxy interviews are allowed, however, for elderly persons who are unable to participate because of illness or impairment. All respondents to the 1994 NHIS Core who were aged greater than or equal to 70 years were included in SOA II, regardless of disability status. All respondents to SOA II who reported a disability were also administered NHIS Disability Phase 1 Supplement (NHIS-D1). Vision impairment was defined as blindness in one eye, blindness in both eyes, or any other trouble seeing. SOA II has nine self-report items regarding vision, including questions concerning a) diagnoses of cataracts and glaucoma; b) blindness in one or both eyes; c) use of glasses; d) trouble seeing, even with glasses; and e) cataract surgery, lens implant, contact lenses, and use of magnifiers. A general question regarding "trouble seeing even with glasses" is also included in SOA II. Hearing impairment was defined as deafness in one ear, deafness in both ears, or any other trouble hearing. SOA II has six questions related to hearing loss, including self-reported deafness in one or both ears, any other trouble hearing, cochlear implant, and use of hearing aids. Data for 8,767 respondents who were aged greater than or equal to 70 years were included in the vision and hearing analyses. Estimates of vision and hearing impairments were made for the U.S. population aged greater than or equal to 70 years, by race (black, white, and other [Native American and Asian/Pacific Islander]), Hispanic or non-Hispanic ethnicity, sex, and region of residence in the United States*. Data were also available for activity of daily living and instrumental activity of daily living limitations, prevalence of selected chronic diseases, opportunities for social interaction, and self-rated health. Activity Limitations Data from the 1994 NHIS-D1 were used to estimate limitations in three areas of routine activity in the population aged greater than or equal to 55 years: functional activities, activities of daily living (ADL), and instrumental activities of daily living (IADL). Data were collected on all members of sampled households in face-to-face interviews; proxy responses were accepted when a household member could not be interviewed. The 1994 NHIS-D1 included questions regarding each respondent's ability to perform a) a set of basic functional activities (i.e., lifting, climbing stairs, walking, sustained standing, bending, reaching, and grasping); b) ADL (i.e., bathing, dressing, getting around inside the home, toileting, eating, and getting in and out of beds and chairs); and c) IADL (i.e., shopping, managing money, using the telephone, performing household chores, and preparing meals). Estimates of activity limitations in these three activity areas were made for the U.S. population aged greater than or equal to 55 years, grouped in 10-year intervals by race/ethnicity, sex, and region of residence in the United States. Data regarding 22,486 respondents were used for these estimates of activity limitations. Respondents were defined as having an activity limitation in basic functional activities, ADL, or IADL if they reported one or more difficulties in the activity area. Results were analyzed by age, race** Hispanic*** or non-Hispanic ethnicity, and sex. Native Americans and Asians/Pacific Islanders were categorized as other because of small age-group-specific sample sizes. Health-Related Quality of Life (HRQOL) Data from the Behavioral Risk Factor Surveillance System (BRFSS) for the years 1993-1997 were used to estimate a) the prevalence of self-reported fair or poor general health and b) the number of days during the preceding 30 days when respondents reported their physical or mental health was "not good". BRFSS is an ongoing, state-based, random-digit-dialed, telephone survey of U.S. civilian, noninstitutionalized persons aged greater than or equal to 18 years, which tracks health- and safety-related characteristics. This survey collects self-reported information on behaviors related to health status (with the understanding that self-reports can overestimate or underestimate the prevalence of certain behaviors). BRFSS data were weighted to reflect the age, sex, and race distribution of each state's estimated population for the year of the survey. State data were aggregated to produce nationwide estimates for the 50 states and the District of Columbia. From 1993 through 1997, BRFSS respondents were asked to rate their general health on a 5-point scale from "excellent" to "poor." Each respondent was asked, "Now, thinking about your physical health, which includes physical illness and injury, for how many days during the past 30 days was your physical health not good?" and "Now, thinking about your mental health, which includes stress, depression, and problems with emotions, for how many days during the past 30 days was your mental health not good?" Respondents were also asked questions regarding their sex, race/ethnicity, highest educational level, annual household income, occupational status, marital status, whether they had one or more of several chronic health conditions, and selected health behaviors and characteristics (e.g., being overweight or smoking). This report presents analyses of two measures of HRQOL that are among a set of 25 community health profile indicators recommended by the Institute of Medicine in a 1997 report (8). First, overall self-rated health was defined as a dichotomous variable indicating fair or poor self-rated health (1) or not (0). In addition, an unhealthy days index was derived by adding the responses from the two questions regarding the number of days during the preceding 30 days when the respondents' physical or mental health was not good, with the restriction that the unhealthy days index could not exceed 30 days. The minimal overlap assumption used in this index was found in other analyses to be the most reasonable and straight-forward approach for combining the mental and physical health measures. HRQOL prevalence data were collected from 1993 through 1997 from each of the 50 participating BRFSS states and the District of Columbia, except for Wyoming in 1993, Rhode Island in 1994, and the District of Columbia in 1995. To ensure adequate sample sizes for analyses of subpopulations (e.g., age and sex subgroup comparisons within each state), data for 1993 through 1997 were combined to complete these analyses. To account for the complex sample design of both NHIS and BRFSS, SUDAAN statistical software was used for analyses (9). Except where noted, response categories of "don't know/not sure," "refused," and categories indicating data were missing are excluded from analyses. Data were not reported when the standard error was greater than or equal to 30% of the prevalence estimate. RESULTS Vision Impairments Vision impairment, which is defined as blindness in one eye, blindness in both eyes, or any other trouble seeing, was reported by 18.1% of adults aged greater than or equal to 70 years, representing approximately 3.6 million persons (Table 1) (10). Men were less likely than women to report vision impairments, and adults in the northeast reported a lower frequency of vision impairments than other respondents. Blindness in both eyes was reported by 1.7% of adults aged greater than or equal to 70 years, and an additional 4.4% reported blindness in one eye (Table 2). Although all potential causes of vision impairments were not reported, 24.5% of older adults reported having a cataract, and 7.9% reported having glaucoma. Approximately 91.5% of respondents reported wearing glasses, 17.0% reported using a magnifier, and 15.1% reported having a lens implant to treat a cataract. Older adults who reported any vision impairment were compared with those who did not report vision impairments to determine whether either group was more likely to have certain activity limitations, comorbidities and secondary health conditions, and participation restrictions (Table 3). Older adults who had visual impairments reported substantial differences in activity limitations compared with those who did not report vision impairments. Older adults with vision impairments were more than twice as likely as older adults without vision impairments to report difficulty walking (43.3% versus 20.2%), difficulty getting outside (28.6% versus 10.4%), difficulty getting into and out of a bed or chair (22.1% versus 9.3%), difficulty managing medication (11.8% versus 4.4%), and difficulty preparing meals (18.7% versus 6.7%). Older adults who had vision impairments were more likely than sighted, older adults to have experienced falls during the preceding 12 months (31.2% versus 19.2%) and to have suffered a broken hip (7.1% versus 4.2%). Moreover, older adults who had vision impairments were more likely than sighted, older adults to have experienced hypertension (53.7% versus 43.1%), heart disease (30.2% versus 19.7%), stroke (17.4% versus 7.3%), and depression or anxiety (13.3% versus 7.0%). Unlike the findings for comorbidities and activity limitations, proportional differences in participation in selected social roles were small. Older adults who reported vision impairments were less likely than sighted, older adults to get together with friends (65.3% versus 72.5%) and less likely to go out to eat at a restaurant (55.7% versus 65.1%). Hearing Impairments Hearing impairment, which is defined as deafness in one ear, deafness in both ears, or any other trouble hearing, was reported by 33.2% of older adults, representing approximately 6.7 million persons in 1994 (Table 1). Women, blacks, and adults residing in the northeast were less likely than other respondents to report hearing loss. Deafness in both ears was reported by 7.3% of older adults, and an additional 8.3% reported deafness in one ear (Table 2). Whereas one third of the population reported hearing impairments, 11.6% (2,343,000 adults) reported using a hearing aid during the preceding 12 months. Of older adults, 0.1% reported having a cochlear implant. Older adults who had hearing loss also reported greater difficulties with functional activities than those without hearing impairments (Table 3). However, these activity limitations were not as extensive as those among older adults who had vision impairments. Approximately 30.7% of older adults with hearing loss reported difficulty walking, whereas 21.3% of those who did not report hearing loss had difficulty walking. In addition, older adults who reported hearing loss were more likely than those without hearing impairments to report difficulty getting outside (17.3% versus 12.0%), getting into and out of bed or a chair (15.1% versus 9.8%), and managing medication (7.7% versus 4.8%). Older adults with hearing impairments reported more occurrences of falls (28.4%) than those without hearing impairments (17.8%) and more occurrences of broken hips (5.4%) than those who did not report hearing impairments (4.4%). Also, older adults with hearing impairments were more likely than those without hearing impairments to report hypertension (46.7% versus 44.3%), heart disease (27.6% versus 18.6%), stroke (11.8% versus 7.8%), and depression (9.9% versus 7.2%). Difficulty with hearing was not associated with restriction in participation. Older adults with hearing impairments are only slightly less likely than those without hearing impairments to get together with friends (68.6% versus 72.4%). No substantial differences existed for eating at a restaurant or getting together with relatives. Hearing and Vision Impairments Approximately 1,724,000 adults (8.6%) of the population aged greater than or equal to 70 years reported both hearing and vision impairments (Table 1). Older adults who reported vision and hearing impairments were more than two times more likely than their peers without impairments to report difficulty walking (48.3% versus 22.2%), three times more likely to report difficulty getting outside (32.8% versus 11.9%), and almost two and one half times more likely to report difficulty getting into or out of bed or a chair (25.0% versus 10.4%). In addition, older adults who experienced both vision and hearing impairments were three times more likely than their peers without impairments to report difficulty preparing meals (20.7% versus 7.8%) and more likely to report difficulty managing medication (13.4% versus 5.0%). Furthermore, older adults who reported both vision and hearing loss were more likely than those without either vision or hearing impairments to have a) fallen during the preceding 12 months (37.4% versus 19.8%), b) broken a hip (7.6% versus 4.5%), c) reported a higher prevalence of hypertension (53.4% versus 44.3%), d) reported heart disease (32.2% versus 20.6%), and e) experienced a stroke (two times as likely) (19.9% versus 8.1%) (Table 3). Older adults who experienced both hearing and vision loss reported less participation in social activities (e.g., getting together with friends [63.4% versus 71.9%] or going out to a restaurant [55.8% versus 64.1%]) than their peers without impairments; both groups were equally likely to report getting together with relatives. Activity Limitations For adults aged greater than or equal to 55 years, limitations in basic functional skills were reported most frequently, followed by limitations in ADL and IADL (Table 4). The prevalence of limitation in all three areas of activity increased with advancing age. Among respondents aged greater than or equal to 85 years, 60.8% reported having difficulty with at least one functional activity. Blacks were more likely than whites to report more difficulties in all areas of activity and in all age groups. A higher percentage of women reported difficulty in the three activity areas and across all age groups. Data for Hispanics and non-Hispanics were comparable for prevalence of activity limitation at younger ages; however, Hispanics had a higher prevalence of activity limitation for adults aged greater than 75 years in ADL and IADL. In the analyses for Hispanics, the confidence intervals were broad, and results should be interpreted with caution. Activity limitation was most prevalent in the south for all three activity areas. Health-Related Quality of Life The overall percentages of adults aged greater than or equal to 55 years who reported fair or poor self-rated health increased substantially with increasing age. Among male respondents, 21.1% of those aged 55-64 years; 25.9%, 65-74 years; and 32.8%, greater than or equal to 75 years reported fair or poor health. Among female respondents, 20.8% of those aged 55-64 years; 26.5%, 65-74 years; and 34.4%, greater than or equal to 75 years reported fair or poor health (Table 5). Older black or Hispanic adults and adults who had less than a high school education, earned less than $15,000 annual household income, were unable to work, were without health-care coverage, lived in the south, reported diabetes mellitus or consistently high blood pressure, were underweight or overweight, were current smokers, or did not participate in leisure-time activities were consistently more likely than the overall group to report fair or poor health status. Men and women aged 55-64 years and 65-74 years were approximately equally as likely to report fair or poor health (Table 5). Women aged greater than or equal to 75 years were slightly more likely than men of the same age to report fair or poor health. The pattern of an increased prevalence of a fair or poor self-rated health status with increasing age also occurred in each state and the District of Columbia; the prevalence ranged from 12.9% to 36.3% for adults aged 55-64 years, from 19.9% to 42.2% for adults aged 65-74 years, and from 25.5% to 51.3% for adults aged greater than or equal to 75 years (Table 6). The mean number of reported unhealthy days in the preceding 30 days was the same for those aged 55-64 years and 65-74 years (5.6 days) but was higher for adults aged greater than or equal to 75 years (6.8 days) (Table 8). The mean number of unhealthy days was 1.1 days to 1.2 days higher for women than for men in each age group (Table 7). For each age and sex subgroup, adults reported having higher levels of unhealthy days than other respondents if they had less than a high school education or reported an annual household income of less than $15,000, an inability to work, nonparticipation in any physical activity during the preceding month, or not having health-care coverage. Respondents who had been told by a physician that they had diabetes, or that their blood pressure was higher than normal on two or more occasions, or who were current smokers, reported higher mean unhealthy days than other respondents. For each age group, women who reported having breast cancer also reported higher numbers of unhealthy days than those who did not report having breast cancer. Conversely, for each age group, adults who reported the lowest levels of unhealthy days also reported the following: having a college degree, having health-care coverage, having never smoked, having some level of physical activity, not having diabetes or hypertension, being currently employed, being a married man, being an overweight man**** *****, or being a normal-weight woman****. Some relations between the number of unhealthy days and characteristics of respondents were more complex (Table 7). For example, men and women who had less than a high school education reported the highest number of unhealthy days in the youngest age group (55-64 years) versus the two oldest age groups, whereas men and women who had college degrees reported progressively higher levels of unhealthy days with increased age. Similarly, adults who had annual household incomes of less than $15,000 reported a higher mean number of unhealthy days in the youngest age group (55-64 years) versus the two oldest age groups, whereas those who had annual household incomes of greater than or equal to $50,000 reported a progressively higher mean number of unhealthy days with increased age. Men and women who reported the fewest numbers of unhealthy days for each age and sex group resided in the midwest (aged 55-64 years), northeast (aged 65-74 years), and west (aged greater than or equal to 75 years). Men and women (aged 55-64 years) who resided in the west and men and women (aged 65-74 years and greater than or equal to 75 years) who resided in the south reported the highest mean number of unhealthy days for each age and sex group. At the state level (with the exception of Alaska and Tennessee), the mean number of unhealthy days reported by the oldest age group (greater than or equal to 75 years) was consistently higher than the mean number reported in the next oldest age group (65-74 years) (Table 8). However, differences in the mean number of unhealthy days between adults aged 55-64 years and aged 65-74 years were not statistically significant (p greater than or equal to 0.05) for most states. For each state and the District of Columbia, the mean number of unhealthy days for adults aged 55-64 years ranged from 3.4 days to 7.7 days; for adults aged 65-74 years, from 3.4 days to 7.2 days; and for adults aged greater than or equal to 75 years, from 4.4 days to 9.6 days (Table 8). For men and women aged greater than or equal to 65 years, a direct relation existed between their self-rated health status and mean number of unhealthy days (Figure); however, the numbers of mean unhealthy days were substantially smaller for those who reported excellent, very good, or good health status (range = 1.4 days-4.3 days) compared with the mean number of unhealthy days of respondents who reported a fair or poor health status (range = 9.1 days-22.9 days). Although separate analyses (not shown) indicated that most unhealthy days are attributed to days when physical health was not good versus when mental health was not good for adults aged greater than or equal to 65 years, a substantial percentage of these respondents (6.2%) reported greater than or equal to 2 weeks of recent poor mental health. DISCUSSION Chronic illnesses and their related activity limitations are a major health problem for older adults. These illnesses and limitations involve reduced functioning, cognitive impairments, depressive symptoms, the need for extended care, and burdensome health-care costs (11,12). Large declines have been reported in the proportions of older U.S. adults who are functionally impaired (13). However, preserving a good quality of life is as important as increasing life expectancy; the ability of older adults to function independently is a critically important public health issue (14). Vision and Hearing Impairments Compared with the information available regarding risk factors for specific diseases, few studies have examined risk factors for age-related functional decrements (15). Among older adults in communities, available research identified hearing and vision impairments as important risk factors that lead to functional decline and increased mortality as well as imbalance, hip fracture, and depression (16-24). Moreover, declining hearing and vision in older adults pose important challenges for families and family caregivers (25-27). This report examined the important relation between sensory loss and activity limitations. Sensory impairments are common among older adults. Eighteen percent of adults aged greater than or equal to 70 years reported blindness in one eye, blindness in both eyes, or any other trouble seeing; 33.2% reported hearing impairments, and 8.6% reported both hearing and vision impairments. Because these experiences are common, they are often overlooked or dismissed (28). Moreover, normal, age-related changes in hearing and vision might not be separated from abnormal sensory changes that can compromise function. In addition, both hearing and vision impairments are not visible disabilities, and both might lead to misdiagnosis or misunderstanding. Because vision and hearing occur on a continuum, discerning when a sensory impairment arises might be difficult. When changes in hearing and vision exceed normal age-related changes, they might begin to compromise the ability of an older adult to perform routine activities that define social roles and affect quality of life (29). In these analyses, a pattern occurred from examining the comorbidities and activity limitations among adults who reported hearing impairments, vision impairments, and both hearing and vision impairments. Older adults who had hearing impairments also reported more comorbidities than their nonhearing-impaired peers. Similarly, older adults who had vision impairments also reported more comorbidities and substantially more difficulty performing activities; those who reported both hearing and vision impairments reported increasingly greater comorbidities and greater difficulty performing activities. Despite the greater prevalence of functional impairments, these findings indicated that older adults who had sensory loss sustained valued social participation roles, although they had multiple activity limitations (30,31). Untangling the relation among sensory loss, comorbidities and secondary conditions, and activity limitations poses an important challenge for public health and the development of public policy. For example, regarding the relation between sensory limitations and activity limitations, more information is needed concerning the relation between underlying conditions, activity limitations, and secondary conditions. How do difficulty walking and difficulty getting outside affect the development of heart disease and hypertension among older persons with sensory impairments? How does difficulty preparing meals affect the nutrition of older persons who have problems seeing and hearing? Regarding the relation between activity limitations and environment, more information is needed concerning the effect of environmental accommodations or supports on the ability of adults with sensory impairments to live independently. For example, would the presence of sidewalks and larger print size on medicine bottles make a difference in the general health and independence of older adults with vision impairments? How does environmental noise hinder older adults from understanding conversation? Finally, more information is needed regarding the strategies that many older adults who have a disability employ to sustain participation in the community. Activity Limitations Advancing age is associated with increased likelihood of limitation in functional activities, ADLs, and IADLs, regardless of demographic and geographic factors (32-34). In all three activity domains, the differences that occurred between men and women as age increased support earlier reports of higher prevalence of limitation for women and higher mortality for men (34). The racial disparity in prevalence of limitations in functional activities, ADLs, and IADLs is similar to those noted by other researchers (35). Reduction in ability to perform functional activities, ADLs, and IADLs are associated with an increased need for social services and medical care (34). Despite reports that indicate that the prevalence of limitations is decreasing (13), increases in the absolute number of adults who experience limitation in activities will have substantial effects on the service delivery and health-care systems and on the demand for institutionalization (34). The concept of what constitutes a disability continues to evolve (3). The World Health Organization is revising its International Classification of Impairments, Disabilities, and Handicaps report and will emphasize the role of environmental factors in mitigating or exacerbating the effect of activity limitations in daily life (36,37). Regarding activity limitations, population estimates were analyzed for three broad areas (i.e., functional activities, IADLs, and ADLs) related to independent living -- the major activity for adults aged greater than or equal to 65 years. Unfortunately, data regarding environmental factors were not available from NHIS. The extent to which environmental factors might affect the portion of the older adult population that is affected by limitations in functional activities, ADLs, or IADLs, is not addressed in this report. In addition, data were taken from the special disability supplement in the 1994 NHIS. Continued and improved monitoring of the older adult population requires that instruments (e.g., NHIS) include in the recurring core routine questions concerning specific activities and environmental factors that affect independent living. Health-Related Quality of Life Chronic health conditions and increased levels of activity limitations are associated with lower levels of HRQOL (38,39). Some efforts to improve the health of older adults by prevention and treatment of specific conditions have been successful but are difficult to evaluate because of problems of competing morbidity in this population (5). The best measures of HRQOL are believed to be each person's subjective experience (40). This report included two self-reported measures of overall health: a general rating of health status and an estimate of the number of days in the preceding 30 days when physical or mental health was perceived as not good. The direct relation between self-rated health and number of unhealthy days supported the validity of both measures for measuring HRQOL of older adults. Findings also indicated that older adults who reported either fair or poor self-rated health also reported substantially greater numbers of recent unhealthy days than those who reported excellent, very good, or good self-rated health. The number of unhealthy days for older adults -- as a continuous measure of both physical and mental health perception -- is a useful index for identifying vulnerable subpopulations. Previous analyses of the mental health component of unhealthy days suggested the importance of mental health to the quality of life of older adults and the potential value of prevention and treatment of psychiatric disorders in this population (38,41). A consistent relation exists between the mean number of unhealthy days and socioeconomic characteristics that have been associated with increased disease, disability, and mortality (e.g., unemployment and lower levels of income and education), and this finding confirmed earlier findings in a general adult population study (42). Both men and women in their preretirement years (aged 55-64 years) who had the least education and lowest annual household income reported higher numbers of unhealthy days than their counterparts with the least education and lowest annual household income reported in the two older age groups. This finding was in contrast to age-associated increases in the mean number of unhealthy days for the highest socioeconomic status(SES) groups (i.e., college graduates and adults with annual household incomes of greater than or equal to $50,000) and produced a narrowing of HRQOL disparities with older age between the upper and lower SES groups. These findings might reflect health gains from improved access to health and social services when adults become eligible for Medicare, social security, and other retirement benefits. Researchers also found that respondents who said that they were unable to work reported substantially high levels of unhealthy days. This relation had also been observed among working-aged adults in other analyses of BRFSS data and has been documented as highly correlated at the state and county levels with 1990 U.S. Bureau of the Census estimates of severe work disability (43). This report has several limitations. NHIS is limited to the civilian, noninstitutionalized population and might underrepresent the oldest of the elderly, who are more likely to reside in institutions. Furthermore, reports could be provided by the reference person directly or by a proxy respondent. Of the 22,486 adults in the 1994 NHIS-D1 sample of adults aged greater than 54 years, 28.3% were proxy respondents. The 1994 SOA II has two limitations. First, the dataset does not include adults aged 65-69 years; this exclusion makes comparability with some cohorts more difficult because research concerning aging typically includes adults aged greater than or equal to 65 years. Second, questions regarding vision and hearing are limited because they do not address functional activities. Questions regarding the ability to read newspaper print, recognize a street sign, or hear conversation in a crowded room are generally more useful when activity limitation and participation are examined. BRFSS has several limitations. First, like NHIS, BRFSS is limited to the civilian, noninstitutionalized population and might underrepresent the oldest of the elderly, who are more likely to reside in institutions. Second, BRFSS does not include in the sampling frame adults who did not have telephones (i.e., approximately 5% of U.S. households) (44). However, differences in geographic and demographic characteristics of households with and without telephones were small according to one recent study, suggesting that this limitation might not limit generalizability (45). Third, BRFSS samples might include only small numbers in subgroups of particular interest (e.g., Native Americans or Asians/Pacific Islanders). Estimates for these subgroups were accurate but less precise than estimates for subgroups with larger numbers of respondents. Acknowledgment The authors thank Daniel Chapman, Ph.D., Epidemiologist, Division of Adult and Community Health, National Center for Chronic Disease Prevention and Health Promotion, CDC, for his assistance with data regarding the mental health status of older adults. References
* Northeast=Connecticut, Maine, Massachusetts, New Hampshire, New Jersey, New York, Pennsylvania, Rhode Island, and Vermont; Midwest=Illinois, Indiana, Iowa, Kansas, Michigan, Minnesota, Missouri, Nebraska, North Dakota, Ohio, South Dakota, and Wisconsin; South=Alabama, Arkansas, Delaware, District of Columbia, Florida, Georgia, Kentucky, Louisiana, Maryland, Mississippi, North Carolina, Oklahoma, South Carolina, Tennessee, Texas, Virginia, and West Virginia; and West=Alaska, Arizona, California, Colorado, Hawaii, Idaho, Montana, Nevada, New Mexico, Oregon, Utah, Washington, and Wyoming. ** Race/ethnicity data are presented only for non-Hispanic whites, non-Hispanic blacks, and Hispanics because sample sizes for other racial/ethnic groups were too small for meaningful analysis. *** Persons of Hispanic origin can be of any race. **** World Health Organization categories of body mass index. ***** The WHO category "overweight" is misleading because it does not include those who are very overweight (i.e., "obese"). Table 1 Note: To print large tables and graphs users may have to change their printer settings to landscape and use a small font size. TABLE 1. Percentage distribution of hearing and vision limitations among adults aged >=70 years, by selected sociodemographic characteristics -- United States, National Health Interview Second Supplement on Aging, 1994*
* Total population = 8,767. Source: National Center for Health Statistics, CDC, 1998. Data File Documentation, National Health Interview Second Supplement on Aging, 1994 (Machine-readable data file and documentation), National Center for Health Statistics, Hyattsville, MD. Return to top. Table 2 Note: To print large tables and graphs users may have to change their printer settings to landscape and use a small font size. TABLE 2. Percentage distribution of selected vision and hearing impairments among adults aged >=70 years -- United States, National Health Interview Second Supplement on Aging, 1994*
* Total population = 8,767. Source: National Center for Health Statistics, CDC, 1998. Data File Documentation, National Health Interview Second Supplement on Aging, 1994 (Machine-readable data file and documentation), National Center for Health Statistics, Hyattsville, MD. Return to top. Table 3 Note: To print large tables and graphs users may have to change their printer settings to landscape and use a small font size. TABLE 3. Selected comorbidities, secondary health conditions, and activity limitations among adults aged >=70 years who reported a vision and/or hearing impairment or no impairment -- National Health Interview Second Supplement on Aging, 1994*
* Total population = 8,767. Source: National Center for Health Statistics, CDC, 1998. Data File Documentation, National Health Interview Second Supplement on Aging, 1994 (Machine-readable data file and documentation), National Center for Health Statistics, Hyattsville, MD. Return to top. Table 4 Note: To print large tables and graphs users may have to change their printer settings to landscape and use a small font size. TABLE 4. Percentage of older adults with limitations in functional activities, activities of daily living, and instrumental activities of daily living, by selected sociodemographic characteristics -- United States, 1994*
* For all age groups, the total population for sections on region, sex, and race was 22,486; the sample size for 55-64 years was 8,945; 65-74 years, 8,013; 75-84 years, 4,396; and >=85 years, 1,132. Source: National Center for Health Statistics (1996). Data File Documentation, National Health Interview Survey of Disability, Phase I, 1994 (Machine readable data file and documentation), National Center for Health Statistics, Hyattsville, Maryland. Return to top. Table 5 Note: To print large tables and graphs users may have to change their printer settings to landscape and use a small font size. TABLE 5. Percentage of fair or poor self-rated health reported by older adults, by selected demographic and risk factors -- 50 states and the District of Columbia, Behavioral Risk Factor Surveillance System, 1993-1997*
* Total population = 178,846. The sample sizes are for known data regarding age, sex, and self-rated health status. Return to top. Table 6 Note: To print large tables and graphs users may have to change their printer settings to landscape and use a small font size. TABLE 6. Percentage of fair or poor self-rated health reported by older adults, by state and age -- 50 states and the District of Columbia, Behavioral Risk Factor Surveillance System, 1993-1997*
* Total population = 178,846. The sample sizes are for known data regarding age, sex, and self-rated health status. Return to top. Table 7 Note: To print large tables and graphs users may have to change their printer settings to landscape and use a small font size. TABLE 7. Mean number of unhealthy days during the preceding 30 days, by selected demographic and risk factors -- 50 states and the District of Columbia, Behavioral Risk Factor Surveillance System, 1993-1997*
* Total population = 171,620. The sample sizes are for known data regarding age, sex, and questions on unhealthy days. Return to top. Table 8 Note: To print large tables and graphs users may have to change their printer settings to landscape and use a small font size. TABLE 8. Mean number of unhealthy days during the preceding 30 days, by state and age -- 50 states and the District of Columbia, Behavioral Risk Factor Surveillance System, 1993-1997*
* Total population = 171,620. The sample sizes are for known data regarding age, sex, and questions on unhealthy days. Return to top. Figure 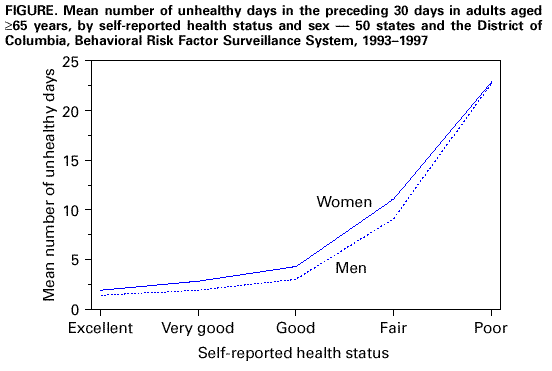 Return to top. Disclaimer All MMWR HTML versions of articles are electronic conversions from ASCII text into HTML. This conversion may have resulted in character translation or format errors in the HTML version. Users should not rely on this HTML document, but are referred to the electronic PDF version and/or the original MMWR paper copy for the official text, figures, and tables. An original paper copy of this issue can be obtained from the Superintendent of Documents, U.S. Government Printing Office (GPO), Washington, DC 20402-9371; telephone: (202) 512-1800. Contact GPO for current prices. **Questions or messages regarding errors in formatting should be addressed to mmwrq@cdc.gov.Page converted: 12/14/1999 |
|||||||||||||||||||||||||||||||||||||||||||||||||||||||||||||||||||||||||||||||||||||||||||||||||||||||||||||||||||||||||||||||||||||||||||||||||||||||||||||||||||||||||||||||||||||||||||||||||||||||||||||||||||||||||||||||||||||||||||||||||||||||||||||||||||||||||||||||||||||||||||||||||||||||||||||||||||||||||||||||||||||||||||||||||||||||||||||||||||||||||||||||||||||||||||||||||||||||||||||||||||||||||||||||||||||||||||||||||||||||||||||||||||||||||||||||||||||||||||||||||||||||||||||||||||||||||||||||||||||||||||||||||||||||||||||||||||||||||||||||||||||||||||||||||||||||||||||||||||||||||||||||||||||||||||||||||||||||||||||||||||||||||||||||||||||||||||||||||||||||||||||||||||||||||||||||||||||||||||||||||||||||||||||||||||||||||||||||||||||||||||||||||||||||||||||||||||||||||||||||||||||||||||||||||||||||||||||||||||||||||||||||||||||||||||||||||||||||||||||||||||||||||||||||||||||||||||||||||||||||||||||||||||||||||||||||||||||||||||||||||||||||||||||||||||||||||||||||||||||||
This page last reviewed 5/2/01
| |||||||||||||||||||||||||||||||||||||||||||||||||||||||||||||||||||||||||||||||||||||||||||||||||||||||||||||||||||||||||||||||||||||||||||||||||||||||||||||||||||||||||||||||||||||||||||||||||||||||||||||||||||||||||||||||||||||||||||||||||||||||||||||||||||||||||||||||||||||||||||||||||||||||||||||||||||||||||||||||||||||||||||||||||||||||||||||||||||||||||||||||||||||||||||||||||||||||||||||||||||||||||||||||||||||||||||||||||||||||||||||||||||||||||||||||||||||||||||||||||||||||||||||||||||||||||||||||||||||||||||||||||||||||||||||||||||||||||||||||||||||||||||||||||||||||||||||||||||||||||||||||||||||||||||||||||||||||||||||||||||||||||||||||||||||||||||||||||||||||||||||||||||||||||||||||||||||||||||||||||||||||||||||||||||||||||||||||||||||||||||||||||||||||||||||||||||||||||||||||||||||||||||||||||||||||||||||||||||||||||||||||||||||||||||||||||||||||||||||||||||||||||||||||||||||||||||||||||||||||||||||||||||||||||||||||||||||||||||||||||||||||||||||||||||||||||||||||||||||||