|
|
|
|
|
|
|
| ||||||||||
|
|
|
|
|
|
|
||||
| ||||||||||
|
|
|
|
|
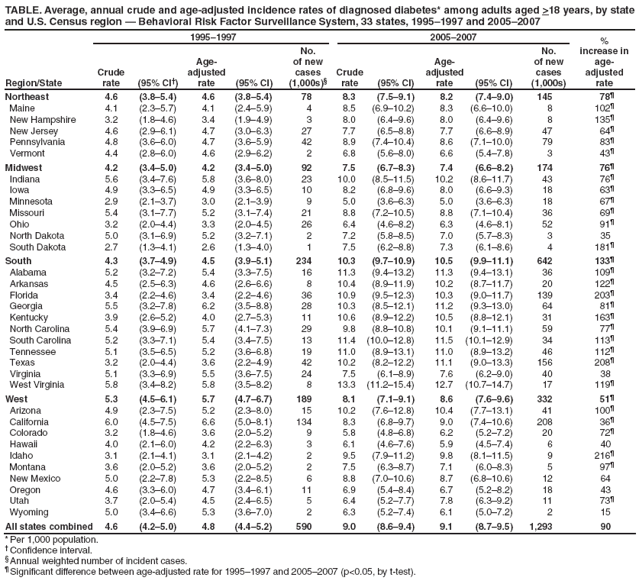
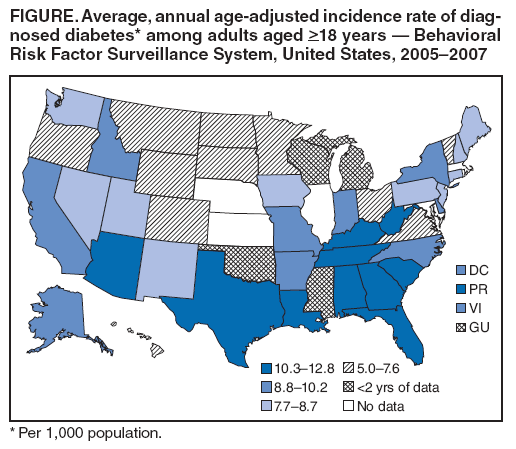
Persons using assistive technology might not be able to fully access information in this file. For assistance, please send e-mail to: mmwrq@cdc.gov. Type 508 Accommodation and the title of the report in the subject line of e-mail. State-Specific Incidence of Diabetes Among Adults --- Participating States, 1995--1997 and 2005--2007Diabetes is a major cause of morbidity and mortality in the United States (1), resulting in substantial human and economic costs (1,2). National survey data indicate that the incidence of diagnosed diabetes in the United States has increased rapidly and that obesity is a major predictor of diabetes incidence (3). However, data on diabetes incidence have not been analyzed by state. To assess the geographic distribution of diagnosed diabetes and to examine state-specific changes, CDC analyzed data from Behavioral Risk Factor Surveillance System (BRFSS) surveys for the periods 1995--1997 and 2005--2007. This report summarizes the results of that analysis, which indicated that, during 2005--2007, average, annual age-adjusted incidence of diabetes ranged from 5.0 to 12.8 per 1,000 persons among 40 participating states, the District of Columbia (DC), and two territories, with the greatest incidence observed in the South and Puerto Rico. In addition, among 33 participating states with data for both periods, the age-adjusted incidence of diabetes increased 90% from 4.8 per 1,000 in 1995--1997 to 9.1 in 2005--2007. Among persons at risk, diabetes can be prevented or delayed by moderate weight loss and increased physical activity (4,5). Development and delivery of interventions that result in weight loss and increased physical activity among those at risk are needed to halt the increasing incidence of diabetes in U.S. states. BRFSS is a state-based, random-digit--dialed, landline telephone survey of the U.S. civilian noninstitutionalized population aged >18 years and is conducted in all 50 states, DC, Guam, Puerto Rico, and the U.S. Virgin Islands. In the 1995 BRFSS survey, Council of American Survey and Research Organizations (CASRO) participant response rates* among states ranged from 48.6% to 84.5% (median: 68.5%), and cooperation rates† ranged from 50.9% to 84.6% (median: 71.4%). In 2007, CASRO response rates among states ranged from 26.9% to 65.4% (median: 50.6%), and cooperation rates ranged from 49.6% to 84.6% (median: 72.1%). State sample sizes for 1995--1997 ranged from 2,960 in New Mexico to 12,642 in Minnesota, and for 2005--2007 ranged from 7,091 in Alaska to 52,465 in Florida. Persons with diagnosed diabetes were defined as those who answered "yes" to the question, "Have you ever been told by a doctor that you have diabetes?" Women who had been told that they had diabetes only during pregnancy and respondents told they had prediabetes or borderline diabetes were classified as not having diabetes. Those with diagnosed diabetes were then asked at what age they were diagnosed. Duration of diagnosed diabetes was calculated by subtracting the age at diagnosis from current age. The number of incident cases of diagnosed diabetes was defined as those cases with duration of zero plus one half of the cases with duration of 1 year (3). To derive incidence rates, the number of incident cases was divided by the number of persons without diabetes plus the number of incident cases (3). Incidence was age adjusted according to the 2000 U.S. standard population and analyzed by state, territory, and U.S. Census region.§ Average annual incidence was calculated from the 3 years of data collected during 1995--1997 and the 3 years collected during 2005--2007; states with <2 years of data for each period were excluded. During 2005--2007, 40 participating states, DC, and two territories had >2 years of data; 33 participating states had >2 years of data for both periods. For the 33 states, incidence rates were compared using t-tests for significance. Data were weighted to respondents' probabilities of being selected and to age-, race-, and sex-specific populations from each state's annually adjusted census. Among the 40 states, DC, and two territories with >2 years of 2005--2007 data, the average annual incidence rate for 2005--2007 was 9.0 new cases of diabetes per 1,000 population (95% confidence interval [CI] = 8.6--9.4). By U.S. Census region, the average age-adjusted incidence was greatest in the South (10.5 per 1,000, CI = 9.9--11.1), followed by the Northeast (8.6, CI = 7.8--9.4), West (8.5, CI = 7.7--9.3), and Midwest (7.4, CI = 6.6--8.2). By state, age-adjusted incidence ranged from 5.0 per 1,000 population (CI = 3.6--6.3) in Minnesota to 12.8 (CI = 10.0--15.5) in Puerto Rico. The 10 states in the highest quartile of age-adjusted diabetes incidence (10.3--12.8 per 1,000 population) included nine of the 16 states in the South region: Alabama, Florida, Georgia, Kentucky, Louisiana, South Carolina, Tennessee, Texas, and West Virginia (Figure). The other state in the highest quartile was Arizona. For the 33 states with >2 years of data in both periods, age-adjusted incidence was 90% higher overall for 2005--2007 (9.1 per 1,000 population) compared with 1995--1997 (4.8) (Table). Age-adjusted incidence rates were significantly higher for 2005--2007 than for 1995--1997 in 27 of the 33 states (p<0.05). During 2005--2007, the states with the greatest number of annual new cases were California (approximately 208,000), Texas (156,000), and Florida (139,000). Reported by: KA Kirtland, PhD, YF Li, MPH, LS Geiss, MA, TJ Thompson, MS, Div of Diabetes Translation, National Center for Chronic Disease Prevention and Health Promotion, CDC. Editorial Note:This report is the first to provide state-specific incidence rates for diagnosed diabetes among adults and the first to describe geographic patterns in diabetes incidence. The findings indicate that the incidence of diagnosed diabetes has been particularly high in the South and the age-adjusted incidence for 33 states was 90% higher during 2005--2007 than during 1995--1997. These findings affirm previous projections that diabetes will continue to be a major public health problem (6). The 1995--1997 overall incidence of 4.8 per 1,000 for the 33 states is similar to a 1997 estimate of diabetes incidence (4.9 per 1,000) using National Health Interview Survey (NHIS) data (3). Although few diabetes incidence studies have been published, the state-based data in this report appear consistent with NHIS data indicating that the incidence of diabetes is increasing (3). Factors associated with an increased risk for diabetes included older age, lower educational attainment, physical inactivity, obesity, weight gain, and being categorized in a racial/ethnic minority population (3). Of these factors, obesity has been identified as a major risk factor in the increasing incidence of diabetes (3); the growth in diabetes prevalence has been concomitant with growth in obesity prevalence (7). The pattern of high incidence rates in the South is consistent with previously documented high prevalence of diabetes in this region.¶ The South also has high prevalences of modifiable risk factors for type 2 diabetes (90%--95% of all diabetes in the United States is type 2), including obesity (8) and physical inactivity (9). A recent study found the prevalence of obesity in 2007 was greatest in the South (27.3%) followed by the Midwest (26.5%), Northeast (24.4%), and West (23.1%) (8). Obesity prevalence exceeded 30% in three southern states: Alabama, Mississippi, and Tennessee. Similar regional patterns have been found for physical inactivity, for which the South had greater prevalence (17.4%), compared with the Northeast (15.7%), Midwest (14.1%), and West (11.2%) (9). Effective population-based approaches to prevent obesity and increase physical activity might help to reduce the incidence of diabetes. Efforts to prevent diabetes also should focus on persons at high risk for type 2 diabetes. In a study of persons at high risk, a 5%--10% reduction in body weight coupled with 30 minutes of moderate physical activity 5 days a week resulted in a 58% reduction in diabetes over a 3-year period (5). The findings in this report are subject to at least six limitations. First, because the diagnoses of diabetes did not distinguish between type 1 diabetes and type 2 diabetes and were self-reported by respondents, survey responses were subject to recall bias and misinterpretation. Second, BRFSS excludes certain populations, including those without landline telephones and those residing in institutions and on military bases, and thus might not be representative of the U.S. population. Third, because undiagnosed incidence of diabetes could not be assessed, diabetes incidence might have been underestimated. Fourth, the inability to detect significant increases in incidence in certain states might have resulted from small BRFSS sample sizes or small numbers of incident cases. Fifth, low 2007 BRFSS response rates for states such as New Jersey (26.9%) and Georgia (33.9%) might indicate potential for response bias. BRFSS weighting procedures partially correct for nonresponse.** However, the effect of low response rates remains uncertain. Finally, the effects of enhanced detection of diabetes on increased incidence could not be assessed. However, a study of diabetes prevalence trends suggested that enhanced case detection might be occurring among persons who are extremely obese, but not among those who are obese or not obese (10). Development and delivery of interventions that promote weight loss and increased physical activity among persons at high risk for diabetes are needed to reduce diabetes incidence. Also needed are public health interventions, including environmental and policy changes (e.g., creating or enhancing parks, walking trails, and access to healthier foods) that encourage healthy lifestyles and maintenance of healthy weight to prevent obesity (8) and reduce the risk for diabetes. Continued surveillance of diabetes incidence, risk factors, and prevention efforts is important to measure progress toward reducing the incidence of diabetes. References
* The percentage of persons who completed interviews among all eligible persons, including those who were not successfully contacted. † The percentage of persons who completed interviews among all eligible persons who were contacted. § West: Alaska, Arizona, California, Colorado, Hawaii, Idaho, Montana, Nevada, New Mexico, Oregon, Utah, Washington, and Wyoming; Midwest: Illinois, Indiana, Iowa, Kansas, Michigan, Minnesota, Missouri, Nebraska, North Dakota, Ohio, South Dakota, and Wisconsin; Northeast: Connecticut, Maine, Massachusetts, New Hampshire, New Jersey, New York, Pennsylvania, Rhode Island, and Vermont; and South: Alabama, Arkansas, Delaware, District of Columbia, Florida, Georgia, Kentucky, Louisiana, Maryland, Mississippi, North Carolina, Oklahoma, South Carolina, Virginia, West Virginia, Tennessee, and Texas. ¶ Available at http://apps.nccd.cdc.gov/ddt_strs2/nationaldiabetesprevalenceestimates.aspx. ** Additional information available at http://www.cdc.gov/brfss/technical_infodata/surveydata/2007.htm. Table
All MMWR HTML versions of articles are electronic conversions from typeset documents. This conversion might result in character translation or format errors in the HTML version. Users are referred to the electronic PDF version (http://www.cdc.gov/mmwr) and/or the original MMWR paper copy for printable versions of official text, figures, and tables. An original paper copy of this issue can be obtained from the Superintendent of Documents, U.S. Government Printing Office (GPO), Washington, DC 20402-9371; telephone: (202) 512-1800. Contact GPO for current prices. **Questions or messages regarding errors in formatting should be addressed to mmwrq@cdc.gov.Date last reviewed: 10/29/2008 |
|||||||||
|