|
|
|
|
|
|
|
| ||||||||||
|
|
|
|
|
|
|
||||
| ||||||||||
|
|
|
|
|
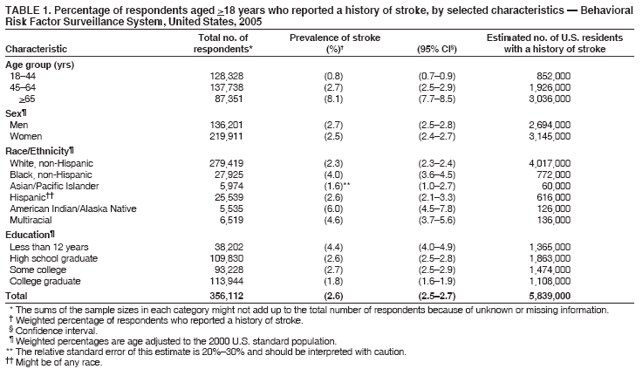
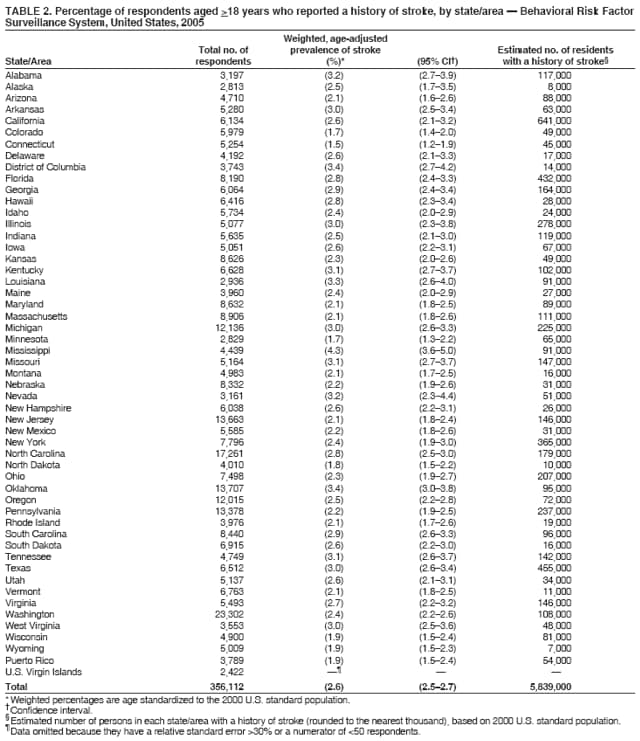
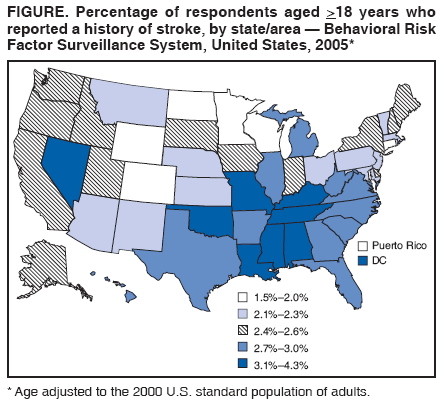
Persons using assistive technology might not be able to fully access information in this file. For assistance, please send e-mail to: mmwrq@cdc.gov. Type 508 Accommodation and the title of the report in the subject line of e-mail. Prevalence of Stroke --- United States, 2005Stroke is the third most common cause of death in the United States (1). Stroke also results in substantial health-care expenditures; the mean lifetime cost resulting from an ischemic stroke is estimated at $140,000 per patient (1). Nationwide, costs related to stroke are expected to reach an estimated $62.7 billion in 2007 (1). Stroke death rates are higher in the southeastern United States, compared with other regions of the country; blacks, American Indians/Alaska Natives (AI/ANs), Asians/Pacific Islanders, and Hispanics die from stroke at younger ages than whites (1--3). Regional and national data on self-reported stroke prevalence have been published previously (1,4); however, state-specific prevalence data for persons with a history of stroke have not. To provide national-level stroke prevalence estimates by age group, sex, race/ethnicity, and education level and overall prevalence estimates for each of the 50 states, the U.S. Virgin Islands (USVI), the District of Columbia (DC), and Puerto Rico, CDC analyzed data from the 2005 Behavioral Risk Factor Surveillance System (BRFSS) survey. This report summarizes the results of that analysis and provides the first state-based prevalence estimates of stroke. The results indicated that, in 2005, substantial differences existed in the prevalence of stroke by state/territory, race/ethnicity, age group, and education level. To lower the incidence of stroke and meet the Healthy People 2010 objective* to reduce stroke deaths (objective no. 12-7) and the overall goal to eliminate health disparities, public health programs should augment stroke risk-factor prevention and educational measures in disproportionately affected regions and populations. BRFSS is a state-based, random-digit_dialed telephone survey of the noninstitutionalized, U.S. civilian population aged >18 years and is administered by state health departments in collaboration with CDC. In 2005, the median response rate among states, based on Council of American Survey and Research Organizations guidelines, was 51.1% (range: 34.6%--67.4%). This rate accounts for the efficiency of the telephone sampling method used and participation rates among eligible respondents who were contacted. A total of 356,112 respondents from all 50 states, DC, Puerto Rico, and USVI participated in the survey. State (including DC) and territory sample sizes ranged from 2,422 (USVI) to 23,302 (Washington). The racial/ethnic national sample sizes ranged from 5,535 (AI/ANs) to 279,419 (whites). All prevalence estimates in this report have a numerator >50 and a relative standard error <30% to ensure that estimates are stable.† Survey respondents answered the question, "Has a doctor or other health professional ever told you that you had a stroke?" Differences in prevalence were assessed by age group, sex, race/ethnicity, education level, and state or territory of residence. Data were weighted to reflect the population aged >18 years in each state and territory and were age adjusted to the 2000 U.S. standard population to allow for more meaningful comparisons between states and between demographic groups. The weighted state prevalence values were used to estimate the number of persons with a history of stroke in various demographic groups and in each state or territory. Respondents provided racial/ethnic identification; those who identified themselves as multiracial were included in a separate category. In 2005, 2.6% (95% confidence interval [CI] = 2.5--2.7) of noninstitutionalized U.S. adults (approximately 5,839,000 persons) had a history of stroke (Table 1). The prevalence of stroke increased with age: 8.1% of respondents aged >65 years reported a history of stroke, compared with 0.8% of persons aged 18--44 years. The prevalence of stroke among men (2.7%) and women (2.5%) was similar. Among persons with less than 12 years of education, 4.4% reported a history of stroke, approximately twice the proportion among college graduates (1.8%). The overall prevalences of stroke among AI/ANs (6.0%), multiracial persons (4.6%), and blacks (4.0%) were higher than the prevalence among whites (2.3%). The prevalences of stroke among Asians/Pacific Islanders (1.6%) and Hispanics (2.6%) were similar to the prevalence among whites. The prevalence of stroke ranged from 1.5% in Connecticut to 4.3% in Mississippi (Table 2). States and territories with the highest prevalence of stroke had approximately twice the prevalence of those with the lowest (Figure). Wyoming, with an estimated state population of 509,000 in 2005, had the lowest estimated number of persons reporting a history of stroke (10,000); California, with an estimated population of approximately 36 million in 2005, had the highest (641,000). Reported by: JR Neyer, KJ Greenlund, PhD, CH Denny, PhD, NL Keenan, PhD, M Casper, PhD, DR Labarthe, MD, PhD, JB Croft, PhD, Div for Heart Disease and Stroke Prevention, National Center for Chronic Disease Prevention and Health Promotion, CDC. Editorial Note:This report provides the first state-based estimates of the prevalence of persons with a history of stroke in the United States. The results indicate that, in 2005, substantial differences existed in the prevalence of stroke by race/ethnicity, education level, and state/area of residence. The results also exhibit variation among states, with an approximately twofold difference between states with the highest and lowest prevalence estimates. The overall prevalence estimate of 2.6% and race/ethnicity-specific estimates in this report are comparable to previously published national stroke prevalence data (1). In addition, the finding that many states with high prevalence estimates are concentrated in the southeast corresponds to the high rates of stroke mortality observed in this region, which has been traditionally called the "stroke belt" (2). However, certain states (Illinois, Michigan, Missouri, Nevada, Texas, and West Virginia) in other U.S. regions also had prevalence estimates >3.0%, among the highest in the country. Two factors contribute to stroke prevalence: stroke incidence (i.e., new cases) and survival rates after cerebrovascular events. Data on stroke incidence and long-term survival are limited (5); thus, assessing the relative contribution of these two factors is difficult. Improved surveillance for stroke, including data to determine incidence, survival, and type of stroke, would be useful to better understand the causes of the disparities described in this report (5). Several studies have hypothesized that the geographic and racial/ethnic variation in stroke prevalence and mortality might be attributed to variation in the amounts of trace elements in the environment, inconsistencies in the accuracy of stroke vital statistics data, migration patterns, and differences in the prevalence of stroke risk factors (2,6,7). A simple explanation for the observed variations remains elusive; however, one likely explanation for the geographic variation in stroke prevalence described in this report is variation in the proportion of the population with risk factors for stroke and heart disease. In a 2003 BRFSS analysis, the prevalence of having two or more of the major, modifiable risk factors for stroke and heart disease (e.g., high blood pressure, high blood cholesterol levels, diabetes, current smoking, physical inactivity, or obesity) was above the median value of 36.0% in 18 of the 19 states/areas with the highest stroke prevalence estimates in this 2005 analysis (6). Reasons for the geographic variation in the prevalence of risk factors for stroke are complex and might be attributed to a combination of factors (e.g., cultural norms for diet and exercise, poverty and lack of economic opportunity, social isolation, and regional differences in access to health care and preventive services) (2). The geographic distribution of racial/ethnic groups alone does not account for the geographic variation in stroke mortality (2). To further define and explain the underlying causes of these differences, additional studies are needed, including small-area analyses, in-depth interviews, more precise prevalence estimates by race/ethnicity, quality-of-care assessments, and recorded health outcomes. One such study that is under way is the Reasons for Geographic and Racial Differences in Stroke Study (REGARDS), a national population-based, longitudinal study designed to determine the causes of excess mortality in the southeast United States and among blacks (7). As with the geographic variations in stroke prevalence, the disparities observed among racial/ethnic groups are likely attributed, in part, to differences in the proportion of these population groups with risk factors for stroke. For example, in a recent analysis, AI/AN men had a higher prevalence of hypertension and hypercholesterolemia than any other racial/ethnic group, and AI/AN men and women had the highest prevalence of obesity, current smoking, and diabetes (8). However, the AI/AN group is diverse, and national-level data on stroke incidence, prevalence, and mortality for AI/ANs are limited (3). Similarly, blacks have a much higher prevalence of hypertension and diabetes and are less likely to have blood pressure controlled or diabetes treated than whites (1). Risk factor information for the multiracial group is limited because the multiracial category has only recently been included in large, population-based analyses. The findings in this report are subject to at least four limitations. First, BRFSS data are based on self-reported information and are subject to recall bias and misinterpretation of the term "stroke." Differential recall of stroke or ability to report a history of stroke by telephone interview could affect the disease prevalence estimates. Despite this limitation, self-reported disease history is used routinely to provide stroke prevalence estimates (1,3,4). Second, BRFSS does not include persons living in nursing homes, prisons, military bases, or other institutions, populations whose inclusion might alter stroke prevalence estimates for the entire population. Third, BRFSS is limited to households with land-line telephones and does not include persons who do not have telephones or who use cellular telephones exclusively. Finally, the BRFSS response rate was low; however, the prevalence estimates are accurate when compared with other surveys and other modes of survey administration (e.g., in-person interviews) (9). CDC has formed local, state, national, and international partnerships to help control risk factors in susceptible populations, reduce the incidence of stroke, and achieve the nation's Healthy People 2010 health objectives. For example, the National Forum for Heart Disease and Stroke Prevention, which comprises nearly 80 organizations, is working toward implementing A Public Health Action Plan to Prevent Heart Disease and Stroke.§ In addition, the CDC State Heart Disease and Stroke Prevention Program funds health departments in 32 states and DC to support stroke prevention through education, strategies to change physical and social environments, and programs to help eliminate racial/ethnic disparities in stroke risk. CDC also funds 15 WISEWOMAN projects, which aim to prevent heart disease and stroke by providing low-income, underinsured, and uninsured women aged 40--64 years with opportunities for lifestyle interventions, referral services, and screening for chronic disease risk factors; approximately 12,000 women have received services through WISEWOMAN during the past 4 years. Since 2000, WISEWOMAN has identified approximately 5,783 cases of previously undiagnosed hypertension, 6,286 cases of undiagnosed high cholesterol, and 800 cases of undiagnosed diabetes.¶ Since 1999, REACH 2010, a program funded by the U.S. Department of Health and Human Services, has supported several community-based projects that target racial/ethnic groups disproportionately affected by certain diseases. For example, the Choctaw Nation Project in Oklahoma and the Chugachmiut Native Organization in Alaska were both developed to address the burden of heart disease and stroke among AI/ANs. In Louisiana, the Black Women's Health Imperative has provided access to clinical preventive services for nearly 4,000 persons and improved the recognition of risk factors for heart disease and stroke in the communities it serves.** The findings in this report indicate that, in 2005, the prevalence of stroke varied by education level, race/ethnicity, and state/territory. These data can help health planners (e.g., policy makers and public health officials) better target prevention resources to groups with disproportionately high stroke prevalence. The importance of preventing and controlling risk factors (e.g., high blood pressure, heart disease, atrial fibrillation, high blood cholesterol levels, diabetes, tobacco use, alcohol use, physical inactivity, and obesity) to reduce the risk for stroke is well-established (10). In communities, policies that reduce tobacco exposure and promote healthy living (e.g., better access to healthy foods, school and worksite health education, and environments that are safe for and conducive to physical activity) can contribute to the prevention of stroke and other cardiovascular diseases. Finally, measures that improve recognition of the early signs of stroke and timely access to emergency stroke care can minimize the effects of strokes. Acknowledgment The findings in this report are based on data provided by BRFSS state coordinators. References
* Additional information available at http://www.cdc.gov/dhdsp/library/hp2010/index.htm. † Information regarding BRFSS data and methods available at http://www.cdc.gov/brfss/technical_infodata/surveydata/2005.htm. § Additional information available at http://www.cdc.gov/dhdsp/library/action_plan/index.htm. ¶ Additional information available at http://www.cdc.gov/dhdsp/wisewoman.htm. ** Additional information about these and other programs available at http://www.cdc.gov/reach2010 and http://www.cdc.gov/dhdsp.
Table 1
Disclaimer All MMWR HTML versions of articles are electronic conversions from ASCII text into HTML. This conversion may have resulted in character translation or format errors in the HTML version. Users should not rely on this HTML document, but are referred to the electronic PDF version and/or the original MMWR paper copy for the official text, figures, and tables. An original paper copy of this issue can be obtained from the Superintendent of Documents, U.S. Government Printing Office (GPO), Washington, DC 20402-9371; telephone: (202) 512-1800. Contact GPO for current prices. **Questions or messages regarding errors in formatting should be addressed to mmwrq@cdc.gov.Date last reviewed: 5/17/2007 |
|||||||||
|