 |
|
|
|
|
|
|
| ||||||||||
|
|
|
|
|
|
|
||||
| ||||||||||
|
|
|
|
|
Persons using assistive technology might not be able to fully access information in this file. For assistance, please send e-mail to: mmwrq@cdc.gov. Type 508 Accommodation and the title of the report in the subject line of e-mail. Regional and Racial Differences in Prevalence of Stroke --- 23 States and District of Columbia, 2003Higher stroke mortality in the United States has long been evidenced among blacks and residents of southeastern states (1). A greater proportion of blacks live in the southeastern states that make up the so-called stroke belt than elsewhere in the country (2); however, variations in socioeconomic characteristics and risk factors have also been associated with disparities in stroke, and these variations have been associated with region and race (3). To more closely examine these associations, CDC analyzed data from the 2003 Behavioral Risk Factor Surveillance System (BRFSS) survey. This report describes the results of that analysis, which indicated that although the prevalence of stroke was higher in 10 southeastern states than in 13 other states and the District of Columbia (DC) and higher among blacks than among whites, differences in education level and certain risk factors (i.e., having diabetes or high blood pressure, smoking, and not having health-care coverage) might account for most of the differences in stroke prevalence by region and race. These findings reinforce the importance of primary and secondary prevention of known risk factors for stroke. BRFSS is a state-based, random-digit--dialed cross-sectional telephone survey of the U.S. civilian, noninstitutionalized population aged >18 years conducted in all 50 states, DC, and three U.S. territories. In the 2003 cardiovascular module of the BRFSS survey, data on stroke were collected from 109,629 respondents in 23 states and DC. Response rates ranged from 38.3% in Maryland to 64.6% in Nebraska; median response rate was 53.2%. A total of 6,086 respondents who had missing data for stroke, age, race, diabetes, high blood pressure, smoking status, or health-care coverage status were excluded from this analysis; also excluded were 7,945 respondents whose racial identity was other than black or white (and who might be of any ethnicity). The final sample consisted of 95,598 respondents. The 23 states were divided into two categories: southeastern and nonsoutheastern states. Ten states (Alabama, Arkansas, Georgia, Kentucky, Louisiana, Mississippi, North Carolina, South Carolina, Tennessee, and Virginia) were categorized as southeastern, and 13 states (Alaska, Colorado, Connecticut, Hawaii, Maine, Maryland, Minnesota, Montana, Nebraska, New York, North Dakota, Ohio, and West Virginia) plus DC were categorized as nonsoutheastern. Respondents were considered to have had a stroke if they answered "yes" to the question: "Has a doctor, nurse, or other health professional ever told you that you had a stroke?" Persons were considered to have diabetes if they answered "yes" to the question: "Have you ever been told by a doctor that you have diabetes?" They were considered to have high blood pressure if they reported having been told by a doctor, nurse, or other health professional that they had high blood pressure. Respondent smoking status was categorized as follows: never smoked (fewer than 100 cigarettes in lifetime), formerly smoked (at least 100 cigarettes in lifetime but not currently smoking), or currently smoke (smoked at least 100 cigarettes in lifetime and currently smoke every day or some days). Respondents were considered to have health-care coverage if they answered "yes" to the question: "Do you have any kind of health-care coverage, including health insurance, prepaid plans such as HMOs, or government plans such as Medicare?" Respondents were also asked about the highest grade or year of school they had completed and were placed into one of four education-level categories on the basis of their response: less than high school graduate, high school graduate, some college, and college graduate. Estimates of stroke prevalence were standardized to the sex and age distribution of the 2000 U.S. population. Logistic regression analysis was used to examine the independent effects of region and race on stroke prevalence after adjustments for other factors, expressed as adjusted odds ratios (AORs). Statistical software was used to account for the complex sampling design and to calculate standard errors and 95% confidence intervals (CIs). Of the 95,598 respondents in the study, 41,059 were southeastern whites, and 9,448 were southeastern blacks; 42,175 were nonsoutheastern whites, and 2,916 were nonsoutheastern blacks. Blacks represented 21.0% of the population in southeastern states and 10.5% of the population in nonsoutheastern states. Blacks had a lower mean age than their white counterparts both in southeastern states (42.0 years versus 46.7 years) and nonsoutheastern states (44.1 years versus 47.0 years). The highest age-adjusted prevalence of stroke was among southeastern blacks (3.4% [CI = 3.0%--3.9%]), followed by nonsoutheastern blacks (2.8% [CI = 2.1%--3.8%]), southeastern whites (2.5% [CI = 2.3%--2.7%]), and nonsoutheastern whites (1.8% [CI = 1.7%--2.0%]). Therefore, by race, prevalence of stroke was higher in the southeastern states than in the nonsoutheastern states and, within both groups of states, prevalence of stroke was higher among blacks than among whites. Among all participants, blacks had greater proportions in younger age groups and higher percentages of females than did whites (Table 1). Persons in the southeastern states had lower education levels than those in the nonsoutheastern states, and blacks had lower education levels than whites. Prevalence of diabetes and high blood pressure was higher in the southeastern states and among blacks; however, a higher percentage of blacks never smoked. Blacks and residents of southeastern states were less likely to have health-care coverage than were whites and residents of nonsoutheastern states (Table 1). The age- and sex-adjusted AOR comparing stroke prevalence among southeastern residents with prevalence among nonsoutheastern residents was 1.43 (CI = 1.26--1.61) (Table 2). After additional adjustment for race, the AOR was reduced to 1.37 (CI = 1.21--1.55). Finally, the AOR was calculated as 1.23 (CI = 1.08--1.40), a reduction of 47% from the age- and sex-adjusted AOR, after additional adjustment for five other factors (i.e., education level, having diabetes, having high blood pressure, smoking status, and having health-care coverage). The age- and sex-adjusted AOR comparing stroke prevalence among blacks in both regions with prevalence among whites in both regions was 1.61 (CI = 1.37--1.88). That AOR was reduced to 1.52 (CI = 1.29--1.78) after additional adjustment for region. Finally, the AOR comparing blacks and whites in both regions was reduced to 1.13 (CI = 0.96--1.33) when adjusted for all factors, a 79% reduction from the age- and sex-adjusted AOR. Reported by: A Richardson, MPH, Y Liao, MD, P Tucker, DrPH, Div of Adult and Community Health, National Center for Chronic Disease Prevention and Health Promotion, CDC. Editorial Note:The findings in this report indicate higher prevalence of stroke in 10 southeastern states than in 13 nonsoutheastern states and DC. Blacks living in the southeastern states had the highest prevalence of stroke. The greater proportion of blacks in the southeastern states accounted for some of the higher prevalence in this group of states. However, differences in education level and prevalence of risk factors such as diabetes and high blood pressure accounted for approximately half of the difference in stroke prevalence between southeasterners and nonsoutheasterners and approximately three fourths of the difference in prevalence between blacks and whites. These findings reinforce the importance of primary and secondary prevention of known risk factors (e.g., diabetes, high blood pressure, and smoking) for stroke. Stroke death rates have been higher in the southeastern region of the United States than in other regions for approximately 50 years (1); the 10 southeastern states in this report, plus Indiana, make up the stroke belt (4). The reasons for persistence of high stroke mortality in this region are not entirely known; in one study, socioeconomic status was not a major factor (5). In other studies, higher rates of high blood pressure, diabetes, smoking, and certain other stroke risk factors did not fully explain the higher stroke risk among residents of southeastern states (6). Regional variations might be attributable to risk factors other than those considered in this report, such as lower intake of animal protein, potassium, and calcium, and higher intake of sodium and grain-derived complex carbohydrates among residents of southeastern states (7). The findings in this report are subject to at least three limitations. First, because BRFSS data are collected through a cross-sectional telephone survey, institutionalized persons and persons not able to answer questions because of stroke-related disability were not included. This exclusion might result in underestimates of the stroke burden and create certain biases in survey data. Second, although 10 of the 11 previously named stroke belt states (all except Indiana) were included in this report as the southeastern states, the 13 nonsoutheastern states plus DC might not be representative of the entire remainder of the United States. This analysis also did not include certain states with a high stroke mortality (e.g., Washington and Oregon) that have been described as the new "satellites" of the stroke belt (8). Finally, because the prevalence of stroke is estimated at only 2%--4% in the general population, not enough stroke patients were among survey participants to permit the analyses by age group performed in previous studies (9,10). This report confirms that blacks and others residing in the southeastern United States are disproportionately affected by stroke. Other attempts have been made to understand the elevated stroke risk among blacks. A report based on data from the first National Health and Nutrition Examination Survey Epidemiologic Follow-up Study determined that the risk for cerebral infarction among black persons aged 34--44 years compared with whites in the same age group attenuated only from 2.6 to 2.1 after accounting for differences in demographic, education, and stroke risk factors (9). In an analysis of data from the Atherosclerosis Risk in Communities cohort, blacks aged 45--64 years still had a 38% greater risk for stroke than whites even after accounting for established risk factors (10). While researchers examine causes for this excess stroke burden, programs to prevent stroke should continue to focus on disproportionately affected regions (e.g., southeastern states) and disproportionately affected subpopulations (e.g., blacks) and prevention of known risk factors for stroke. References
Table 1 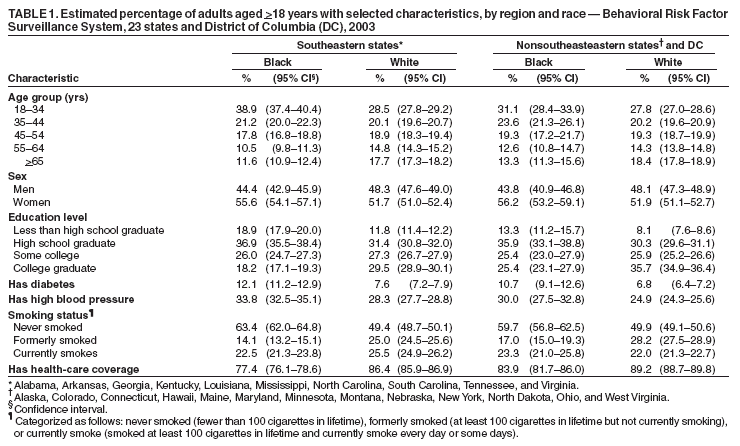 Return to top. Table 2 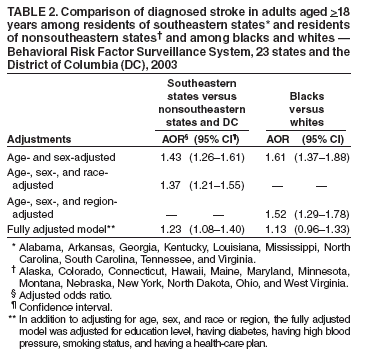 Return to top.
Disclaimer All MMWR HTML versions of articles are electronic conversions from ASCII text into HTML. This conversion may have resulted in character translation or format errors in the HTML version. Users should not rely on this HTML document, but are referred to the electronic PDF version and/or the original MMWR paper copy for the official text, figures, and tables. An original paper copy of this issue can be obtained from the Superintendent of Documents, U.S. Government Printing Office (GPO), Washington, DC 20402-9371; telephone: (202) 512-1800. Contact GPO for current prices. **Questions or messages regarding errors in formatting should be addressed to mmwrq@cdc.gov.Date last reviewed: 5/18/2005 |
|||||||||
|