|
|
|
|
|
|
|
| ||||||||||
|
|
|
|
|
|
|
||||
| ||||||||||
|
|
|
|
|
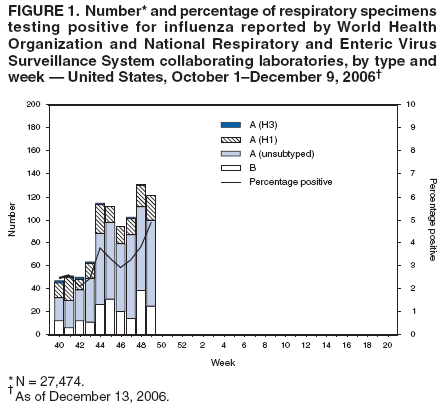
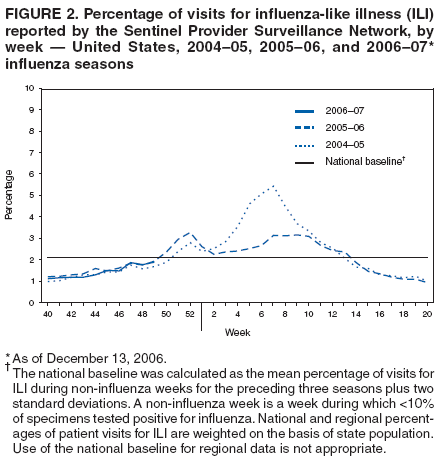
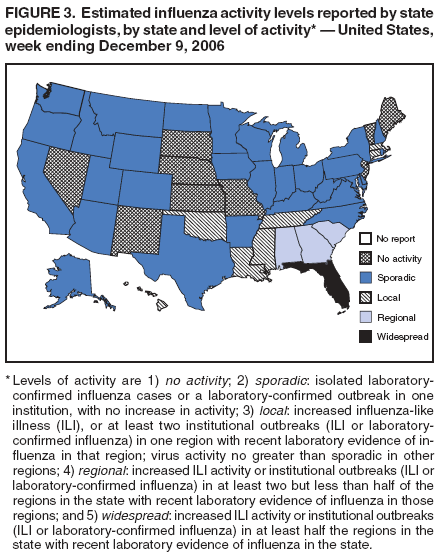
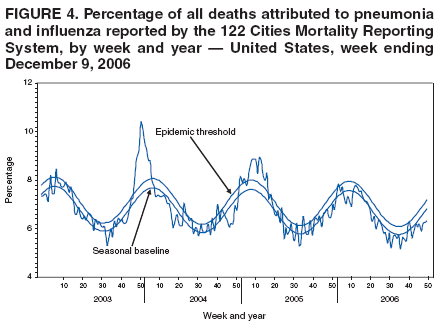
Persons using assistive technology might not be able to fully access information in this file. For assistance, please send e-mail to: mmwrq@cdc.gov. Type 508 Accommodation and the title of the report in the subject line of e-mail. Update: Influenza Activity --- United States, October 1--December 9, 2006During October 1--December 9, 2006, influenza activity remained low in the United States overall but increased in southeastern states. This report summarizes U.S. influenza activity* since October 1, the beginning of the 2006--07 influenza season, and updates the previous summary (1). Viral SurveillanceDuring October 1--December 9, 2006,† the World Health Organization (WHO) and National Respiratory and Enteric Virus Surveillance System collaborating laboratories in the United States tested 27,474 specimens for influenza viruses, and 884 (3.2%) were positive (Figure 1). Of these, 689 (77.9%) were influenza A viruses and 195 (22.1%) were influenza B viruses. A total of 171 (24.8%) of the 689 influenza A viruses were subtyped; 162 (94.7%) of these were influenza A (H1) viruses, and nine (5.3%) were influenza A (H3) viruses. Influenza-positive tests were reported from 37 states in all nine surveillance regions; 441 (49.9%) of the 884 positive tests were reported from Florida. Antigenic CharacterizationStates are requested to submit a subset of their influenza isolates to CDC for further antigenic characterization. Since October 1, 2006, CDC has antigenically characterized 28 influenza viruses collected and submitted by U.S. laboratories, including 10 influenza A (H1) isolates from six states, one influenza A (H3) isolate, and 17 influenza B viruses from four states. Eight of the 10 influenza A (H1) viruses were characterized as A/New Caledonia/20/99-like, the influenza A (H1) component of the 2006--07 influenza vaccine, and two showed reduced titers with ferret antisera produced against A/New Caledonia/20/99. The influenza A (H3) virus was characterized as A/Wisconsin/67/2005-like, the influenza A (H3) component of the 2006--07 influenza vaccine. Influenza B viruses currently circulating can be divided into two antigenically distinct lineages represented by B/Victoria/02/87 and B/Yamagata/16/88. The influenza B component of the 2006--07 influenza vaccine is B/Ohio/01/2005, which belongs to the B/Victoria lineage of viruses. Six (35.3%) of the 17 influenza B viruses characterized belong to the B/Victoria lineage of viruses; three were similar to B/Ohio/01/2005, and three had reduced titers with antisera produced against B/Ohio/01/2005. Eleven (64.7%) of the 17 influenza B viruses characterized belong to the B/Yamagata lineage of viruses. Nine (81.8%) of the 11 influenza B/Yamagata viruses were received from a single state. Influenza-Like Illness (ILI) SurveillanceDuring the current influenza surveillance season, weekly percentages of patient visits for ILI§ reported by approximately 1,300 U.S. sentinel providers in 50 states, New York City, Chicago, and the District of Columbia have ranged from 1.1% to 1.9%. During the week ending December 9, the percentage of patient visits for ILI was 1.9%, which is below the national baseline of 2.1%¶ (Figure 2). Two regions have reported ILI above their region-specific baselines this season. For the week ending December 9, the East South Central region reported that 2.6% of patient visits were for ILI, compared with its baseline of 2.4%; the West South Central region reported 3.2%, compared with its baseline of 3.0%. These reports marked the second week that the East South Central region has been at or above baseline and the fifth consecutive week for the West South Central region. State-Specific Activity LevelsDuring the week ending December 9, 2006, influenza activity was reported as widespread** in one state (Florida) (Figure 3). In addition, three states reported regional activity (Alabama, Georgia, and South Carolina); seven states reported local activity (Connecticut, Hawaii, Louisiana, Massachusetts, Mississippi, Oklahoma, and Tennessee); New York City and 30 states reported sporadic activity (Alaska, Arizona, Arkansas, California, Colorado, Delaware, Kentucky, Idaho, Illinois, Indiana, Iowa, Maryland, Michigan, Minnesota, Montana, New Hampshire, New York, North Carolina, North Dakota, Ohio, Oregon, Pennsylvania, Rhode Island, Texas, Utah, Virginia, Washington, West Virginia, Wisconsin, and Wyoming); and the District of Columbia and nine states reported no activity (Kansas, Maine, Missouri, Nebraska, Nevada, New Jersey, New Mexico, South Dakota, and Vermont). Regional influenza activity was reported for the first time this season during week 44 (by North Carolina), and widespread activity was reported for the first time during week 47 (by Alabama). To date this season, regional or widespread influenza activity has been reported by only six states (Alabama, Florida, Georgia, Mississippi, North Carolina, and South Carolina), all in the southeastern area of the country. Influenza outbreaks have been reported by Alabama, Florida, and North Carolina, with most cases occurring among children. Influenza-Associated Pediatric HospitalizationsPediatric hospitalizations associated with laboratory-confirmed influenza infections are monitored by two population-based surveillance networks, the Emerging Infections Program (EIP) and the New Vaccine Surveillance Network (NVSN). No influenza-associated pediatric hospitalizations have been reported from either network yet this season.†† Pneumonia- and Influenza-Related MortalityFor the reporting week December 3--9, 2006, pneumonia and influenza (P&I) was listed as an underlying or contributing cause of death for 6.3% of all deaths reported through the 122 Cities Mortality Reporting System (Figure 4). During the current influenza season, the weekly percentage of deaths attributed to P&I has ranged from 5.6% to 6.3% and has not exceeded the epidemic threshold for any week.§§ Influenza-Related Pediatric MortalityNo influenza-related pediatric deaths have been reported through the National Notifiable Diseases Surveillance System for the 2006--2007 influenza season. Reported by: WHO Collaborating Center for Surveillance, Epidemiology, and Control of Influenza. L Blanton, MPH, L Brammer, MPH, S Wang, MPH, A Postema, MPH, T Wallis, MS, D Shay, MD, J Bresee, MD, A Klimov, PhD, N Cox, PhD, Influenza Div, National Center for Immunization and Respiratory Diseases (proposed), CDC. Editorial Note:During October 1--December 9, 2006, the United States experienced a low level of influenza activity. Widespread and regional activity was reported in only six states in the southeastern area of the country. Outbreaks were reported primarily among children in Alabama, Florida, and North Carolina. Influenza virus isolates have been reported in all nine surveillance regions in the United States. Patient visits for ILI, represented by the Sentinel Provider Surveillance Network, and P&I mortality, represented by the 122 Cities Mortality Reporting System, have not exceeded national baseline levels. In addition, no influenza-associated hospitalizations from the EIP or NVSN surveillance systems have been reported to CDC and no influenza-related pediatric deaths have been reported through the National Notifiable Diseases Surveillance System. Vaccination is the best method for prevention of influenza and its potentially severe complications. Although the optimal months for influenza vaccination are October and November, vaccination in December and beyond is recommended because influenza activity peaks in January or later during most seasons (2). The degree of antigenic match between the current vaccine strains and strains that will circulate this season will be determined as more strains become available for analysis. To date, influenza A (H1) viruses have been reported most frequently, and the majority of influenza A (H1) viruses characterized are well matched by the vaccine. Influenza vaccine can be administered to any person who wants to reduce the likelihood of becoming ill with influenza. Annual influenza vaccination is particularly targeted toward persons at increased risk for influenza-related complications and severe disease (e.g., children aged 6--59 months, pregnant women, persons aged >50 years, and persons aged 6 months--49 years with certain chronic medical conditions) and their close contacts (e.g., health-care workers and household contacts of persons at increased risk, including contacts of children aged <6 months) (2). In addition, all children aged 6 months to <9 years who have not been previously vaccinated at any time should receive 2 doses of influenza vaccine (2). Vaccine should be offered throughout the influenza season, even after influenza activity has been documented in the community. Influenza surveillance reports for the United States are posted online weekly during October--May and are available at http://www.cdc.gov/flu/weekly/fluactivity.htm. Additional information regarding influenza viruses, influenza surveillance, the influenza vaccine, and avian influenza is available at http://www.cdc.gov/flu. Acknowledgments This report is based on data contributed by participating state and territorial health departments and state public health laboratories, WHO collaborating laboratories, National Respiratory and Enteric Virus Surveillance System collaborating laboratories, the U.S. Influenza Sentinel Provider Surveillance System, the New Vaccine Surveillance Network, the Emerging Infections Program, and the 122 Cities Mortality Reporting System. References
* The CDC influenza surveillance system has seven components: 1) World Health Organization and National Respiratory and Enteric Virus Surveillance System collaborating laboratories, 2) U.S. Influenza Sentinel Provider Surveillance Network, 3) state and territorial epidemiologist reports, 4) 122 Cities Mortality Reporting System, 5) Emerging Infections Program, 6) New Vaccine Surveillance Network, and 7) influenza-associated pediatric mortality reports. † As of December 13, 2006; reporting is incomplete. § Defined as a temperature of >100.0ºF (>37.8ºC), oral or equivalent, and cough and/or sore throat, in the absence of a known cause other than influenza. ¶ The national and regional baselines are the mean percentage of visits for ILI during non-influenza weeks for the previous three seasons plus two standard deviations. A non-influenza week is a week during which <10% of specimens tested positive for influenza. National and regional percentages of patient visits for ILI are weighted on the basis of state population. Use of the national baseline for regional data is not appropriate. ** Levels of activity are 1) no activity; 2) sporadic: isolated laboratory-confirmed influenza cases or a laboratory-confirmed outbreak in one institution, with no increase in activity; 3) local: increased ILI, or at least two institutional outbreaks (ILI or laboratory-confirmed influenza) in one region with recent laboratory evidence of influenza in that region; virus activity no greater than sporadic in other regions; 4) regional: increased ILI activity or institutional outbreaks (ILI or laboratory-confirmed influenza) in at least two but less than half of the regions in the state with recent laboratory evidence of influenza in those regions; and 5) widespread: increased ILI activity or institutional outbreaks (ILI or laboratory-confirmed influenza) in at least half the regions in the state with recent laboratory evidence of influenza in the state. †† NVSN conducts surveillance in Monroe County, New York; Hamilton County, Ohio; and Davidson County, Tennessee. NVSN provides population-based estimates of laboratory-confirmed influenza hospitalization rates in children aged <5 years admitted to NVSN hospitals with fever or respiratory symptoms. Children are prospectively enrolled, and respiratory samples are collected and tested by viral culture and reverse transcription--polymerase chain reaction (RT-PCR). EIP conducts surveillance in 60 counties associated with 12 metropolitan areas: San Francisco, California; Denver, Colorado; New Haven, Connecticut; Atlanta, Georgia; Baltimore, Maryland; Minneapolis/St. Paul, Minnesota; Albuquerque, New Mexico; Las Cruces, New Mexico; Albany, New York; Rochester, New York; Portland, Oregon; and Nashville, Tennessee. EIP conducts surveillance for laboratory-confirmed, influenza-related hospitalizations in persons aged <18 years. Hospital laboratory and admission databases and infection-control logs are reviewed to identify children with a positive influenza test (i.e., viral culture, direct fluorescent antibody assays, RT-PCR, or a commercial rapid antigen test) from testing conducted as a part of their routine care. §§ The seasonal baseline proportion of P&I deaths is projected using a robust regression procedure in which a periodic regression model is applied to the observed percentage of deaths from P&I that were reported by the 122 Cities Mortality Reporting System during the preceding 5 years. The epidemic threshold is 1.645 standard deviations above the seasonal baseline.
Figure 1
Disclaimer All MMWR HTML versions of articles are electronic conversions from ASCII text into HTML. This conversion may have resulted in character translation or format errors in the HTML version. Users should not rely on this HTML document, but are referred to the electronic PDF version and/or the original MMWR paper copy for the official text, figures, and tables. An original paper copy of this issue can be obtained from the Superintendent of Documents, U.S. Government Printing Office (GPO), Washington, DC 20402-9371; telephone: (202) 512-1800. Contact GPO for current prices. **Questions or messages regarding errors in formatting should be addressed to mmwrq@cdc.gov.Date last reviewed: 12/20/2006 |
|||||||||
|