 |
|
|
|
|
|
|
| ||||||||||
|
|
|
|
|
|
|
||||
| ||||||||||
|
|
|
|
|
Persons using assistive technology might not be able to fully access information in this file. For assistance, please send e-mail to: mmwrq@cdc.gov. Type 508 Accommodation and the title of the report in the subject line of e-mail. Update: Influenza Activity --- United States and Worldwide, May 21--September 9, 2006During May 21--September 9, 2006, influenza A(H3), influenza A(H1), and influenza B viruses cocirculated worldwide and were identified sporadically in North America. This report summarizes influenza activity in the United States and worldwide since the last MMWR update (1). United StatesIn the United States, CDC uses seven systems for national influenza surveillance (2), four of which operate year-round: 1) the World Health Organization (WHO) and the National Respiratory and Enteric Virus Surveillance System (NREVSS) collaborating laboratory systems; 2) the U.S. Influenza Sentinel Provider Surveillance System; 3) the 122 Cities Mortality Reporting System; and 4) a national surveillance system that records pediatric deaths associated with laboratory-confirmed influenza. Data from these four systems are included in this report. During May 21--September 9,* WHO and NREVSS collaborating laboratories in the United States tested 14,751 respiratory specimens; 318 (2%) were positive for influenza (Figure). Of the positive results, 208 (65%) were influenza B viruses, 58 (18%) were influenza A (H1) viruses, five (2%) were influenza A (H3) viruses, and 47 (15%) were influenza A viruses that were not subtyped. The majority (92%) of these isolates were tested from mid-May through late June, when 3.6% of specimens tested were positive for influenza. Since July 1, of specimens tested, 0.6% were positive for influenza. During May 21--September 9, the weekly percentage of patient visits to sentinel providers for influenza-like illness (ILI)† remained below the national baseline§ of 2.5% and ranged from 0.6% to 0.9%. The percentage of deaths attributable to pneumonia and influenza as reported by the 122 Cities Mortality Reporting System remained below the epidemic threshold.¶ One influenza-related pediatric death occurred and was reported to CDC during this period. WorldwideDuring May 21--September 9, influenza A (H3), influenza A (H1), and influenza B viruses cocirculated worldwide. Influenza A (H1) viruses predominated overall in Asia; however, in early summer, influenza B viruses predominated in Japan. In Africa, South Africa reported predominantly A (H3) viruses, and Madagascar reported a limited number of A (H3) and A (H1) viruses. In Europe and North America, small numbers of influenza A and influenza B viruses were reported. In Oceania, influenza A viruses predominated, with both influenza A (H1) and influenza A (H3) viruses circulating; influenza B viruses circulated at lower levels. In South America, influenza A (H1) viruses were most commonly reported, but influenza A (H3) and influenza B viruses also were identified. Characterization of Influenza Virus IsolatesThe WHO Collaborating Center for Surveillance, Epidemiology, and Control of Influenza located at CDC analyzes influenza virus isolates received from laboratories worldwide. Of 23 influenza A (H1) viruses that were collected during May 21--September 9 (three from Asia, 18 from Latin America, and two from the United States) and analyzed at CDC, 17 (74%) were antigenically similar to A/New Caledonia/20/99, the H1N1 component of the 2006--07 influenza vaccine. Six (26%) of the influenza A (H1) viruses had reduced titers to antisera produced against A/New Caledonia. Of the 19 influenza A (H3) viruses (one from Europe, 12 from Latin America, three from Asia, two from Oceania, and one from the United States) that were characterized, 18 (95%) were antigenically similar to A/Wisconsin/67/2005, the H3N2 component of the 2006--07 influenza vaccine, whereas one (5%) had reduced titers to A/Wisconsin/67/2005. Influenza B viruses currently circulating worldwide can be divided into two antigenically distinct lineages represented by B/Yamagata/16/88 and B/Victoria/2/87. The B component of the 2006--07 influenza vaccine belongs to the B/Victoria lineage. Of the 26 influenza B isolates collected during May 21--September 9 and characterized at CDC, 23 belonged to the B/Victoria lineage (one from Europe, five from Latin America, six from Asia, and 11 from the United States). Ten (43%) of the B/Victoria-lineage viruses were similar to B/Ohio/01/2005, the B component of the 2006--07 influenza vaccine, whereas 13 (57%) had reduced titers to B/Ohio. Human Infections with Avian Influenza A (H5N1) VirusesDuring December 1, 2003--September 8, 2006, a total of 244 human cases of avian influenza A (H5N1) infection were reported to WHO from 10 countries (3); 23 of these cases were reported since May 21, 2006. A total of 143 (59%) of the 244 cases were fatal. All human cases were reported from Asia (Azerbaijan, Cambodia, China, Indonesia, Iraq, Thailand, Turkey, and Vietnam) and Africa (Djibouti and Egypt), with the most recent cases reported from China, Indonesia, and Thailand. To date, no human case of avian influenza A (H5N1) virus infection has been identified in the United States. Reported by: WHO Collaborating Center for Surveillance, Epidemiology, and Control of Influenza. A Postema, MPH, L Brammer, MPH, S Wang, MPH, L Blanton, MPH, R Dhara, MPH, A Balish, T Wallis, D Shay, MD, J Bresee, MD, A Klimov, PhD, N Cox, PhD, Influenza Div (proposed), National Center for Immunization and Respiratory Diseases (proposed), CDC. Editorial Note:During May 21--September 9, 2006, influenza A (H1), influenza A (H3), and influenza B viruses cocirculated worldwide. The influenza virus type and subtype that will predominate and the severity of influenza-related disease activity for the 2006--07 influenza season are difficult to predict. Vaccination is the best method for preventing influenza. Influenza vaccine is recommended for persons at increased risk for influenza-related complications and severe disease (e.g., persons aged >50 years, children aged 6--59 months, pregnant women, and persons aged 6 months--49 years with certain medical conditions) and for health-care workers and household contacts of persons at increased risk (4). In addition to the groups for whom influenza vaccination is recommended, influenza vaccine can be administered to anyone who wants to reduce the likelihood of becoming ill with influenza. For the 2006--07 influenza season, the four manufacturers licensed to produce influenza vaccine for the United States (Sanofi Pasteur, Inc.; Novartis; GlaxoSmithKline, Inc.; and MedImmune Vaccines, Inc.) expect to produce more than 100 million doses of influenza vaccine. Because vaccine supplies for 2006 are projected to be plentiful and no delays are expected, influenza vaccination can proceed for all persons, whether healthy or at high risk, either individually or through mass campaigns, as soon as vaccine is available. The optimal time for influenza vaccination is during October--November; however, vaccine should be offered throughout the influenza season, even after influenza activity has been documented in the community. As a supplement to influenza vaccination, antiviral drugs aid in the control and prevention of influenza. However, high levels of resistance to the antiviral adamantanes (i.e., amantadine and rimantadine) have been identified among circulating influenza A (H3) viruses; therefore, CDC continues to recommend against use of the adamantane class of antivirals for the treatment and prophylaxis of influenza in the United States until susceptibility to adamantanes has been reestablished among circulating influenza A isolates (5,6). The ongoing widespread epizootic of highly pathogenic avian influenza A (H5N1) in Asia, Africa, and Europe remains a major public health concern. As of September 9, 2006, influenza A (H5N1) had been reported in migratory birds or poultry flocks in Africa, Asia, and Europe, with human cases reported from 10 countries in Africa and Asia. No evidence of sustained person-to-person transmission has been identified, although limited person-to-person transmission has occurred (7). No cases of infection with highly pathogenic influenza A (H5N1) have been identified in humans, poultry, or migratory birds in the United States. In collaboration with local and state health departments, CDC continues to recommend enhanced surveillance for possible influenza A (H5N1) infection among travelers with severe unexplained respiratory illness returning from countries affected by influenza A (H5N1) (8). Influenza surveillance reports for the United States are posted online weekly during October--May at http://www.cdc.gov/flu/weekly/fluactivity.htm. Additional information about influenza viruses, influenza surveillance, the influenza vaccine, and avian influenza is available at http://www.cdc.gov/flu. Acknowledgments This report is based, in part, on data contributed by state and territorial health departments and state public health laboratories; WHO collaborating laboratories; National Respiratory and Enteric Virus Surveillance System laboratories; the U.S. Influenza Sentinel Provider Surveillance System; the 122 Cities Mortality Reporting System; WHO National Influenza Centers, Communicable Diseases, Surveillance and Response, WHO, Geneva, Switzerland; A Hay, PhD, WHO Collaborating Centre for Reference and Research on Influenza, National Institute for Medical Research, London, England; I Gust, MD, I Barr, PhD, WHO Collaborating Center for Reference and Research on Influenza, Parkville, Australia; and M Tashiro, MD, WHO Collaborating Center for Reference and Research on Influenza, National Institute of Infectious Diseases, Tokyo, Japan. References
* Data as of September 15, 2006. † Defined as a temperature of >100.0°F (>37.8°C), oral or equivalent, and cough and/or sore throat in the absence of a known cause other than influenza. § The national baseline was calculated as the mean percentage of patient visits for ILI during noninfluenza weeks for the preceding three influenza seasons, plus 2 standard deviations. Noninfluenza weeks are those in which <10% of laboratory specimens are positive for influenza. Wide variability in regional data precludes calculating region-specific baselines; therefore, applying the national baseline to regional data is inappropriate. National and regional percentages of patient visits for ILI are weighted on the basis of state population. ¶ The seasonal baseline is projected using a robust regression procedure that applies a periodic regression model to the observed percentage of deaths from pneumonia and influenza during the preceding 5 years. The epidemic threshold is 1.645 standard deviations above the seasonal baseline. Figure 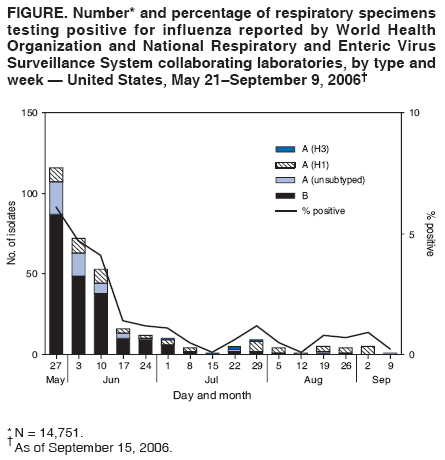 Return to top.
Disclaimer All MMWR HTML versions of articles are electronic conversions from ASCII text into HTML. This conversion may have resulted in character translation or format errors in the HTML version. Users should not rely on this HTML document, but are referred to the electronic PDF version and/or the original MMWR paper copy for the official text, figures, and tables. An original paper copy of this issue can be obtained from the Superintendent of Documents, U.S. Government Printing Office (GPO), Washington, DC 20402-9371; telephone: (202) 512-1800. Contact GPO for current prices. **Questions or messages regarding errors in formatting should be addressed to mmwrq@cdc.gov.Date last reviewed: 9/20/2006 |
|||||||||
|