|
|
|
|
|
|
|
| ||||||||||
|
|
|
|
|
|
|
||||
| ||||||||||
|
|
|
|
|
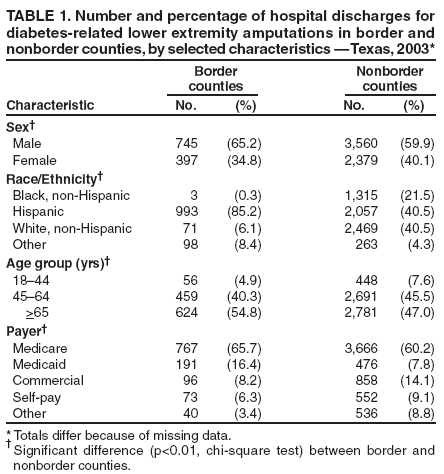
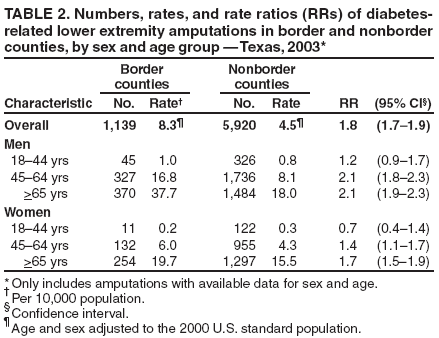
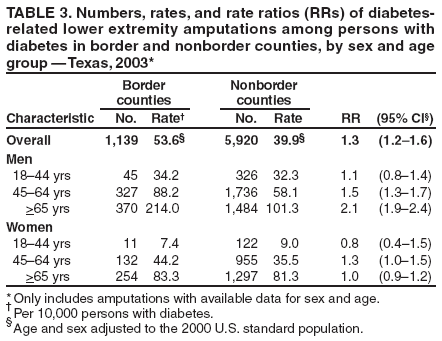
Persons using assistive technology might not be able to fully access information in this file. For assistance, please send e-mail to: mmwrq@cdc.gov. Type 508 Accommodation and the title of the report in the subject line of e-mail. Geographic Disparities in Diabetes-Related Amputations --- Texas-Mexico Border, 2003The risk for lower extremity amputation (LEA) is estimated at 15 to 40 times higher among persons with diabetes than among persons without diabetes (1). In Texas, the prevalence of diabetes is higher near the Mexico border (2,3), where persons are more likely to have lower levels of education, lower incomes, no health insurance, and other barriers to obtaining health care (4). To determine whether diabetes-related LEA rates are higher near the Texas-Mexico border, rates were calculated, in both the general population and among persons with diabetes, for diabetes-related LEAs in border and nonborder counties.* Data used for this analysis included 2003 Texas Inpatient Hospital Discharge Data (TIHDD) (5), 2003 Texas population estimates, and data from the 2003 Texas Behavioral Risk Factor Surveillance System (BRFSS). The results of the analysis indicated that the age- and sex-adjusted rate of diabetes-related LEAs in the general population along the border was nearly double the rate of nonborder counties. Among persons with diabetes, the rate along the border also was significantly higher than among those in nonborder counties, but the rate differences were primarily among men aged >45 years. Additional measures to prevent diabetes and improve education regarding diabetes care are needed to reduce the excess burden of LEAs among persons with diabetes along the border. In this analysis, the number of LEAs among persons with diabetes was determined using the 2003 TIHDD, which includes demographic, administrative, and medical information for all hospital discharges from approximately 95% of state-licensed hospitals in Texas. Veterans Affairs hospitals are exempt from reporting, as are hospitals in counties with a population <35,000 or with fewer than 100 licensed hospital beds. An LEA in a person with diabetes was defined as any hospital discharge with an International Classification of Diseases, Ninth Revision, Clinical Modification (ICD-9-CM) code for a lower extremity nontraumatic amputation procedure (ICD-9-CM 84.1) and a discharge diagnosis that included a code for diabetes (ICD-9-CM 250). Rates of diabetes-related LEAs in the population were calculated using 2003 Texas population estimates for border and nonborder counties as the denominator. To estimate the rate of LEAs among persons with diabetes, the denominator was calculated by multiplying age- and sex-specific diabetes prevalence estimates for border and nonborder regions from the 2003 Texas BRFSS by the corresponding population estimates for each region. BRFSS is a cross-sectional, random-digit--dialed telephone survey conducted in each state among noninstitutionalized civilians aged >18 years. Respondents were classified as persons with diabetes if they reported that a doctor had told them they had diabetes and the diabetes was not pregnancy related. No distinction was made between type 1 and 2 diabetes. Overall rates comparing border and nonborder counties were adjusted for age (18--44, 45--64, or >65 years) and sex using the 2000 U.S standard population. Because of missing county data (n = 40) and age data (n = 29 [2%] border counties, n = 197 [3%] nonborder counties), 266 discharges for LEA were excluded from rate calculations. Rate ratios (RRs) and corresponding 95% confidence intervals (CIs) comparing border and nonborder counties were calculated overall and by age group and sex. In 2003, a total of 7,325 LEAs (including the 266 excluded from rate calculations) occurred among persons with diabetes. The number of diabetes-related LEAs in border counties was 1,168, compared with 6,117 in nonborder counties. The age distribution for LEAs in border counties was significantly different from the distribution in nonborder counties (p<0.01, chi-square test), with a higher proportion of LEAs among persons aged >65 years residing along the border (Table 1). A significantly higher proportion of men along the border underwent LEAs (65.2%) than did men in nonborder counties (59.9%; p<0.01). The overall age- and sex-adjusted rate of LEAs in the population was 8.3 per 10,000 persons (CI = 7.7--8.7) in border counties and 4.5 (CI = 4.4--4.6) in nonborder counties (Table 2). Rates were higher among both men and women in border counties but were greatest among men aged >45 years. Among persons with diabetes, the overall age- and sex-adjusted rate of LEAs was 53.6 per 10,000 persons (CI = 50.5--56.7) in border counties compared with 39.9 (CI = 38.8-- 40.9) in nonborder counties. Rates among women were similar in border and nonborder counties. The disparity in rates among men was greater with increasing age (Table 3). Reported by: P Huang, MD, Texas Dept of State Health Svcs. D Bensyl, PhD, Office of Workforce and Career Development; EA Miller, PhD, EIS Officer, CDC. Editorial Note:Rates of diabetes-related LEAs in the general population were higher along the Texas-Mexico border compared with nonborder counties, especially among men. This is consistent with the higher prevalence of diabetes along the border. The estimated prevalence of diabetes from the 2003 Texas BRFSS was 9.5% in border counties and 7.9% in nonborder counties. However, the prevalence along the border might be considerably higher. Another study using blood samples and self-report to determine diabetes prevalence estimated the prevalence at 16.1% along the entire U.S.-Mexico border (3). Numerous barriers to health care have been identified among residents of border counties. For example, physicians are unevenly distributed, and the ratio of population to health professionals is high (6). Additionally, residents along the border have lower education levels, greater poverty, and a greater prevalence of persons without insurance than residents of nonborder counties (6). Because of these barriers, diabetes complications might be more advanced, which could lead to higher rates of LEAs among persons with diabetes. Rates calculated among persons with diabetes were higher in border counties, but primarily among men aged >45 years. The disabling and life-altering nature of LEAs has substantial effects on society and the health-care system. Total charges for diabetes-related LEA hospitalizations in Texas reached $324 million in 2003. Because of the greater prevalence of diabetes and possibly because of poor access to and use of preventive health-care services, LEAs disproportionately affect the border region. The border region accounted for 19% ($61 million) of the charges for all diabetes-related LEA hospitalizations in Texas, even though the border population is only 10% of the state's population. In addition, a significantly larger proportion of diabetes-related LEAs in border counties were paid for by Medicaid than in nonborder counties (16.4% versus 7.8%, respectively; p<0.01, chi-square test). The findings in this report are subject to at least four limitations. First, rates were calculated based on the number of hospital discharges for amputations rather than the number of persons who received an amputation. The TIHDD does not distinguish between whether a person was discharged for an amputation or a subsequent reamputation (i.e., a higher level amputation on the same extremity, such as a toe amputation followed by a foot amputation on one leg) within the same year. One study in Texas estimated the rate of reamputation to be as high as 26.7% within a year (7); therefore, a disproportionately higher rate of reamputations along the border might have contributed to the higher rates of amputations found in this analysis. Second, rates of LEAs among persons with diabetes were calculated using a denominator based on diabetes prevalence estimates from the Texas BRFSS. Because BRFSS is a landline telephone survey and estimates of diabetes prevalence are based on self-report, the BRFSS survey is thought to underestimate diabetes prevalence (8). Finally, race/ethnicity data were defined and collected differently in each data set used in this analysis, and few amputations occurred in border counties among non-Hispanics; therefore, corresponding rates and RRs limited to non-Hispanics were imprecise, and rates adjusted for and stratified by race/ethnicity are not presented. However, differences between residents with diabetes in border counties and nonborder counties were similar when comparing LEA rates among Hispanics only.† Controlling blood-glucose levels, having regular foot examinations and doctor visits, and using appropriate footwear can prevent diabetes-related amputations. Community outreach to educate the public and improve access to health care along the border is important. Diabetes education interventions along the U.S.-Mexico border have proven to be effective in teaching diabetes self-management, resulting in better diabetes control (9,10). Future interventions in Texas border communities should include community health workers (known as promotores de salud), culturally adapted curricula, and classes at community health centers to increase diabetes knowledge. Furthermore, measures to prevent obesity and diabetes are essential to reduce the effects of diabetes along the border. Acknowledgments This report is based, in part, on contributions from the Texas Health Care Information Collection, Texas Dept of State Health Svcs, and A De, Office of Workforce and Career Development, CDC. References
* Border counties were defined as the 32 (of 254) counties within 100 km (62 miles) of the Mexico border. † For Hispanics with diabetes in border versus nonborder counties, men: 18--44 years (RR = 1.2), 45--64 years (RR = 1.6), >65 years (RR = 1.8); women: 18--44 years (RR = 0.9), 45--64 years (RR = 1.1), >65 years (RR = 1.0). Table 1
Disclaimer All MMWR HTML versions of articles are electronic conversions from ASCII text into HTML. This conversion may have resulted in character translation or format errors in the HTML version. Users should not rely on this HTML document, but are referred to the electronic PDF version and/or the original MMWR paper copy for the official text, figures, and tables. An original paper copy of this issue can be obtained from the Superintendent of Documents, U.S. Government Printing Office (GPO), Washington, DC 20402-9371; telephone: (202) 512-1800. Contact GPO for current prices. **Questions or messages regarding errors in formatting should be addressed to mmwrq@cdc.gov.Date last reviewed: 11/21/2006 |
|||||||||
|