 |
|
|
|
|
|
|
| ||||||||||
|
|
|
|
|
|
|
||||
| ||||||||||
|
|
|
|
|
Persons using assistive technology might not be able to fully access information in this file. For assistance, please send e-mail to: mmwrq@cdc.gov. Type 508 Accommodation and the title of the report in the subject line of e-mail. Direct and Indirect Costs of Arthritis and Other Rheumatic Conditions --- United States, 1997Arthritis and other rheumatic conditions (AORC) are the leading cause of disability in the United States (1). The impact of AORC has been measured in terms of disability (1), ambulatory care (2), and hospitalization (3). To estimate the direct and indirect costs of AORC in the United States, CDC analyzed data from the 1997 Medical Expenditure Panel Survey (MEPS) (4). This report summarizes the results of that analysis, which found that, in 1997, the total cost of AORC in the United States was $116.3 billion (i.e., $51.1 billion in direct costs plus $65.2 billion in indirect costs), approximately 1.4% of the U.S. gross domestic product. Total costs attributable to AORC, by state, ranged from $163 million in Wyoming to $11.3 billion in California. These results underscore the need, as the U.S. population ages and treatments grow more costly, for state and local public health officials to implement additional self-management programs to help reduce the cost of AORC and help patients improve the quality of their lives. MEPS is an annual, nationally representative, longitudinal survey of the U.S. civilian, noninstitutionalized population that collects individual-level information about medical conditions, medical expenditures, employment, and earnings during an entire year. Each MEPS panel is a sample population from the previous year's National Health Interview Survey (NHIS) respondents. AORC cases from MEPS were defined by using the three-digit codes from the International Classification of Disease, Ninth Revision, Clinical Modification (ICD-9-CM)* selected by the National Arthritis Data Workgroup (5). This analysis used data from respondents (response rate: 66.4%) to the MEPS household and medical provider components. The 1997 MEPS did not include the nursing home component, excluding those costs from the analysis. A total of 22,435 respondents aged >18 years with complete data for all covariates were sampled; 4,449 had conditions consistent with the case definition. Individual-level direct costs (i.e., medical-care expenditures) were estimated by using a series of two- and four-stage econometric regression models (6), adjusting for six sociodemographic factors (i.e., age, sex, race, Hispanic ethnicity, marital status, and education level), eight of the most costly comorbidities (i.e., hypertension, other forms of heart disease, pulmonary conditions, stroke, other neurologic conditions, diabetes, cancer, and mental illness), and health-insurance status. The incremental cost attributable to AORC for each person was calculated as the difference between observed costs and corresponding expected values, which was determined by applying parameter estimates from persons without AORC to estimates from persons with AORC. Total costs attributable to AORC were calculated by multiplying the mean incremental cost of AORC by the number of persons with AORC as estimated by MEPS. Direct-cost estimates were generated for the overall total and the following treatment categories: 1) outpatient, 2) inpatient, 3) prescription drugs, and 4) residual (i.e., home health care, vision aids, dental visits, and medical devices). Statistical analyses were conducted in SAS and SUDAAN, which was used to adjust standard error estimates for the MEPS clustered sampling design (4). The attributable fraction (AF) for direct costs was estimated by dividing the sum of AORC-attributable medical costs for all AORC patients by the sum of medical costs for all persons in the sample for overall total and the four treatment categories. Indirect costs (i.e., lost earnings attributable to AORC) were estimated by using a series of two- and four-stage regression models (6) with adjustments for the same sociodemographic, comorbidity, and health-insurance variables used for the direct cost estimates. Direct cost analyses modeled probability and magnitude of health-care expenditures; indirect cost analyses modeled probability of employment and magnitude of lost earnings. Indirect cost estimates were generated for respondents aged 18--64 years. Direct and indirect costs for arthritis for each state were determined by applying the state's proportion of national doctor-diagnosed arthritis from the 2001 Behavioral Risk Factor Surveillance System (BRFSS) survey (response rate: 51.1%) to national cost estimates derived from the 1997 MEPS. In 1997, a total of 38.4 million (14.2%) U.S. residents aged >18 years had conditions consistent with the AORC case definition. On a national level, direct costs attributable to AORC were estimated at $51.1 billion; outpatient, inpatient, prescription drug, and residual direct costs totaled $22.0 billion, $14.7 billion, $4.1 billion, and $6.5 billion, respectively†. The AFs of AORC-attributable costs were 10% for total direct costs, 15% for outpatient, 7% for inpatient, 5% for prescription drugs, and 8% for residual categories. Among persons aged 18--64 years, indirect costs from AORC were estimated at $65.2 billion in lost earnings. By state, 1997 direct costs for AORC ranged from $72 million in Wyoming to approximately $5 billion in California (median: $726 million) (Table). Indirect costs ranged from $91 million in Wyoming to approximately $6 billion in California (median: $926 million). Reported by: M Cisternas, MA, MGC Data Svcs, Carlsbad; E Yelin, PhD, L Trupin, MPH, Univ of California at San Francisco. L Murphy, Association of Teachers of Preventive Medicine Fellow, CG Helmick, MD, Div of Adult and Community Health, National Center for Chronic Disease Prevention and Health Promotion, CDC. Editorial Note:This report presents the first population-based national AFs and state cost estimates for AORC and updates national direct and indirect cost estimates. Except for the 1996 MEPS-based arthritis estimates (7), the findings in this report are the first national estimates based on individual-level population data. To estimate AORC costs reliably, CDC generated national cost estimates from statistical models that controlled for costs associated with eight of the most costly comorbidities. Because the statistical models did not adjust for additional comorbidities, certain residual confounding occurred, resulting in overestimation of national costs. However, this overestimation probably was countered by other factors that led to cost underestimation, including omission of certain medical cost categories (e.g., long-term mental health services, complementary and alternative medicine, and nondurable medical goods) (8), institutionalized and military populations, and costs for unpaid services. In addition, the three-digit ICD-9-CM case definition resulted in a smaller prevalence estimate for AORC than other data sources (e.g., NHIS) (9). An alternative method for generating state-specific direct cost estimates might have been to apply the MEPS-derived AFs to state-specific direct-cost estimates from National Health Accounts (NHA) data, but this approach might have led to overestimates because substantial differences exist between the methodologies of MEPS and NHA. The findings in this report are subject to at least five limitations. First, because no state-specific data exist on individual-level arthritis costs, synthetic state cost estimates were generated from national cost data. Second, national direct and indirect cost estimates were apportioned by state-specific proportions of doctor-diagnosed arthritis, introducing error to the state estimates. For direct costs, data were not adjusted for differences among states in provider charges or treatment resources; for indirect costs, data were not adjusted for state wage differentials. Costs among states with medical expenditures or wages higher than the national mean probably are underestimated, and costs among those below the mean probably are overestimated. Third, the state-specific analysis used the ICD-9-CM codes reported by MEPS panelists and BRFSS reports of doctor-diagnosed arthritis. Both MEPS and BRFSS are subject to similar self-report bias. However, state-specific arthritis costs for 1990, based on the ICD-9-CM code definition for AORC (5), were compared with 2001 BRFSS estimates and found to be distributed similarly within each state in both periods (6). Fourth, indirect cost estimates were limited to data on lost earnings among MEPS respondents aged 18--64 years. Although total earnings of those aged >65 years probably are not large enough to influence these results, costs incurred through loss of unpaid work (e.g., caretaking), if included, would elevate these estimates (10). Finally, BRFSS prevalence data were applied to MEPS data because arthritis prevalences by state cannot be estimated from MEPS. The 2001 BRFSS data were used because they are the only directly measured state-specific estimates of arthritis prevalence. However, both MEPS and BRFSS were designed to be nationally representative surveys of U.S. noninstitutionalized civilians, and each state's proportion of national arthritis cases probably was similar during 1997--2001. The cost estimates in this report are part of CDC's ongoing effort to fully characterize the 1997 arthritis burden in the United States. Substantial increases in costs are anticipated as the U.S. population ages and increased use is made of more costly AORC interventions (e.g., COX-2 inhibitors, biologic response modifiers, and total joint replacement surgery). More widespread public health efforts to expand the use of AORC self-management programs and practices (e.g., increased physical activity or maintaining healthy weight) might help reduce these costs and improve the quality of patients' lives. References
* ICD-9-CM codes 274, 354, 390, 391, 443, 446, 710--716, 719--721, and 725--729. † Direct costs for each of the four categories do not sum to $51.1 billion. Estimates for each of the categories were from independent regression models, and the discrepancy arises from consolidation of variance across regression models. Table 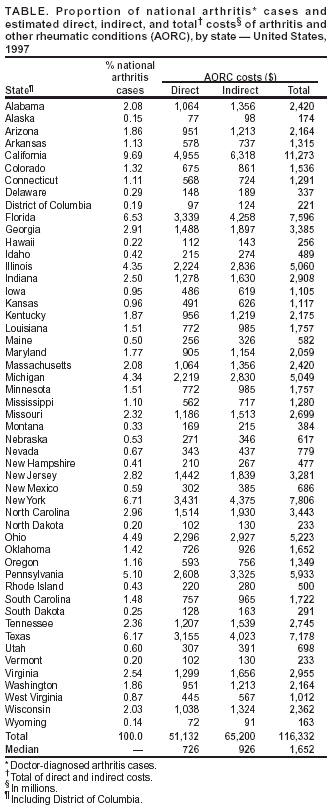 Return to top.
Disclaimer All MMWR HTML versions of articles are electronic conversions from ASCII text into HTML. This conversion may have resulted in character translation or format errors in the HTML version. Users should not rely on this HTML document, but are referred to the electronic PDF version and/or the original MMWR paper copy for the official text, figures, and tables. An original paper copy of this issue can be obtained from the Superintendent of Documents, U.S. Government Printing Office (GPO), Washington, DC 20402-9371; telephone: (202) 512-1800. Contact GPO for current prices. **Questions or messages regarding errors in formatting should be addressed to mmwrq@cdc.gov.Page converted: 11/20/2003 |
|||||||||
This page last reviewed 11/20/2003
|