|
|
|
|
|
|
|
| ||||||||||
|
|
|
|
|
|
|
||||
| ||||||||||
|
|
|
|
|
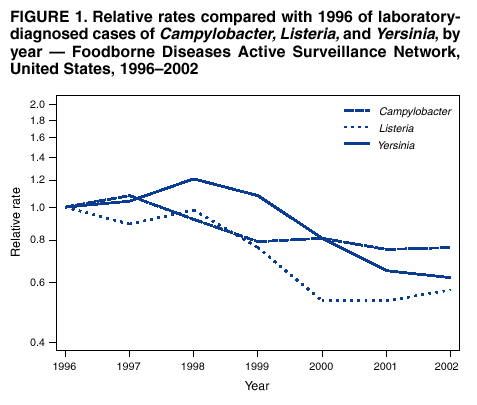
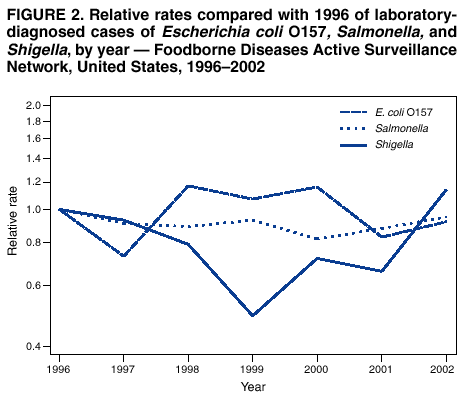
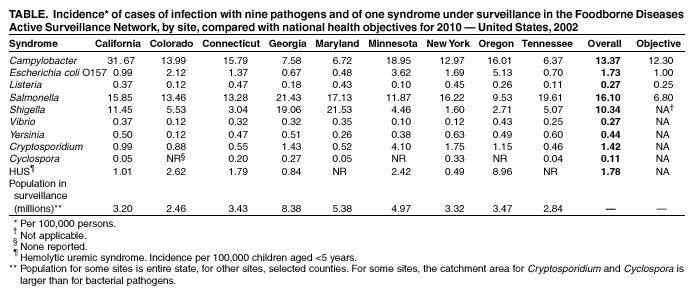
Persons using assistive technology might not be able to fully access information in this file. For assistance, please send e-mail to: mmwrq@cdc.gov. Type 508 Accommodation and the title of the report in the subject line of e-mail. Preliminary FoodNet Data on the Incidence of Foodborne Illnesses --- Selected Sites, United States, 2002In the United States, an estimated 76 million persons contract foodborne illnesses each year (1). CDC's Emerging Infections Program Foodborne Diseases Active Surveillance Network (FoodNet) collects data on 10 foodborne diseases in nine U.S. sites. FoodNet follows trends in foodborne infections by using laboratory-based surveillance for culture-confirmed illness caused by several enteric pathogens commonly transmitted through food (2). This report describes preliminary surveillance data for 2002 and compares them with 1996--2001 data. The data indicate a sustained decrease in major bacterial foodborne illnesses such as Campylobacter and Listeria, indicating progress toward meeting the national health objectives of reducing the incidence of foodborne infections by 2010 (objectives 10-1a to 10-1d) (3). However, the data do not indicate a sustained decline in other major foodborne infections such as Escherichia coli O157 and Salmonella, indicating that increased efforts are needed to reduce further the incidence of foodborne illnesses. In 1996, FoodNet began active surveillance for laboratory-diagnosed cases of infection with Campylobacter, Shiga toxin-producing E. coli (STEC) O157, Listeria monocytogenes, Salmonella, Shigella, Vibrio, and Yersinia enterocolitica. In 1997, FoodNet added surveillance for laboratory-diagnosed cases of Cryptosporidium parvum, Cyclospora cayetanensis, and cases of hemolytic uremic syndrome (HUS). In 2000, FoodNet began to capture information on non-O157 STEC. From 1996 to 2002, the FoodNet surveillance population increased from five sites and a population of 14.2 million to nine sites and 37.4 million persons (13% of the U.S. population). To identify cases, FoodNet personnel contact all clinical laboratories in their surveillance area either weekly or monthly depending on the size of the clinical laboratory. Cases represent the first isolation of a pathogen from a person by a clinical laboratory; the majority of specimens are obtained for diagnostic purposes from ill persons. HUS surveillance is conducted by contacting all FoodNet-identified pediatric nephrologists at least monthly. In this report, analyses of HUS incidence were performed only on children aged <5 years; 94% of these children had a documented history of diarrhea during the 3 weeks preceding diagnosis of HUS. Preliminary incidence for 2002 was calculated by using the number of cases of diagnosed infections or HUS that FoodNet had identified as the numerator and 2002 population estimates as the denominator (4). 2002 SurveillanceDuring 2002, a total of 16,580 laboratory-diagnosed cases of 10 infections under surveillance were identified: 6,028 of Salmonella infection, 5,006 of Campylobacter, 3,875 of Shigella, 647 of STEC O157 (26 of non-O157 STEC), 541 of Cryptosporidium, 166 of Yersinia, 103 of Vibrio, 101 of Listeria, 44 of HUS, and 43 of Cyclospora. Among the 5,481 (91%) Salmonella isolates serotyped, the three most common serotypes accounted for 49% of the infections: 1,051 (19%) were serotype Typhimurium, 842 (15%) were Enteritidis, and 791 (14%) were Newport. The most common non-O157 STEC serotypes isolated were O26 and O111. Substantial variations in incidence of specific infections, defined as laboratory isolations per 100,000 persons, were reported among the sites (Table). 1996--2002 ComparisonA main effects log-linear Poisson regression model (5) was used to estimate the effect of time on the incidence of the various pathogens, treating calendar year as a categorical variable, with 1996 as the reference year. This model assumed that disease incidence in sites added to surveillance after 1996 changed over time in a way similar to the change that occurred in the original five sites. The relative change in incidence from 1996 to 2002 was estimated, and confidence intervals (CIs) for that change were calculated. In 2002, the bacterial pathogens with the highest incidence were Salmonella, Campylobacter, and Shigella (Table). From 1996 to 2002, the incidence of infection with several pathogens decreased. For Campylobacter, Listeria, and Yersinia, this decrease was observed consistently over several years (Figure 1). The estimated incidence of Campylobacter decreased 24% (95% CI = 32%--16% decrease), Listeria decreased 38% (95% CI = 52%--19% decrease), and Yersinia decreased 43% (95% CI = 55%--27% decrease). From 1996 to 2002, the estimated incidence of Salmonella did not change significantly (Figure 2). However, during this period, the estimated incidence of S. Typhimurium decreased 31% (95% CI = 41%--18% decrease); this decrease was observed consistently over several years. The estimated incidence of S. Enteritidis did not change significantly (95% CI = 36% decrease--35% increase); a substantial decline in incidence before 1999 has been largely reversed by an increase in incidence. The estimated incidence of S. Newport increased 87% from 1996 to 2002 (95% CI = 15% to 203% increase), with the majority of the increase occurring since 2001. The incidence of E. coli O157 showed substantial variation by year and site. The estimated incidence in 2002 was 8% lower than 1996 (95% CI = 33% decrease--26% increase). Similar to E. coli O157, which is a major cause of HUS, the incidence of HUS among children aged <5 years has not changed significantly. The incidence of Shigella declined from 1996 to 1999 and has since increased; the estimated incidence in 2002 was 14% higher than in 1996 (95% CI = 34% decrease--99% increase) and varied by site each year. From 1996 to 2002, the estimated incidence of Vibrio infections increased 126% (95% CI = 29%--298% increase). Surveillance for Cryptosporidium and Cyclospora began in 1997. From 1997 to 2002, the estimated incidence of Cryptosporidium increased 8% (95% CI = 35% decrease--81% increase). Although the incidence of Cyclospora has decreased since 1997, the Poisson regression model could not be applied because of the rarity of cases. Reported by: D Vugia, MD, California Dept of Health Svcs. J Hadler, MD, State Epidemiologist, Connecticut State Dept of Public Health. S Chaves, MD, Div of Public Health, Georgia Dept of Human Resources. D Blythe, MD, Maryland Dept of Health and Mental Hygiene. K Smith, DVM, Minnesota Dept of Health. D Morse, MD, New York State Dept of Health. P Cieslak, MD, Oregon Dept of Human Svcs. T Jones, MD, Tennessee Dept of Health. A Cronquist, MPH, Colorado Dept of Public Health and Environment. D Goldman, MD, Office of Public Health and Science, Food Safety and Inspection Svc, US Dept of Agriculture. J Guzewich, MPH, Center for Food Safety and Applied Nutrition, Food and Drug Administration. F Angulo, DVM, P Griffin, MD, R Tauxe, MD, Div of Bacterial and Mycotic Diseases, National Center for Infectious Diseases, CDC. Editorial Note:From 1996 to 2002, the incidence of Campylobacter, Listeria, and Yersinia has shown substantial declines. Campylobacter and Listeria incidences are approaching their respective national health objectives, indicating important progress in food safety. For infections caused by the three most common Salmonella serotypes, a sustained decline in incidence has occurred only for S. Typhimurium. From 1996 to 2002, the incidence did not decline for Salmonella, Shigella, Vibrio, Cryptosporidium, E. coli O157, and HUS. Although the incidence of Salmonella declined initially, it has increased since 2000. Salmonella infections are caused by many different Salmonella serotypes with different animal reservoirs; therefore, changes in overall incidence of Salmonella are influenced strongly by the most common serotypes and their reservoirs. For example, the incidence of S. Enteritidis infections declined during the late 1990s but has since increased, similar to the incidence of Salmonella infections caused by all serotypes combined. Similarly, the largest increase in incidence of Vibrio infections occurred from 1996 to 1998, and this increase was associated with the emergence of a new pandemic strain of Vibrio parahaemolyticus (6). However, from 2000 to 2002, other Vibrio species have contributed substantially to the overall increase in Vibrio infections. Targeted efforts to reduce the rate of foodborne illnesses could include steps to reduce the prevalence of pathogens in their respective important animal reservoirs and the foods derived from them: cattle and ground beef (E. coli O157), egg-laying chickens (S. Enteritidis), and seafood, particularly oysters (Vibrio). Implementation of nationwide, mandatory, on-farm preventive controls would reduce the risk for human illness from S. Enteritidis-contaminated eggs; such controls have been effective in reducing S. Enteritidis contamination of eggs where implemented (7). Some year-to-year variation in incidence can be attributed to outbreaks. For example, in 2002, both Georgia and Maryland experienced large community outbreaks of Shigella sonnei infections. Oregon experienced a large outbreak of E. coli O157 infections, many of which were complicated by HUS, associated with a county fair. A large outbreak of multidrug-resistant S. Newport infections from ground beef in 2002 might be related to emergence of this strain in dairy cattle (8). In 2002, a large multistate outbreak of infections caused by pansusceptible S. Newport was traced to contaminated tomatoes (9). The changes in the incidence of these infections occurred in the context of several control measures, including implementation by the U.S. Department of Agriculture's Food Safety and Inspection Service (FSIS) of the Pathogen Reduction/Hazard Analysis and Critical Control Point (HACCP) systems regulations in meat and poultry slaughter and processing plants beginning in 1997. The decline in the rate of S. Typhimurium infections in humans coincided with a decline in the prevalence of Salmonella isolated from FSIS-regulated products to levels below baseline levels before HACCP was implemented (10). The Food and Drug Administration has introduced additional interventions to prevent foodborne diseases. These interventions include increased attention to fresh produce safety through better agricultural practices, regulations requiring the refrigeration and safety labeling of shell eggs, implementation of HACCP in the seafood and juice industries, food safety education, increased regulation of imported food, and industry efforts, including new intervention technologies, to reduce food contamination. The findings in this report are subject to at least three limitations. First, FoodNet data are limited to diagnosed illnesses; however, the majority of foodborne illnesses are neither laboratory-diagnosed nor reported to state health departments. Second, some illnesses are acquired through nonfoodborne routes (e.g., contaminated water, person-to-person contact, and direct animal exposure); reported rates do not represent foodborne sources exclusively. Finally, although FoodNet data provide the most comprehensive information available for these infections, the findings might not be generalizable to the entire U.S. population. The 2002 FoodNet final report will include incidence figures and other information, such as illness severity, and will be available in late 2003 at http://www.cdc.gov/foodnet. Acknowledgment This report is based on data contributed by members of the FoodNet Working Group. References
|
Use of trade names and commercial sources is for identification only and does not imply endorsement by the U.S. Department of
Health and Human Services. |
Disclaimer All MMWR HTML versions of articles are electronic conversions from ASCII text into HTML. This conversion may have resulted in character translation or format errors in the HTML version. Users should not rely on this HTML document, but are referred to the electronic PDF version and/or the original MMWR paper copy for the official text, figures, and tables. An original paper copy of this issue can be obtained from the Superintendent of Documents, U.S. Government Printing Office (GPO), Washington, DC 20402-9371; telephone: (202) 512-1800. Contact GPO for current prices.
Page converted: 4/17/2003
|
|
|||||
|
HOME |
ABOUT MMWR |
MMWR SEARCH |
DOWNLOADS |
RSS
|
CONTACT
|
|||||
|
|
|||||
|
This page last reviewed 4/17/2003