|
|
|
|
|
|
|
| ||||||||||
|
|
|
|
|
|
|
||||
| ||||||||||
|
|
|
|
|
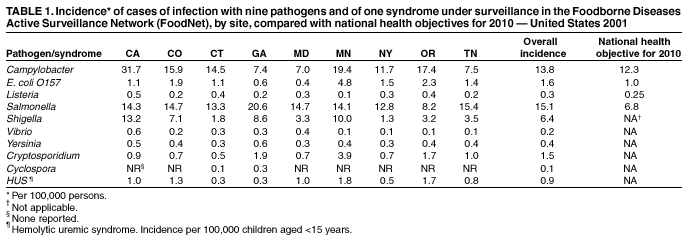
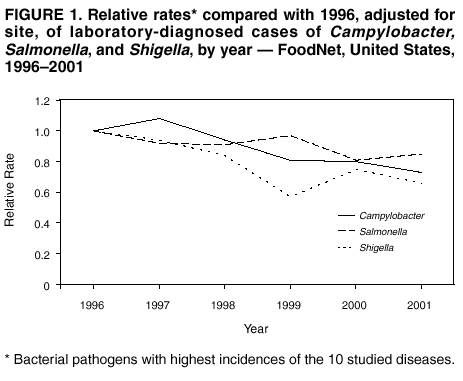
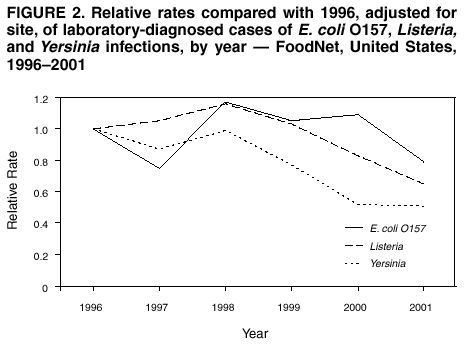
Persons using assistive technology might not be able to fully access information in this file. For assistance, please send e-mail to: mmwrq@cdc.gov. Type 508 Accommodation and the title of the report in the subject line of e-mail. Preliminary FoodNet Data on the Incidence of Foodborne Illnesses --- Selected Sites, United States, 2001An estimated 76 million persons contract foodborne illnesses each year in the United States (1). CDC's Emerging Infections Program Foodborne Diseases Active Surveillance Network (FoodNet) collects data about 10 foodborne diseases in nine U.S. sites to quantify and monitor foodborne illnesses (2). This report describes preliminary surveillance data for 2001 and compares them with 1996--2000 data. The data show a decrease in the major bacterial foodborne illnesses, indicating progress toward meeting the national health objectives of reducing the incidence of foodborne diseases by 2010 (3). However, the data do not show a sustained decline in some infections, indicating that increased efforts are needed to reduce further the incidence of foodborne illnesses. In 1996, active surveillance began for laboratory-diagnosed cases of infection with Campylobacter, Escherichia coli O157, Listeria monocytogenes, Salmonella, Shigella, Vibrio, and Yersinia enterocolitica infections in Minnesota, Oregon, and selected counties in California, Connecticut, and Georgia. In 1997, FoodNet was expanded to include laboratory-diagnosed cases of Cryptosporidium parvum, Cyclospora cayetanensis, and hemolytic uremic syndrome (HUS). From 1996 to 2001, the FoodNet surveillance population increased from five sites and a population of 14.2 million to nine sites and 37.8 million persons (13% of the U.S. population). To identify cases, FoodNet personnel contact each clinical laboratory in their surveillance area either weekly or monthly depending on the size of the clinical laboratory. Cases represent the first isolation of a pathogen from a person by a clinical laboratory; most specimens are obtained for diagnostic purposes from ill persons. HUS surveillance is conducted by contacting all FoodNet-identified pediatric nephrologists at least monthly. In this report, analyses of HUS data were performed only on persons aged <15 years. Preliminary incidence figures for 2001 were calculated by using the number of cases of diagnosed infections or syndromes that FoodNet had identified as the numerator and 2000 population estimates as the denominator (4). Final incidence will be calculated when 2001 population census estimates are available. 2001 SurveillanceDuring 2001, a total of 13,705 laboratory-diagnosed cases of 10 foodborne diseases under surveillance was identified: 5,198 of Salmonella infection, 4,740 of Campylobacter, 2,201 of Shigella, 574 of Cryptosporidium, 565 of E. coli O157, 145 of Yersinia, 94 of Listeria, 80 of Vibrio, 32 of Cyclospora, and 76 of HUS. Among the 4,520 (87%) Salmonella infection isolates serotyped, the five most common serotypes accounted for 65% of the infections for which serotype was known: 1,132 (25%) were serotype Typhimurium, 689 (15%) were Enteritidis, 553 (12%) were Newport, 321 (7%) were Heidelberg, and 227 (5%) were Javiana. Substantial variations in incidence of specific diseases, defined as laboratory-diagnosed infections per 100,000 persons, were reported among the sites (Table 1). The incidence of Campylobacter cases ranged from 7.0 in Maryland to 31.7 in California. The incidence of Salmonella ranged from 8.2 in Oregon to 20.6 in Georgia. The incidence of infection with specific Salmonella serotypes also varied. The overall incidence of infection with S. Typhimurium was 3.3, ranging from 1.7 in California to 4.1 in Minnesota and New York; S. Enteritidis was 2.0, ranging from 0.8 in Oregon to 4.4 in Maryland; S. Newport was 1.6, ranging from 0.5 in Oregon to 3.3 in Georgia; S. Heidelberg was 0.9, ranging from 0.4 in Connecticut to 1.5 in California; and S. Javiana was 0.7, ranging from no cases in New York and Connecticut to 2.1 in Georgia. The incidence of Shigella cases ranged from 1.3 in New York to 13.2 in California; E. coli O157 cases ranged from 0.4 in Maryland to 4.8 in Minnesota; Yersinia cases ranged from 0.3 in Maryland, New York, and Connecticut to 0.6 in Georgia; Listeria cases ranged from 0.1 in Minnesota to 0.5 in California; Vibrio cases ranged from 0.1 in Minnesota, New York, Oregon, and Tennessee to 0.6 in California; Cryptosporidium cases ranged from 0.5 in Connecticut to 3.9 in Minnesota. Cyclospora cases were identified only in Connecticut and Georgia. Of the nine FoodNet sites, Minnesota and Oregon had the highest incidence of HUS. For Minnesota, incidence per 100,000 children was 3.6 for children aged <5 years and 1.8 for children aged <15 years. For Oregon, incidences for children in those age groups were 2.7 and 1.7, respectively. HUS incidence for children aged <15 years ranged from 0.3 in Connecticut and Georgia to 1.8 in Minnesota. Crude incidence for foodborne diseases varied by age. Infants and young children had the highest incidence of most foodborne infections. The rates were highest in children aged <1 year for Salmonella (134.1 per 100,000 children), Campylobacter (33.5), Yersinia (11.2), and Listeria (1.9) and highest in children aged 1--4 years for Shigella (29.1), E. coli O157 (6.8), and Cryptosporidium (3.9). The highest incidence of Cyclospora infection (0.1) was in persons aged 20--29 years, and the highest incidence of Vibrio infection (0.7) was in persons aged 65--74 years. The incidence of Listeria cases in persons aged >75 years (1.7) approached the incidence in infants. Incidence of HUS was 1.5 among children aged <5 years and 0.9 among children aged <15 years. 1996--2001 ComparisonThe number of sites and the population under surveillance have nearly doubled since FoodNet began in 1996. Because of substantial variation in incidence among the sites, adding new sites influences overall crude incidence. To account for the increased population and variation in the incidence among sites, a log-linear Poisson regression model (5) was used to estimate the effect of time on the incidence of the various pathogens, treating time (i.e., calendar year) as a categorical variable, with 1996 as the reference year. The relative change in incidence rates during 1996--2001 was estimated and confidence intervals for that change were calculated. The regression model was used to estimate combined incidences of the four diseases covered by specific national health objectives and for all seven bacterial pathogens. The bacterial pathogens with the highest relative incidence during 1996--2001 were Campylobacter, Salmonella, and Shigella (Figure 1). Pathogens with lower incidence were E. coli O157, Listeria, and Yersinia (Figure 2). The incidence of infection with most pathogens decreased during 1996--2001. For four pathogens (Yersinia, Listeria, Campylobacter, and Salmonella), this decrease was observed consistently over several years. During 1996--2001, the estimated incidence of Yersinia infections decreased 49% (95% confidence interval [CI]=35% to 60% decrease), Listeria decreased 35% (95% CI= 9% to 53% decrease), Campylobacter decreased 27% (95% CI=19% to 35% decrease), and Salmonella decreased 15% (95% CI=7% to 22% decrease). Considerable temporal variations were observed for the five most common Salmonella serotypes. During 1996--2001, S. Typhimurium decreased 24% (95% CI=13% to 34% decrease), S. Enteritidis decreased 22% (95% CI=41% decrease to 3% increase), S. Newport increased 32% (95% CI=24% decrease to 128% increase), S. Heidelberg increased 34% (95% CI=7% to 66% increase), and S. Javiana increased 228% (95% CI=75% to 513% increase). A substantial decline in the incidence of S. Enteritidis infection during 1996--1999 was partially reversed by an increased incidence in 2000 and 2001. During 1996--2001, the estimated incidence of E. coli O157 infections decreased 21% (95% CI=41% decrease to 5% increase), but this decline reflects a decrease only for 2001. The incidence of Shigella infections showed considerable variation by year and site. The estimated incidence in 2001 was 35% lower than in 1996 (95% CI=57% decrease to 3% increase). The incidence of Vibrio infections was 91% higher in 1997 than it was in 1996, reflecting the emergence of Vibrio parahaemolyticus O3:K6 (6), and has not shown a consistent change since; the incidence was 83% higher in 2001 than in 1996 (95% CI=3% to 224% increase). The national health objectives for 2010 target specific goals for the reduction in the incidence of four foodborne diseases: Campylobacter, E. coli O157, Listeria, and Salmonella infections (Table 1). Using the multivariate regression model, the combined estimated incidence of infections caused by these four pathogens in 2001 was 21% lower than in 1996. The combined estimated incidence of infections caused by the seven bacterial pathogens in 2001 was 23% lower than in 1996. Surveillance for the parasitic pathogens, Cryptosporidium and Cyclospora, began in 1997. During 1997--2001, the incidence of Cryptosporidium cases decreased 33% (95% CI=4% to 53% decrease). Although the incidence of Cyclospora has decreased since 1997, the statistical model could not be applied to Cyclospora because of the rarity of cases (124 cases during 1997--2001). Reported by: Members of the FoodNet Working Group: D Vugia, MD, Acting State Epidemiologist, California Dept of Health Svcs. J Hadler, MD, State Epidemiologist, Connecticut State Dept of Public Health. P Blake, MD, State Epidemiologist, Div of Public Health, Georgia Dept of Human Resources. D Blythe, MD, Maryland Dept of Health and Mental Hygiene. K Smith, DVM, Minnesota Dept of Health. D Morse, MD, New York Dept of Health. P Cieslak, MD, Oregon Dept of Human Svcs. T Jones, MD, Tennessee Dept of Health. P Shillam, MSPH, Colorado State Dept of Health. DW Chen, MD, Office of Public Health and Science, Food Safety and Inspection Svc, US Dept of Agriculture. B Garthright, PhD, Center for Food Safety and Applied Nutrition, Food and Drug Administration. L Charles, PhD, K Mølbak, MD, F Angulo, DVM, P Griffin, MD, R Tauxe, MD, National Center for Infectious Diseases, CDC. Editorial Note:During 1996--2001, incidence of infections caused by Yersinia, Listeria, Campylobacter, and Salmonella have shown a substantial and sustained decline. The declines in the incidence of foodborne diseases targeted in the national health objectives indicates important progress. However, additional measures will be needed to reduce further the incidence of these diseases to achieve the national health objectives. On the basis of studies conducted by FoodNet to monitor factors that can influence the incidence of foodborne diseases, changes in health-care--seeking behaviors for persons with diarrhea or changes in laboratory testing practices are unlikely to explain the declines observed in disease incidence (7,8). Enhanced surveillance and outbreak investigations have identified new control measures, and focused attention on preventing foodborne diseases. The declines in the incidence of these foodborne infections occurred in the context of several control measures, including implementation by the U.S. Department of Agriculture's Food Safety Inspection Service (FSIS) of the Pathogen Reduction/Hazard Analysis Critical Control Point (HACCP) systems regulations in meat and poultry slaughter and processing plants. The decline in the rate of Salmonella infections in humans coincided with a decline in the prevalence of Salmonella isolated from FSIS-regulated products to levels well below baseline levels before HACCP was implemented (9). Additional interventions that have been introduced during the past several years to prevent foodborne diseases include egg-quality assurance programs for S. Enteritidis, increased attention to fresh produce safety through better agricultural practices, introduction of HACCP in the seafood industry, regulation of fruit and vegetable juice, industry efforts including new intervention technologies to reduce food contamination, food safety education, and increased regulation of imported food. Although the incidence of infection has declined for several foodborne diseases, the incidence of foodborne diseases remains high. Efforts to reduce the rate of foodborne illnesses might include steps to reduce the prevalence of these pathogens in their respective important animal reservoirs: cattle (E. coli O157), egg-laying chickens (S. Enteritidis), and seafood, particularly oysters (Vibrio). Implementation of nationwide, consistent, on-farm preventive controls would reduce the risk for human illness from S. Enteritidis-contaminated eggs. The increases in infections caused by S. Newport, S. Heidelberg, and S. Javiana (10) and the high incidence of foodborne diseases in children, especially infants, are of major concern. To determine possible risk factors for infections and opportunities for prevention, FoodNet has initiated a case-control study of sporadic cases of Salmonella and Campylobacter in young children. The findings in this report are subject to at least three limitations. First, FoodNet data are limited to diagnosed illnesses; however, most foodborne illnesses are neither laboratory-diagnosed nor reported to state health departments. For example, although clinical laboratories in FoodNet sites routinely test stool specimens for Salmonella and Shigella, and almost always for Campylobacter, only about 60% routinely test for E. coli O157, and fewer test routinely for other pathogens. Variations in testing for pathogens could account for some of the variations in incidence, including variations by site and age. Second, because some laboratory-diagnosed illnesses reported to FoodNet also might be acquired through nonfoodborne routes (e.g., through contaminated water, person-to-person contact, and direct animal exposure), reported rates do not represent foodborne sources exclusively. Finally, although FoodNet data provide the most detailed information available for these infections, the data do not reflect the entire U.S. population. The 2001 FoodNet final report will include incidence figures and other information, such as illness severity, and will be available in late 2002 at http//www.cdc.gov/foodnet. Because the population in the FoodNet sites has increased since 2000, final 2001 rates will be somewhat lower than preliminary rates. AcknowledgmentsAdditional members of the FoodNet Working Group include S Abbott, P Daily, MPH, J Mohle-Boetani, MD, J Nadle, MPH, J O'Connell, S Shallow, MPH, M Samuel, DrPH, A McNees, MPH, G Rothrock, MPH, California Emerging Infections Program, California Dept of Health Svcs. S Hurd, MPH, R Marcus, MPH, T Rabatsky-Ehr, MPH, School of Medicine, Yale Univ, New Haven; R Howard, MS, A Kinney, C Welles, State Dept of Public Health Laboratory; M Cartter, MD, Q Phan, MPH, Connecticut State Dept of Public Health. M Farley, MD, S Ray, MD, W Baughman, MSPH, S Segler, MPH, Emory Univ School of Medicine and the Veterans Administration Medical Center, Atlanta. K Lane, MPH, S Lance-Parker, DVM, W MacKenzie, MD, K McCombs, MPH, S Thomas, MSPH, Div of Public Health, Georgia Dept of Human Resources. JG Morris, MD, M Hawkins, MD, Dept of Epidemiology and Preventive Medicine, Univ of Maryland School of Medicine; K Homes, MS, Johns Hopkins Bloomberg School of Public Health, Baltimore; M McGavern, MS, S Tong, MPH, J Totaro, MPH, X Wang, MD, J Roche, MD, Acting State Epidemiologist, Maryland Dept of Health and Mental Hygiene. K Smith, DVM, J Besser, MS, E Swanson, MPH, S Stenzel, MPH, C Medus, MPH, Minnesota Dept of Health. K Hechemy, H Chang, S Zansky, PhD, D Morse, MD, P Smith, MD, State Epidemiologist, New York Dept of Health. M Cassidy, T McGivern, B Shiferaw, MD, M Kohn, MD, State Epidemiologist, Oregon Dept of Human Svcs, Office for Disease Prevention and Epidemiology. EJ Boothe, MSN, R Garman, MPH, DE Gerber, MS, A Craig, MD, State Epidemiologist, Tennessee Dept of Health. J Beebe, PhD, S Burnite, M Finke, K Gershman, MD, L Hammond, MSPH, P Hamel, E Mangione, MD, Colorado State Dept of Health. K Holt, DVM, T Lasky, PhD, D Lewis, PhD, P Sparling, DVM, M Cooper, PhD, Office of Public Health and Science, Food Safety and Inspection Svc, US Dept of Agriculture. K Falci, PhD, C Purdy, Center for Food Safety and Applied Nutrition, Food and Drug Administration. F Hardnett, MS, M Hoekstra, PhD, S Johnson, Div of Bacterial and Mycotic Diseases, J Jones, MD, Div of Parasitic Diseases, S Delong, MPH, S Ehlers, MPH, B Imhoff, MPH, M Kennedy, MPH, J Lay, MPH, T Van Gilder, MD, National Center for Infectious Diseases; Jay Varma, MD, Epidemiology Program Office, CDC. References
|
Use of trade names and commercial sources is for identification only and does not imply endorsement by the U.S. Department of
Health and Human Services. |
Disclaimer All MMWR HTML versions of articles are electronic conversions from ASCII text into HTML. This conversion may have resulted in character translation or format errors in the HTML version. Users should not rely on this HTML document, but are referred to the electronic PDF version and/or the original MMWR paper copy for the official text, figures, and tables. An original paper copy of this issue can be obtained from the Superintendent of Documents, U.S. Government Printing Office (GPO), Washington, DC 20402-9371; telephone: (202) 512-1800. Contact GPO for current prices.
**Questions or messages regarding errors in formatting should be addressed to mmwrq@cdc.gov.Page converted: 4/18/2002
|
|
|||||
|
HOME |
ABOUT MMWR |
MMWR SEARCH |
DOWNLOADS |
RSS
|
CONTACT
|
|||||
|
|
|||||
|
This page last reviewed 4/18/2002