 |
|
|
|
|
|
|
| ||||||||||
|
|
|
|
|
|
|
||||
| ||||||||||
|
|
|
|
|
Persons using assistive technology might not be able to fully access information in this file. For assistance, please send e-mail to: mmwrq@cdc.gov. Type 508 Accommodation and the title of the report in the subject line of e-mail. Vaccination Coverage Among Children Enrolled in Head Start Programs and Licensed Child Care Centers and Entering School --- United States and Selected Reporting Areas, 1999--2000 School YearUndervaccinated children enrolled in child care centers (1) and schools (2) are vulnerable to outbreaks of vaccine-preventable disease. One of the national health objectives for 2010 is to maintain >95% vaccination coverage among children attending licensed child care centers and kindergarten through postsecondary school (objective 14-23) (3). To identify children who have not been vaccinated in compliance with state law, all states, five large cities (Chicago, Houston, New York, Philadelphia, and San Antonio), and eight territories conduct annual vaccination assessment surveys of coverage with basic vaccines among children enrolled in the Head Start program, enrolled in licensed child care centers, and entering kindergarten or first grade. These survey results are aggregated and analyzed by CDC to estimate national vaccination coverage. This report summarizes estimated coverage with the basic vaccines: >3 doses of polio-virus vaccine, >3 tetanus containing doses (diphtheria and tetanus toxoids and acellular pertussis vaccine [DTaP]), diphtheria and tetanus toxoids (DT), or tetanus toxoids (Td), and 1 dose each of measles, mumps, and rubella vaccines for the September 1999--June 2000 school year. Results indicate that among reporting programs, the mean coverage for all vaccines was >95% for the surveyed population. However, coverage varied from state to state, and approximately 30% of states did not submit reports. High rates of vaccination coverage must be maintained to prevent transmission of vaccine-preventable disease. States should conduct yearly assessments to maintain these rates among preschool- and school-aged children. Because state and territorial laws determine vaccine and dosage requirements for child care and school attendance (4), methods of assessing vaccination coverage, sampling procedures, and data abstraction methods varied among the 64 participating vaccination programs. Overall mean coverage levels were estimated by weighting vaccine-specific coverage levels reported by each program to the birth cohort in the program area. Data were combined for all programs that reported coverage levels for kindergarten and/or first grade. The 50 states, eight territories, five cities, and the District of Columbia (4) have vaccination programs that report findings of school-based surveys to CDC annually. During the reporting period, the 64 programs used a one page form that provided a line for reporting the proportion of children who received each of the basic antigens: >3 doses of DTaP/DT/Td, >3 doses of poliovirus vaccine, and 1 dose each of measles, mumps, and rubella vaccines. Kindergarten/First GradeOf the 64 programs, 44 (68.8%) submitted vaccination coverage levels for children enrolled in kindergarten and/or first grade (Table 1). The mean level among programs was 97.3% for poliovirus vaccine (range: 85.6%--99.9%), 97.2% for DTaP/DT/Td (range: 85.3%--99.9%), 97.1% for measles (range: 86%--100%), and 97.4% for mumps and rubella vaccines (range: 86%--100%); 38 (86.4%) programs reached the 2010 goal of >95% coverage for poliovirus vaccine and measles, mumps, and rubella vaccines, and 37 (84.1%) reached the goal for DTaP/DT/Td. Head Start ProgramsOf the 64 programs, 44 (68.8%) submitted vaccination coverage levels for children enrolled in Head Start (Table 2). The mean level among programs was 96.7% for polio-virus vaccine (range: 85%--100%), 96.6% for DTaP/DT/Td (range: 83.9%--100%), and 96.8% for measles, mumps, and rubella (range: 80%--100%) vaccines. The number of programs that reached >95% coverage was 36 (81.8%) for poliovirus vaccine, 28 (63.6%) for DTaP/DT/Td, and 37 (84.1%) for measles, mumps, and rubella vaccines. Licensed Child Care CentersOf the 64 programs, 42 (65.6%) submitted vaccination coverage levels for children enrolled in child care (Table 3). The mean level among programs was 94.6% for poliovirus vaccine (range: 75%--99.8%), 95.5% for DTaP/DT/Td (range: 76%--100%), 94.7% for measles vaccine (range: 74%--99.9%), 94.8% for mumps vaccine (range: 74%--99.9%), and 94.8% for rubella vaccine (range: 74%--99.9%); 20 (47.6%) programs reached >95% coverage for poliovirus vaccine, 23 (54.8%) for DTaP/DT/Td, and for mumps and rubella vaccines, and 22 (52.4%) for measles vaccine. Reported by: Assessment Br, Data Management Div, National Immunization Program; and an EIS Officer, CDC. Editorial Note:Since 1980, national coverage for recommended childhood vaccines among children entering school has been >90% (5). Although the incidence of vaccine-preventable disease is at an all-time low, coverage from >90% to >95% is considered necessary to prevent transmission of measles in secondary schools (5). Although national coverage remained >95% for children entering kindergarten or first grade and children enrolled in Head Start during the 1999--2000 school year, state-specific coverage levels varied, especially among children in licensed child care; these levels might have been lower because younger children, for whom the complete basic series of vaccines was not yet applicable, were included in the survey data. The findings in this report are subject to at least five limitations. First, approximately 30% of the participating programs did not submit 1999--2000 vaccination coverage data for the survey. Second, coverage estimates reported by programs might have varied because of differences in state vaccination requirements. Third, not all programs assessed vaccination coverage for all eligible children. Fourth, children attending private schools were not surveyed by all of the programs. Finally, because children at licensed child care centers represented a wide range of ages and some centers did not report the ages of all children participating in the survey, it was impossible to determine the reasons for lower coverage levels among these children. The implementation and enforcement of state vaccination requirements have resulted in high levels of coverage among the U.S. school-aged and licensed child care population attending these facilities. State requirements constitute an important component of the effort to meet 2010 objectives and ensure vaccination of children aged 5 and 6 years who had not been vaccinated during early childhood (6,7). References
Table 1 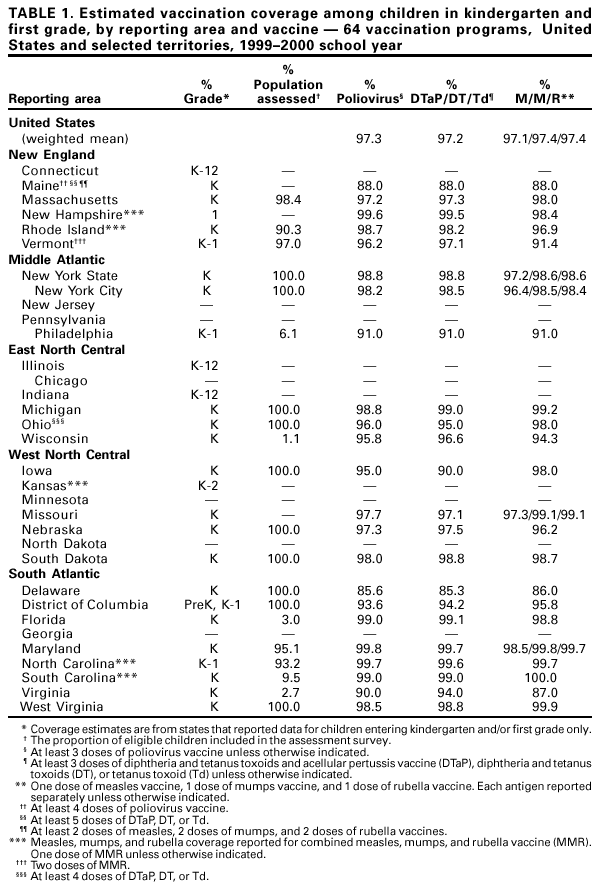  Return to top. Table 2 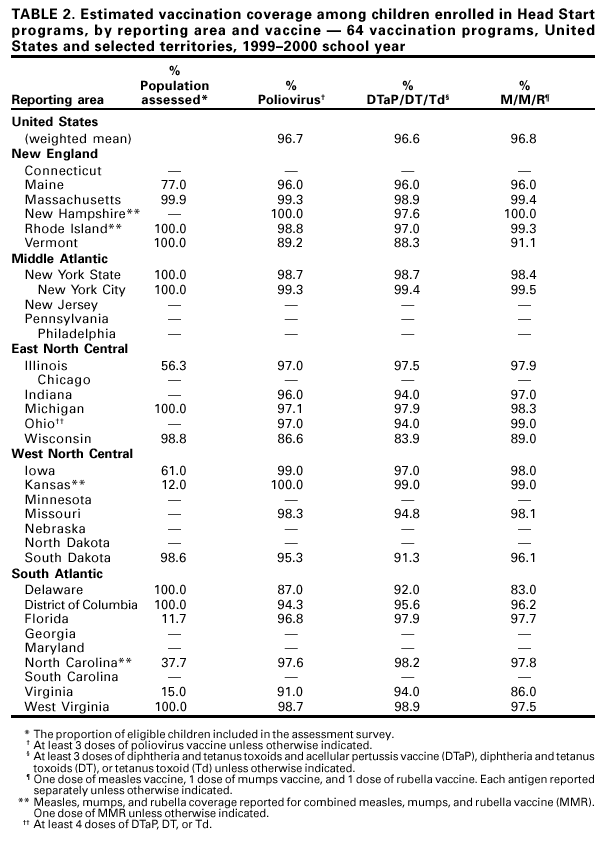  Return to top. Table 3 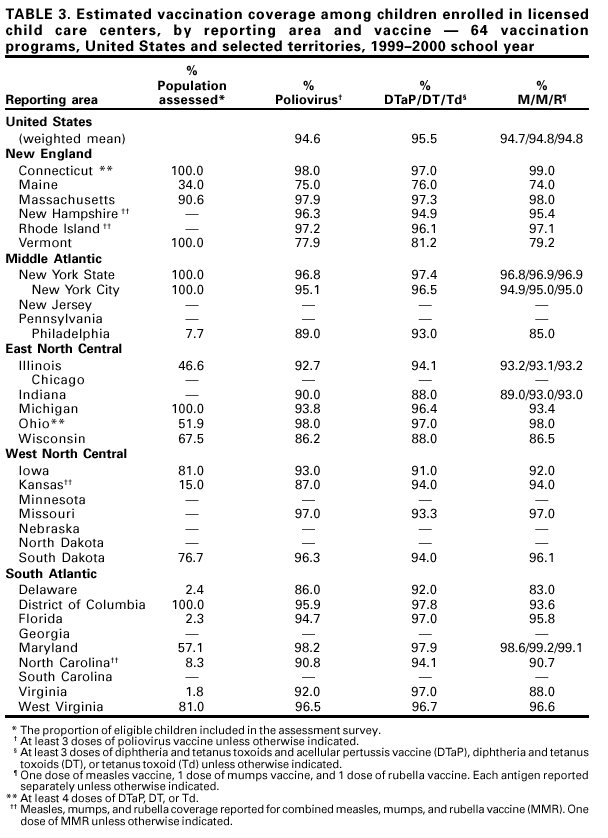  Return to top.
Disclaimer All MMWR HTML versions of articles are electronic conversions from ASCII text into HTML. This conversion may have resulted in character translation or format errors in the HTML version. Users should not rely on this HTML document, but are referred to the electronic PDF version and/or the original MMWR paper copy for the official text, figures, and tables. An original paper copy of this issue can be obtained from the Superintendent of Documents, U.S. Government Printing Office (GPO), Washington, DC 20402-9371; telephone: (202) 512-1800. Contact GPO for current prices. **Questions or messages regarding errors in formatting should be addressed to mmwrq@cdc.gov.Page converted: 10/5/2001 |
|||||||||
This page last reviewed 10/5/2001
|