 |
|
|
|
|
|
|
| ||||||||||
|
|
|
|
|
|
|
||||
| ||||||||||
|
|
|
|
|
Persons using assistive technology might not be able to fully access information in this file. For assistance, please send e-mail to: mmwrq@cdc.gov. Type 508 Accommodation and the title of the report in the subject line of e-mail. Health-Related Quality of Life --- Los Angeles County, California, 1999The overall goals of the national health objectives for 2010 are to increase the quality and years of healthy life and eliminate health disparities in the U.S. population (1). To assess progress in achieving these goals, the Behavioral Risk Factor Surveillance System (BRFSS) includes a core set of four health-related quality of life (HRQOL) questions that have been used since 1993 to track adults' perceptions of their physical and mental health and level of function (2). Data on HRQOL have been reported nationwide (2) and by state (3) but typically not at the county or community level. This report summarizes findings of the 1999--2000 Los Angeles County Health Survey (LACHS) on HRQOL in the county's adult population and describes variations in HRQOL across population groups in the county. The findings have been published in a county health report and are being used by public health officials to highlight the significant disparities in HRQOL across demographic and socioeconomic populations in Los Angeles County and to guide program planning and resource allocation decisions. LACHS is a random-digit--dialed telephone survey of the noninstitutionalized population in Los Angeles County (4). The adult (persons aged >18 years) component of the survey was conducted during September--December 1999. Of 15,301 adults eligible for participation, 8354 (54.6%) completed the survey. Interviews were offered in English, Spanish, Cantonese, Mandarin, Korean, and Vietnamese. All respondents were asked 1) "Would you say that in general your health is excellent, very good, good, fair, or poor?"; 2) "Now thinking about your physical health, which includes physical illness and injury, for how many days during the past 30 days was your physical health not good?"; 3) "Now thinking about your mental health, which includes stress, depression, and problems with emotions, for how many days during the past 30 days was your mental health not good?"; and 4) "During the past 30 days, for about how many days did poor physical or mental health keep you from doing your usual activities, such as self-care, work, or recreation?" Responses were analyzed to estimate the percentage of adults who report poor or fair health, the mean number of days of impaired physical or mental health during the preceding 30 days* (i.e., unhealthy days), and the mean number of days when activities were limited because of poor health during the preceding 30 days (i.e., activity limitation days). Data were weighted to reflect the age, sex, and racial/ethnic distribution of the county population using 1999 census projections. Results were stratified by sex, age, race/ethnicity, poverty level based on household income, education, and whether the respondent had ever been diagnosed with selected common chronic health conditions (i.e., heart disease, diabetes, depression, arthritis, and asthma†). To enable comparisons within and across these strata, results were age-standardized to the 2000 U.S. population aged >18 years. Overall, 21.9% of respondents rated their health as poor or fair (Table 1). The percentage of persons who reported poor or fair health was highest for those who had annual household incomes below the 1999 federal poverty level§ (FPL) (42.3%), had less than a high school education (41.7%), were Hispanic (35.6%), and were aged >65 years (30.2%). Among persons ever diagnosed with one of the chronic health conditions, the percentage that reported poor or fair health was highest for those ever diagnosed with diabetes (50.0%). The mean number of unhealthy days during the preceding 30 days was 6.5 for all respondents and was highest for those who had annual household incomes below the FPL (8.5), for blacks (8.3), and for those aged 50--64 years (7.6). The mean number of unhealthy days was higher for women (7.3) than for men (5.7), and was higher for those who had less than a college education (6.9) than for those who were college graduates (5.5). The mean number of unhealthy days was three times higher for those ever diagnosed with depression (16.7) than for those not diagnosed with depression (5.5). The mean number of unhealthy days was significantly higher for persons diagnosed with each of the other chronic health conditions studied than for those not diagnosed with the condition. The mean number of activity limitation days during the preceding 30 days was 2.5 days overall, and was highest for blacks (3.5), those with annual household incomes <200% of FPL (3.4), and those aged 50--64 years (3.1). The mean number of activity limitation days was higher for those with less than a college education (2.8) than for those who were college graduates (1.7). The mean number of activity limitation days was more than three times higher for those ever diagnosed with depression (7.5) than for those not diagnosed with depression (2.0). The mean number of activity limitation days was significantly higher for persons diagnosed with each of the other chronic health conditions studied than for those not diagnosed with the condition. Reported by: P Simon, MD, A Lightstone, Z Zeng, MD, C Wold, J Fielding, MD, Los Angeles County Dept of Health Svcs, Los Angeles; B Davis, California Dept of Health Svcs. Health Care and Aging Studies Br, Div of Adult and Community Health, National Center for Chronic Disease Prevention and Health Promotion, CDC. Editorial Note:Local health departments (LHDs) and their community partners require population health data at the municipal level and below to guide program planning, resource allocation, and policy development. HRQOL data are an important adjunct to more traditional measures of morbidity and mortality often used by LHDs to assess population health (5). This study identified important variations in HRQOL within the Los Angeles County adult population. Disparities in HRQOL were greatest across socioeconomic strata and were consistent with studies that have documented strong associations between lower socioeconomic status and poorer health outcomes, including shorter life expectancy and higher rates of many infectious and noninfectious diseases (6). Stratified multivariate analyses of these data are planned to examine whether other subgroup disparities occurred that were independent of socioeconomic status. The findings also quantify the perceived burden of selected chronic health conditions on HRQOL in the county's adult population. Because locally acquired HRQOL data reflect personal and community health concerns and are intuitively understandable by the general population, these data can be an important tool for mobilizing public health and community stakeholders, health-care providers, and policymakers to increase resource allocations, improve access to services, and identify more effective chronic disease prevention and treatment interventions (7). HRQOL measures also can be used to assess the effectiveness of these efforts, including the quality of health-care services and the impact of public health interventions (8). Use of the standard set of CDC HRQOL measures may enable population comparisons with public domain data (e.g., from BRFSS) and findings from prevention research based on these measures. The findings in this report are subject to at least four limitations. First, because households without telephones or with only cellular telephones were excluded from the sampling frame, the results do not include a segment of the population that may be at increased risk for reduced HRQOL. Second, the low response rate may have introduced bias (9). However, the distribution of respondents by age group, sex, race/ethnicity, and geographic region corresponded with that of independent county adult population estimates. Third, the sample may underrepresent severely impaired adults because effort and functional capacity are required to participate in the survey. Finally, the variation in HRQOL by race/ethnicity may, in part, reflect language and/or cultural differences in the interpretation of the survey questions (10). Community HRQOL assessment data, when combined with demographic, mortality, morbidity, disability, behavioral risk, and related socioeconomic and environmental data, provide local health agencies with a vital planning and evaluation resource. This community health status assessment resource was envisioned in the Mobilizing for Action through Planning and Partnerships (MAPP) process developed by the National Association of County and City Health Officials. The HRQOL findings from the 1999 LACHS are being used by policymakers and in community discussions about the impact of physical and mental health problems in the county. To guide program planning and to compare with similar national and state population health assessments, local health agencies periodically should assess community HRQOL with standard measures. References
* Calculated by adding the number of impaired physical health days and impaired mental health days up to a maximum of 30 days (2). † Included adults ever diagnosed with asthma and who had one or more wheezing episodes during the preceding 12 months. § For example, the federal poverty level for a family of two adults and two dependents in 1999 was an annual household income of $16,895. Table 1 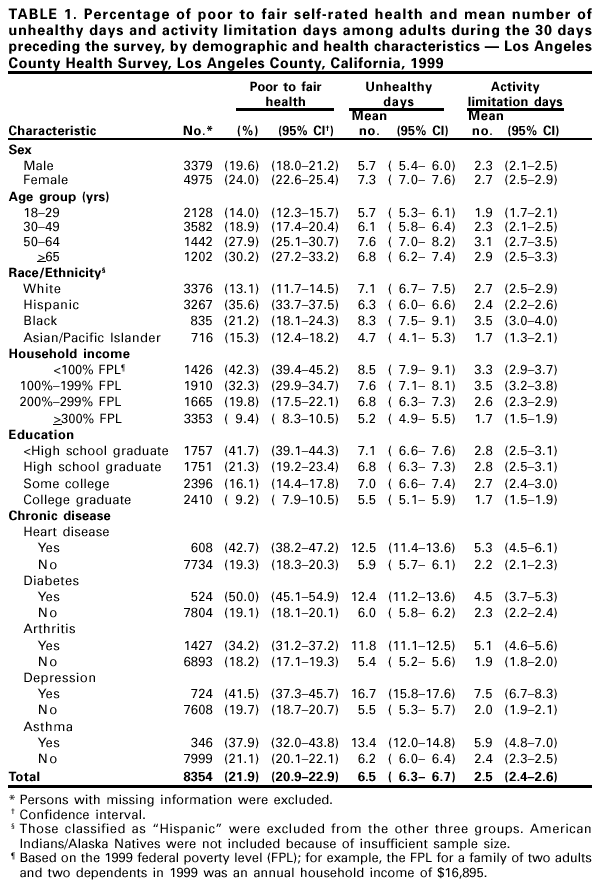 Return to top. Disclaimer All MMWR HTML versions of articles are electronic conversions from ASCII text into HTML. This conversion may have resulted in character translation or format errors in the HTML version. Users should not rely on this HTML document, but are referred to the electronic PDF version and/or the original MMWR paper copy for the official text, figures, and tables. An original paper copy of this issue can be obtained from the Superintendent of Documents, U.S. Government Printing Office (GPO), Washington, DC 20402-9371; telephone: (202) 512-1800. Contact GPO for current prices. **Questions or messages regarding errors in formatting should be addressed to mmwrq@cdc.gov.Page converted: 7/6/2001 |
|||||||||
This page last reviewed 7/6/2001
|