 |
|
|
|
|
|
|
| ||||||||||
|
|
|
|
|
|
|
||||
| ||||||||||
|
|
|
|
|
Persons using assistive technology might not be able to fully access information in this file. For assistance, please send e-mail to: mmwrq@cdc.gov. Type 508 Accommodation and the title of the report in the subject line of e-mail. State Differences in Reported Healthy Days Among Adults -- United States, 1993-1996Traditional population health measures, such as infant mortality rates, vaccination rates, and average life expectancy, have emphasized morbidity and mortality. During the past decade, weighted indices of population health (e.g., years of healthy life and disability-adjusted life-years), which combine life expectancy with aspects of health-related quality of life (HRQOL), have provided more comprehensive summary measures (1). To meet the need for a less complex measure that is more sensitive to local variations in population health, CDC developed the "healthy days" index. This HRQOL index tracks the number of healthy days (i.e., days when persons' physical and mental health were both good) during the preceding 30 days for a specific population (2-5). This report describes state differences for 1993-1996 in the mean number of healthy days reported by adults, including large differences within each state by level of formal education. The healthy days index is part of CDC's Behavioral Risk Factor Surveillance System (BRFSS), an ongoing, state-based, random-digit-dialed telephone survey of the noninstitutionalized U.S. population aged greater than or equal to 18 years. The system tracks the prevalence of important health- and safety-related behaviors. The healthy days index derives from two standard BRFSS questions about the estimated number of days during the preceding 30 days when physical health (including "physical illness and injury") or mental health (including "stress, depression, and problems with emotions") was not good. This number is subtracted from 30, and the remainder is the estimated number of healthy days during the preceding 30 days. To enable comparisons, data were age-standardized to the 1990 U.S. population aged greater than or equal to 18 years and were weighted to reflect the age, racial/ethnic, and sex distribution of the state population (6). Some analyses were restricted to the 15% of adult respondents who had less than a high school education, an important socioeconomic group * with high percentages of persons in low-income households (42%), persons in racial/ethnic minority groups (40%), uninsured persons (30%), and persons who are unemployed or have a severe work disability (19%). During 1993-1996, the overall state-weighted mean number of healthy days during the preceding 30 days for all adults was 24.7, ranging from 23.7 (Kentucky and Nevada) to 26.0 (South Dakota) (pless than 0.05; weighted z-test after adjustment for multiple comparisons) (Table_1). ** For this 4-year period, in comparison with the overall mean number, 10 states (California, Colorado, Florida, Indiana, Kentucky, Massachusetts, Michigan, Nevada, Oregon, and Rhode Island) had statistically lower mean numbers of healthy days. Fourteen states (Connecticut, Georgia, Hawaii, Illinois, Iowa, Kansas, Maine, Maryland, New Jersey, North Carolina, Ohio, Oklahoma, South Dakota, and Tennessee) had statistically higher mean numbers of healthy days. Overall, persons with less than a high school education had a mean number of 22.8 healthy days; high school graduates or equivalent with no college degree, 24.7 days; and college graduates, 26.0 days. In each state and the District of Columbia, the mean number of healthy days was higher for persons who had higher educational levels; the exception was Alaska, in which high school graduates with no college degree had a mean number of 0.2 fewer healthy days than persons with less education. For 1993-1996, mean numbers of healthy days by state for adults with less than a high school education were grouped by quartile and evaluated for geographic patterns (Figure_1). Each Bureau of the Census region (i.e., Northeast, North Central, South, and West) had one or more states in the highest quartile (i.e., greater than or equal to 23.5 healthy days) and one or more states in the lowest quartile (i.e., less than or equal to 22.0 healthy days). Kentucky (21.3 healthy days) had a significantly lower mean, and Alaska (24.8) and North Carolina (24.5) had significantly higher means, than the overall mean for persons with less than a high school education. Reported by the following BRFSS coordinators: J Cook, Alabama, MBA; P Owen, Alaska; B Bender, MBA, Arizona; J Senner, PhD, Arkansas; B Davis, PhD, California; M Leff, MSPH, Colorado; M Adams, MPH, Connecticut; F Breukelman, Delaware; C Mitchell, District of Columbia; D McTague, MS, Florida; K Powell, MD, Georgia; A Onaka, PhD, Hawaii; J Aydelotte, Idaho; B Steiner, MS, Illinois; K Horvath, Indiana; A Wineski, Iowa; M Perry, Kansas; K Asher, Kentucky; R Meriwether, MD, Louisiana; D Maines, Maine; A Weinstein, MA, Maryland; D Brooks, MPH, Massachusetts; H McGee, MPH, Michigan; N Salem, PhD, Minnesota; D Johnson, Mississippi; T Murayi, PhD, Missouri; F Ramsey, Montana; S Huffman, Nebraska; E DeJan, MPH, Nevada; K Zaso, MPH, New Hampshire; G Boeselager, MS, New Jersey; W Honey, MPH, New Mexico; T Melnik, DrPH, New York; K Passaro, PhD, North Carolina; J Kaske, MPH, North Dakota; R Indian, MS, Ohio; N Hann, MPH, Oklahoma; J Grant-Worley, MS, Oregon; L Mann, Pennsylvania; J Hesser, PhD, Rhode Island; M Lane, MPH, South Carolina; M Gildemaster, South Dakota; D Ridings, Tennessee; K Condon, Texas; R Giles, Utah; C Bennett, PhD, Vermont; L Redman, MPH, Virginia; K Wynkoop-Simmons, PhD, Washington; F King, West Virginia; P Imm, MS, Wisconsin; M Futa, MA, Wyoming. Health Care and Aging Studies Br, Div of Adult and Community Health, National Center for Chronic Disease Prevention and Health Promotion, CDC. Editorial NoteEditorial Note: Asking randomly selected adults to report the number of days during the preceding 30 days when physical and mental health were good provides valid and useful data about the overall health of communities (2-5). The composite healthy days index used in the BRFSS since January 1993 indicates statistically significant differences in overall adult health by state. In almost all states, the number of healthy days also differed significantly by educational level. This difference reinforces the findings of other studies that suggest major improvements in population health may not be possible without reducing disparities between lower and higher socioeconomic groups. In addition, the significant differences found among some states for adults with less than a high school education indicate that such persons experience higher HRQOL in some states than in others. However, the ability of the index to detect and isolate the effects of particular state policies, such as welfare reform and managed health-care programs, remains untested. Subsequent analyses will examine HRQOL differences among potentially vulnerable subgroups, including reproductive-aged women, unemployed persons, persons without health insurance, persons with disabilities, and older persons. The healthy days index has good construct validity in other published analyses and has performed acceptably in construct, criterion, and known-groups validity in a general population comparison with the widely used and validated Medical Outcomes Study Short Form 36 (SF-36) *** (7). In that comparison, the individual components of the healthy days index (recent physical and mental health) also had acceptable validity and correlated most strongly with the related SF-36 scales. The striking persistence of large differences in healthy days across socioeconomic groups in each state further supports the construct validity of the index in this study. The findings in this report are subject to at least three limitations. First, because the BRFSS excludes households without telephones, the findings may overestimate average numbers of healthy days for groups with lower socioeconomic status. Second, the BRFSS may underrepresent persons at a low level of health and functioning, because time and functional capacity are needed to complete the survey. Third, differences by state also may reflect differences in population composition, socioeconomic factors, climate, natural and human-made disasters, environmental quality, and other unknown factors. The substantial amount of BRFSS data concerning healthy days and related HRQOL items being collected by state health agencies (greater than 500,000 adults were surveyed through 1997) provides public health planners with valuable information that can be used to help set population health goals and objectives (8) and to monitor performance of health programs over time (9,10). The BRFSS data described in this report indicate that the mean number of healthy days differs by state and by subpopulations within each state, suggesting that public health and social strategies must be tailored to specific populations, including persons who have lower levels of education, to ensure that community health objectives can be met. References
Educational status was used as a proxy for low socioeconomic status in lieu of household income because of a change (in 1995-1996) in the BRFSS question about income that limited comparability with earlier years. ** The District of Columbia was not included in state comparisons, but in 1993-1996 it reported a higher overall mean number of healthy days than any of the states. *** The SF-36 is a set of 36 survey questions and associated subscales designed to measure key aspects of HRQOL in patient and community populations, whereas the healthy days index is designed to provide a concise summary estimate of HRQOL in community populations. Table_1 Note: To print large tables and graphs users may have to change their printer settings to landscape and use a small font size.
TABLE 1. Mean number of "healthy days" among adults, * by state and educational
level -- United States, Behavioral Risk Factor Surveillance System, 1993-1996
========================================================================================================
                                                      Educational level
                          ----------------------------------------------------------------------------
                              All              Less than             High school
                           education          high school             graduate/             College
                             levels             graduate             Some college           graduate
                          ------------       --------------        ----------------       ------------
State                     Mean    SE +       Mean       SE         Mean         SE        Mean     SE
------------------------------------------------------------------------------------------------------
Alabama                   25.0    0.12       22.2      0.40        25.3        0.15       26.5    0.22
Alaska                    25.1    0.19       24.8      0.54        24.6        0.25       26.7    0.31
Arizona                   25.1    0.14       23.4      0.53        25.0        0.17       26.2    0.24
Arkansas                  24.7    0.13       23.0      0.40        24.9        0.16       26.1    0.26
California                24.1    0.09       22.7      0.29        23.9        0.12       25.2    0.17
Colorado                  24.2    0.12       22.4      0.51        23.7        0.17       25.8    0.19
Connecticut               25.6    0.11       23.7      0.49        25.4        0.15       26.6    0.19
Delaware                  24.8    0.12       23.1      0.44        24.8        0.15       25.7    0.23
District of Columbia      26.5    0.14       24.1      0.62        26.7        0.18       26.8    0.24
Florida                   24.3    0.09       21.5      0.35        24.3        0.12       25.5    0.18
Georgia                   25.2    0.11       22.9      0.34        25.7        0.14       26.3    0.21
Hawaii                    25.8    0.10       23.9      0.63        25.8        0.13       26.1    0.21
Idaho                     24.6    0.11       22.8      0.42        24.5        0.14       25.8    0.22
Illinois                  25.4    0.10       23.0      0.40        25.4        0.13       26.3    0.18
Indiana                   23.9    0.11       21.5      0.39        23.9        0.14       25.7    0.23
Iowa                      25.4    0.09       23.3      0.42        25.3        0.11       26.3    0.18
Kansas                    25.8    0.11       23.9      0.54        25.6        0.13       26.8    0.17
Kentucky                  23.7    0.11       21.3      0.32        24.3        0.15       25.3    0.23
Louisiana                 24.8    0.13       23.1      0.39        24.9        0.16       26.3    0.22
Maine                     25.5    0.13       23.5      0.50        25.6        0.17       26.4    0.25
Maryland                  25.5    0.08       23.0      0.35        25.4        0.10       26.4    0.13
Massachusetts             24.1    0.13       22.6      0.48        23.5        0.18       25.7    0.18
Michigan                  24.3    0.10       22.1      0.41        24.1        0.13       25.7    0.18
Minnesota                 24.6    0.08       22.3      0.47        24.4        0.11       25.7    0.15
Mississippi               25.0    0.13       22.8      0.38        25.3        0.17       26.8    0.24
Missouri                  24.5    0.14       21.9      0.46        24.3        0.18       26.3    0.20
Montana                   24.9    0.13       23.1      0.60        24.8        0.17       26.0    0.27
Nebraska                  25.2    0.15       21.6      0.70        25.1        0.18       26.2    0.22
Nevada                    23.7    0.14       21.0      0.65        23.6        0.17       24.8    0.34
New Hampshire             25.0    0.13       22.5      0.56        24.9        0.17       26.2    0.20
New Jersey                25.3    0.12       23.6      0.48        25.0        0.17       26.3    0.20
New Mexico                24.6    0.16       22.0      0.62        24.5        0.21       25.9    0.25
New York                  24.6    0.10       23.7      0.30        24.5        0.14       25.2    0.18
North Carolina            25.8    0.09       24.5      0.26        25.9        0.12       26.8    0.19
North Dakota              24.5    0.12       22.9      0.59        24.6        0.14       25.6    0.24
Ohio                      25.4    0.13       23.1      0.45        25.5        0.17       26.8    0.22
Oklahoma                  25.9    0.12       23.7      0.46        26.0        0.15       26.8    0.23
Oregon                    24.4    0.10       21.9      0.39        24.1        0.12       25.8    0.17
Pennsylvania              24.6    0.10       21.9      0.37        24.6        0.12       26.1    0.16
Rhode Island              23.9    0.15       22.3      0.48        23.7        0.20       25.3    0.25
South Carolina            25.1    0.12       23.5      0.34        25.2        0.16       26.0    0.23
South Dakota              26.0    0.10       23.8      0.37        26.1        0.13       27.1    0.19
Tennessee                 25.2    0.09       22.8      0.28        25.5        0.12       26.8    0.18
Texas                     24.4    0.13       22.4      0.39        24.1        0.18       26.0    0.25
Utah                      24.3    0.11       21.5      0.47        24.1        0.14       25.6    0.21
Vermont                   24.7    0.11       22.6      0.44        24.5        0.15       26.0    0.17
Virginia                  25.1    0.12       23.1      0.41        24.9        0.16       26.2    0.19
Washington                24.4    0.09       21.5      0.42        24.1        0.12       25.9    0.14
West Virginia             24.6    0.11       22.0      0.33        25.1        0.13       26.6    0.21
Wisconsin                 24.7    0.12       22.2      0.51        24.7        0.15       25.6    0.24
Wyoming                   24.9    0.14       23.1      0.62        24.8        0.16       25.8    0.25

All respondents           24.7    0.02       22.8      0.08        24.7        0.03       26.0    0.04
------------------------------------------------------------------------------------------------------
* Total sample size=431,996; age-adjusted to the 1990 U.S. population aged >= 18 years.
+ Standard error.
========================================================================================================
Return to top. Figure_1 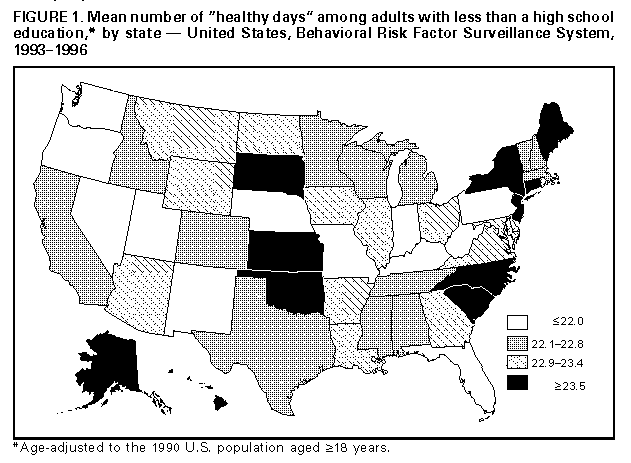 Return to top. Disclaimer All MMWR HTML versions of articles are electronic conversions from ASCII text into HTML. This conversion may have resulted in character translation or format errors in the HTML version. Users should not rely on this HTML document, but are referred to the electronic PDF version and/or the original MMWR paper copy for the official text, figures, and tables. An original paper copy of this issue can be obtained from the Superintendent of Documents, U.S. Government Printing Office (GPO), Washington, DC 20402-9371; telephone: (202) 512-1800. Contact GPO for current prices. **Questions or messages regarding errors in formatting should be addressed to mmwrq@cdc.gov.Page converted: 10/05/98 |
|||||||||
This page last reviewed 5/2/01
|