 |
|
|
|
|
|
|
| ||||||||||
|
|
|
|
|
|
|
||||
| ||||||||||
|
|
|
|
|
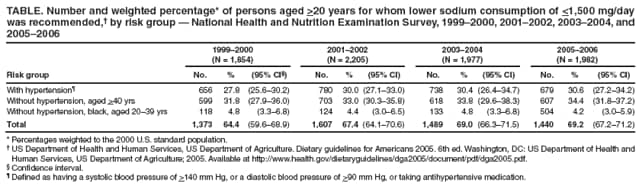
Persons using assistive technology might not be able to fully access information in this file. For assistance, please send e-mail to: mmwrq@cdc.gov. Type 508 Accommodation and the title of the report in the subject line of e-mail. Application of Lower Sodium Intake Recommendations to Adults --- United States, 1999--2006In 2005--2006, an estimated 29% of U.S. adults had hypertension (i.e., high blood pressure), and another 28% had prehypertension (1). Hypertension increases the risk for heart disease and stroke (2), the first and third leading causes of death in the United States (3). Greater consumption of sodium can increase the risk for hypertension (4). The main source of sodium in food is salt (sodium chloride [NaCl]); uniodized salt is 40% sodium by weight. In 2005--2006, the estimated average intake of sodium among persons in the United States aged >2 years was 3,436 mg/day (5). In 2005, the U.S. Department of Health and Human Services and U.S. Department of Agriculture recommended that adults in the United States should consume no more than 2,300 mg/day of sodium (equal to approximately 1 tsp of salt), but those in specific groups (i.e., all persons with hypertension, all middle-aged and older adults, and all blacks) should consume no more than 1,500 mg/day of sodium (6). To estimate the proportion of the adult population for whom the lower sodium recommendation is applicable, CDC analyzed data from the National Health and Nutrition Examination Survey (NHANES) for the period 1999--2006. The results indicated that, in 2005--2006, the lower sodium recommendation was applicable to 69.2% of U.S. adults. Consumers and health-care providers should be aware of the lower sodium recommendation, and health-care providers should inform their patients of the evidence linking greater sodium intake to higher blood pressure. NHANES is an ongoing series of cross-sectional surveys on health and nutrition designed to be nationally representative of the noninstitutionalized, U.S. civilian population by using a complex, multistage probability design. All NHANES surveys include a household interview followed by a detailed physical examination, including blood pressure tests.* Data from four NHANES survey periods (1999--2000, 2001--2002, 2003--2004, and 2005--2006) were used to estimate the percentages of U.S. adults in the three risk groups for whom lower sodium intake of <1,500 mg/per day was recommended in 2005.† To represent the three risk groups, three nonoverlapping populations were defined for the analysis: all adults aged >20 years with hypertension, all adults aged >40 years without hypertension, and blacks aged 20--39 years without hypertension (6). Participants first were categorized as having hypertension or not having hypertension, using an average of two or more blood pressure measurements (87% of the sample had three or more measurements). Hypertension was defined as having systolic blood pressure of >140 mm Hg, or diastolic blood pressure of >90 mm Hg, or taking antihypertension medication; prehypertension was defined as systolic blood pressure of 120--139 mm Hg or diastolic blood pressure of 80--89 mm Hg, and not taking antihypertension medication. Overall for the four survey periods, 22% of participants with hypertension had normal blood pressure readings but were categorized with hypertension because they self-reported taking antihypertension medication. Percentage estimates and 95% confidence intervals (CIs) were calculated using statistical software to account for nonresponse and complex sampling design. The significance of linear trend across survey periods was determined by using orthogonal polynomial coefficients calculated recursively. Overall in 2005--2006, 69.2% of U.S. adults aged >20 years (approximately 145.5 million persons) met the criteria for the risk groups recommended for lower sodium consumption of <1,500 mg/day. Among adults aged >20 years, 30.6% were found to have hypertension; 34.4% did not have hypertension but were aged >40 years, and 4.2% did not have hypertension but were black and aged 20--39 years (Table). The overall percentage of persons in these risk groups increased significantly over the four NHANES study periods: 64.4% in 1999--2000, 67.4% in 2001--2002, 69.0% in 2003--2004, and 69.2% in 2005--2006 (p for linear trend = 0.05) (Table). Reported by: C Ayala, PhD, EV Kuklina, MD, PhD, J Peralez, MPH, NL Keenan, PhD, DR Labarthe, MD, PhD, Div for Heart Disease and Stroke Prevention, National Center for Chronic Disease Prevention and Health Promotion, CDC. Editorial Note:Although the federal dietary guidelines were published 4 years ago, the percentage of U.S. residents to whom the lower sodium recommendation is applicable has never been reported. The findings in this report indicate that, using 2005--2006 NHANES data, the maximum daily sodium consumption of 1,500 mg recommended in 2005 applied to nearly 70% of U.S. residents aged >20 years. If the recommendation had been in effect during 1999--2006, the percentage of persons for whom it applied would have increased from 64.4% in 1999--2000 to 69.2% in 2005--2006. Previous NHANES results have indicated that the average daily sodium intake among persons in the United States aged >2 years increased from 3,329 mg in 2001--2002 to 3,436 mg in 2005--2006 (5), exceeding in each period even the higher sodium intake limit of 2,300 mg/day recommended in 2005. Sodium reduction is recommended for persons with hypertension and as a first line of intervention for persons with prehypertension (2). Public health actions to reduce sodium intake likely will include 1) reducing the sodium content of processed foods; 2) encouraging consumption of more low-sodium foods, such as fruits and vegetables; and 3) providing more relevant information about sodium in food labeling. A randomized trial showed that the perceived pleasantness of highly salted food was based on dietary habit and that this perception could be changed by gradual reduction of dietary intake of sodium (7). The current daily percentage value for sodium in the nutrition facts panel of packaged foods is based on a previous federal guideline of 2,400 mg/day and is likely to mislead the majority of consumers, for whom the 1,500 mg/day limit is applicable. In addition, health-care professionals can counsel all patients regarding dietary salt intake and recommend that they adopt an eating plan such as the Dietary Approaches to Stop Hypertension Diet, which is reduced in sodium and rich in potassium and calcium (8) and has been shown to decrease blood pressure among persons with and without hypertension. The findings in this report are subject to at least one limitation. NHANES data are restricted to the noninstitutionalized population, excluding persons who reside in long-term care facilities or correctional facilities. Inclusion of these populations likely would increase the percentage of the population for whom the recommended 1,500 mg/day sodium limit is applicable. The World Health Organization has set a global target for maximum intake of salt for adults at 5 g/day (i.e., 2,000 mg/day of sodium) or lower if specified by national targets, such as the recommendation in the United States (9). Eleven countries in the European Union have agreed to reduce salt intake by 16% over the next 4 years (10). In the United States, Healthy People 2010 calls for increasing to 95% the proportion of adults with high blood pressure who are taking action (e.g., reducing sodium intake) to help control their blood pressure (objective 12-11). Recent examples of public health strategies to reduce sodium consumption include a New York City campaign to reduce sodium content in restaurant and processed foods.§ References
* Additional information available at http://www.cdc.gov/nchs/data/nhanes/databriefs/calories.pdf. † The recommendation was based on dietary reference intakes published by the Institute of Medicine (4). § Information available at http://www.nyc.gov/html/doh/html/cardio/cardio-salt-initiative.shtml.
All MMWR HTML versions of articles are electronic conversions from typeset documents. This conversion might result in character translation or format errors in the HTML version. Users are referred to the electronic PDF version (http://www.cdc.gov/mmwr) and/or the original MMWR paper copy for printable versions of official text, figures, and tables. An original paper copy of this issue can be obtained from the Superintendent of Documents, U.S. Government Printing Office (GPO), Washington, DC 20402-9371; telephone: (202) 512-1800. Contact GPO for current prices. **Questions or messages regarding errors in formatting should be addressed to mmwrq@cdc.gov.Date last reviewed: 3/26/2009 |
|||||||||
|