
|
|
Volume
2:
No. 2, April 2005
SPECIAL TOPIC
Childhood Obesity — What We
Can Learn From Existing Data on Societal Trends, Part 2
Roland Sturm, PhD
Suggested citation for this article: Sturm R. Childhood obesity — what we can
learn from existing data on societal trends, part 2. Prev Chronic Dis [serial
online] 2005 Apr [date cited]. Available from: URL:
http://www.cdc.gov/pcd/issues/2005/
apr/04_0039.htm.
PEER REVIEWED
Part 2 of 2
Abstract
The number of overweight and obese youth has increased in recent decades,
yet few data assess how the lives of children have changed during the
“obesity epidemic.” Part 1 of this two-part study discussed trends in time
use, studying at home, and media use. Part 2 focuses on transportation,
physical education, and diet.
Walking or biking for transportation can expend a large amount of energy,
but active transportation is not a major source of physical activity for
youth, averaging eight minutes a day in 2001, with little change over the
past few decades. For adolescents, there was no clear trend in physical
education during the past decade, but there are no data for after-school and
day-care programs, which have become more important as children spend more
time away from home. For younger children, time spent in organized sports
and outdoor activities increased by 73 minutes per week between 1981 and
1997.
Eating as a primary activity declined, suggesting a shift toward snacking
or eating as a secondary activity. Statistically significant trends exist
for carbohydrate intake, especially for chips/crackers/popcorn/pretzels
(intake tripled from the mid-1970s to the mid-1990s) and soft drinks (intake
doubled during the same period). Price and income data suggest possible economic reasons
for these changes. The
percentage of disposable income spent on food has declined continuously, and
almost all of the decline has been represented by food consumed at home, yet today’s
disposable income buys more calories than it has in the past. Relative prices
have
encouraged shifts across food types. From a baseline of 100 during 1982–84, the price
index for fresh fruit and vegetables increased to 258 by 2002 (far exceeding
general inflation), whereas the price index for soft drinks increased only
to 126
by 2002 (below general inflation).
Back to top
Introduction
The number of overweight and obese youth has been increasing, reflecting
changes in social and environmental factors that need to be understood and
modified for effective prevention (1-3). This two-part report reviews some
data available to track how the lives of children have changed during the
“obesity epidemic.” Part 1 reviewed changes in time use, homework, and media use;
Part 2 reviews transportation, physical education (PE), and
diet.
Active transportation, such as walking or biking, can expend a large
amount of energy, and it has been hypothesized that increased
suburbanization reduces walking and biking. Only recently have
transportation patterns and urban design in relation to physical activity
and health attracted interest. Although research has been limited to
cross-sectional comparisons and adults, it has shown an association between
increases in sprawl and decreases in leisure time and utilitarian walking
and increases in body mass index and chronic health conditions (4,5). Only
the National Household Travel Survey (NHTS) provides national data for youth
travel; it is discussed in the next section of this paper.
We saw in Part 1 that children now spend more time away from home than in
the past. As a result, physical activity in school, after-school programs,
and day-care settings plays a more important role in determining physical
activity levels of children. Limited data are available on physical activity
among high school students, which are discussed below, and there are few
other data.
Many of the most prominent hypotheses on weight gain address changes in
food and diet and the roles of such factors as soft drinks, vending
machines, snacks, fast food, and portion sizes. In contrast to the
availability of data on PE and transportation, there is a vast scholarly
literature on dietary change, and this paper cannot do justice to such a
broad area. An Institute of Medicine report on preventing childhood obesity provides a more comprehensive list of citations
(6). In addition, the U.S. Department of Agriculture’s (USDA’s) Economic
Research Service regularly updates
macroeconomic data in the Food Consumption Data System (7). Nevertheless, interesting data are available on
relative food price changes and trends in the eating patterns of children
that, while well known among researchers in the nutrition field, do not
appear to be widely known among the broader research community interested in
child health.
Back to top
Transportation
Transportation is an important part of everyday life. American adults
spend more than 10 hours per week traveling, about equally divided among
transportation related to occupation (work commute), home activities (child
care/shopping/personal care), and leisure-time activities (8). Adult
transportation and leisure time have increased at the
expense of occupation and household activities, with particularly large
increases before 1985.
The only national data that provide somewhat comparable data over
multiple years are the Nationwide Personal Transportation Surveys (NPTS),
now called the NHTS, conducted in 1969,
1977, 1983, 1990, 1995, and 2001 by the U.S. Department of Transportation
(9).
Walking is generally more underestimated than other transportation modes,
and only the 2001 survey probed for walking trips. For our purposes, we use
only three years: 1977, 1990, and 2001. There is no walking information in
the 1969 survey; the 1983 sample was small and not representative for
children; and the 1995 data neglected walking and biking trips. Although the
data are intended to be nationally representative, the consistency of
methods and quality of data collection is noticeably lower than for the
time-use and education data reported in Part 1 of this paper. Thus, while
the transportation data discussed in this article are likely to indicate true secular changes, readers should
view them with greater skepticism. We do not show statistical significance
tests because the main source of uncertainty stems from design changes, not
from statistical uncertainty, and statistical tests would suggest more
precision than there really is.
The Table shows the share of trips (one-way short- or long-distance
travel) by transportation mode for children
aged five to 15 years. No clear trend is visible, especially no precipitous
decline of walking. Somewhat surprising is the very large increase in the
role of school buses between 1977 and 1990, which subsequently declined (and
could very well be a methods artifact).
Travel to and from school is a regular, predictable, and important part
of children’s travel, even if these trips account only for a minority of all trips.
Policy influences how children travel to school more than it influences
other travel modes because of decisions on school location or busing, so
policy offers better opportunities for interventions in school
transportation than it does in other areas. Figure 1 shows a clear and
significant decline in the percentage of walking trips for children aged
five to 15 years. The trend is
slightly stronger for adolescents, dropping from 20.9% in 1977 to 13.6% in
1990 to 10.9% in 2001 (data on adolescents only not shown). Because the total number of school trips does not
change much, it seems safe to say that physical activity associated
with getting to and from school has declined, despite data limitations.
These are probably the best available numbers for youth transportation
choices, but they do not provide a complete picture and in isolation are
even misleading because school trips are only a small part of total trips,
and other trips have not remained constant.
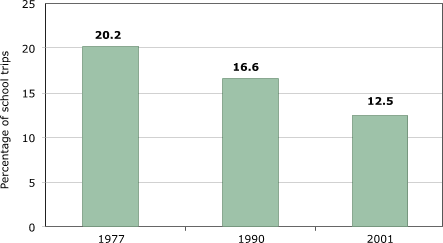
Figure 1.
Walking to school as percentage of school trips among U.S. children aged
five to 15 years. Author’s analysis based on data from National Personal Transportation Survey
for 1977 and 1990 and the National Household Travel Survey for 2001
(9).
[A text description of this chart is also
available.]
The overall role of walking and biking is more difficult to assess
because physical activity depends on the time and distance spent walking or
biking.
One reliable fact is that the total number of daily trips made by children has substantially increased (Figure 2), so even a decline in the share of walking
or biking does not automatically
translate into a decline in physical activity. The increase in the number of
trips is not surprising because the time-use section in Part 1 showed that
children are now spending more time away from home than in the past.
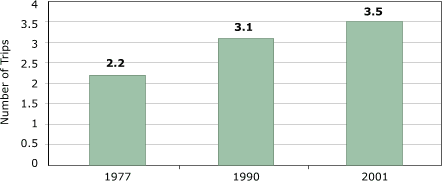
Figure 2. Total number of daily trips among U.S.
children aged five to 15 years. Author’s analysis based on data from National Personal Transportation Survey
for 1977 and 1990 and the National Household Travel Survey for 2001
(9).
[A text description of this chart is also
available.]
Trip distances are not necessarily fixed, and increased suburban sprawl
could increase the distance of walking or biking trips (because all destinations are
now farther away) or decrease it (if the substitution of driving for walking
or biking overcompensates). Here the data quality becomes more questionable.
In the NPTS/NHTS, we see little evidence of changes in walking-trip length
for children, but biking distances declined noticeably, from about 1.3 miles
in 1977 to 0.9 miles in 2001 (Figure 3).
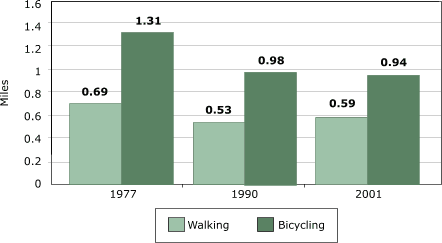
Figure 3.
Average trip length (in miles) among U.S. children aged five to 15 years. Author’s analysis based on data from National Personal Transportation Survey
for 1977 and 1990 and the National Household Travel Survey for 2001
(9).
[A text description of this chart is also
available.]
The best metric for physical activity is total active travel time, which
incorporates changes in number of trips, distances, and travel mode (Figure
4). Based on the available data, active travel time appears to have increased, a consequence of the increase in the total number of trips,
even as walking to school unambiguously declined.
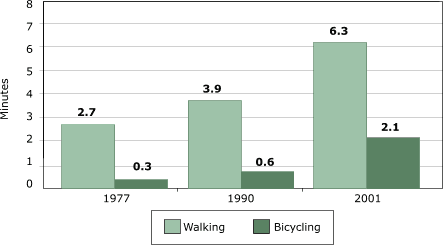
Figure 4.
Average active travel time (in minutes) among U.S. children aged five to
15 years. Author’s analysis based on data from National Personal Transportation Survey
for 1977 and 1990 and the National Household Travel Survey for 2001
(9).
[A text description of this chart is also
available.]
The magnitude of active travel time is important, however. The highest
estimates for active travel time (which were recorded for 2001) add up to
only about eight minutes of walking and biking combined per day. So even
with a
50% increase, the energy expenditure associated with active travel time would be
no more than the energy equivalent of a half-can of soft drink.
On the positive side, interventions that increase walking to school could
effect a large relative change. If an additional one quarter of children
were to walk to school — not an entirely unrealistic scenario because enough
children live within walking distance of their schools — total active travel
time could increase by 50% nationwide.
Transportation offers promising
interventions for other reasons. Transportation patterns depend on public goods, and large
externalities are associated with individual automobile use (10). The growth
of traffic and accompanying changes in land use reduce incentives to walk or
bike because nearby destinations are disappearing and because of perceived
(and actual) danger. The absence of good time-series data on the travel
patterns and mobility needs of children and the focus on planning for
automobiles by federal, state, and local transit and planning agencies
indicate neglect. New policies and investments that make cities safer and
more convenient for walking and biking may be economically efficient aside
from the benefit to the health and mobility of children (10).
Back to top
Physical Education
Children spend many hours in school, making PE programs in schools a
potentially important channel through which physical activity and fitness
may be promoted among young children (11,12). Arguably as important, though
rarely studied or discussed, is physical activity in day care and
after-school programs, where children are spending far more time now than
two decades ago.
In 1998, 16% of kindergartners received daily PE instruction in school,
and approximately 13% received PE instruction less than once a week or never
(13). Results of the 2001 Youth Risk Behavior Surveillance System (YRBSS), a
national school-based survey of ninth- to 12th-graders conducted by the
Centers for Disease Control and Prevention (CDC) show that nearly one half
(45%) do not play team sports during the year; nearly one half (48%) are not
enrolled in a PE class; and PE enrollment drops from 74% for ninth-graders
to 31% for 12th-graders (14).
Trend data on changes are more difficult to find. The YRBSS goes back
only as far as 1991 and then only for a few variables. The quality of
these nationally representative data is excellent, but limitations stem from
the short time period, the small number of PE items available in all years, and a narrow target population
that excludes younger children. The consistency of the YRBSS data, however,
is much better than the consistency of the transportation data.
Figure 5 shows the percentage of high school students who attended PE
classes at least once a week. Little evidence suggests a continuous trend in
either direction. If we were to fit a linear trend to these averages, it
would suggest an increase in participation by about two percentage points
per decade — not exactly a major increasing trend, but certainly not
evidence of a decline either. The absolute level, however, could be
considered disappointingly low: almost half of U.S. high school students do not
receive regular PE in school.
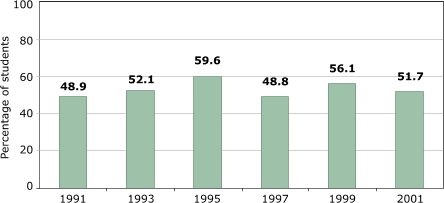
Figure 5.
Percentage of U.S. high school students who attended physical education class one or more days during an
average school week. Data from the Youth Risk Behavioral Surveillance
System, Centers for Disease Control and Prevention (14).
[A text description of this chart is also
available.]
Despite fluctuations in reported PE participation, the percentage of
high school students who get enough physical activity to satisfy minimum
guideline levels is essentially constant (the difference between the highest
and lowest annual numbers is only two percentage points) and much higher
(Figure 6) than the rates of high school students receiving regular PE in
school. This variable includes physical activity outside school. Even if
total participation is less than optimal, there is no evidence for declining
exercise levels.
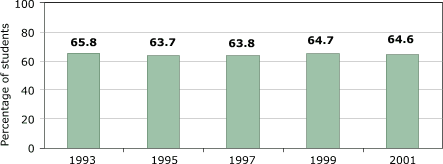
Figure 6.
Percentage of U.S. high school students who exercised or participated in physical activities
that made them sweat and breathe hard for at least 20 minutes on three or
more of past seven days. Data from the Youth Risk Behavioral
Surveillance System, Centers for Disease Control and Prevention (14).
[A text description of this chart is also
available.]
Only one variable is inconsistent with the physical activity data
described above: namely, the percentage of students participating in daily PE
(Figure 7). Participation rates were highest in 1991 and then dropped quickly
to bottom out in 1995, followed by a significant and continuous increase
since then. The 1991 number itself seems to be out of line with other years
and could potentially be an issue of methodology — national changes of that
magnitude rarely happen so quickly nor do they immediately reverse
themselves. Numbers for 1993 and
2001 are similar.
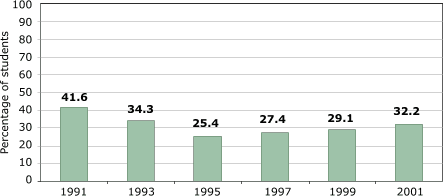
Figure 7.
Percentage of U.S. high school students attending daily physical
education classes. Data from the Youth Risk Behavioral Surveillance System,
Centers for Disease Control and Prevention (14). [A text description of this chart
is also available.]
How effective are school PE programs in
preventing obesity and promoting physical activity? School boards are
receiving mixed messages about PE. On one hand, government organizations
like the CDC recommend that all schools require daily PE for all students
from kindergarten through 12th grade. On the other hand, the
predominant conclusion emerging from research studies is that typical school
PE is of low quality when compared with ideal PE instruction. School
boards, principals, and teachers facing other competing goals, especially
academic achievement, may conclude that if existing PE is of limited value,
it should be abolished or at least reduced in favor of other academic
instruction. However, PE in elementary schools as currently implemented
nationwide (and not ideal instruction) plays an important role in containing
excess weight gain among girls (13).
Back to top
Diet
We can examine trends in dietary change for children by using data from
the Continuing Survey of Food Intakes by Individuals (CSFII) 1989–91,
1994–96, and 1998 and the Nationwide Food Consumption Survey 1977–78. Enns
et al have published the results of these surveys for children aged six to 11 years (15). There
are only two strong and consistent trends. One, the intake of
chips/crackers/popcorn/pretzels roughly tripled from the mid-1970s to the
mid-1990s: from five grams (1977–78) to nine grams (1989–91) to 14 grams
(1994–96, 1998) per day for girls and
from five grams to nine grams to 15 grams for boys. Two, the intake
of soft drinks roughly doubled during the same period: from 105 grams to 136
grams to 200 grams per day for girls and from 112 grams to 169 grams to 217
grams per day for boys. Other researchers found parallel changes for all
age groups, and trends appear similar for different age groups (16). While
increased snacking is likely a main cause for the shift across foods, there
also has been a shift to larger portion sizes (17,18).
Some researchers believe that high-fructose corn syrup or added caloric
sweeteners play an important role in the development of obesity worldwide
(19,20). For a typical soft drink, 100 mL (or less than one third of a
12-oz can) has 10.7 g of sugar and provides 43 kcal of energy. This
energy value corresponds to the energy expenditure of about eight minutes of walking for
an adult and to the daily average that is reported as active travel time
among children aged five to 15 years in the 2001 NHTS. Thus, the increase in
soft drink consumption alone appears to be at least equal to the total
energy expenditure associated with children’s active travel in 2001. That
this trend in soft drink consumption could be a factor in weight gain is
also consistent with cross-sectional data that show an association between
the consumption of sugar-sweetened drinks and obesity after controlling for
observable characteristics (21). Soft drink consumption is also negatively
related to milk, fruit, and vegetable consumption and positively related to
higher calorie intake (22-24).
Two significant trends are apparent in the share of energy from fat and
carbohydrates. The share of energy from fat fell for both boys and girls, and
the share of energy from carbohydrates increased (15). Figure 8 shows
changes in grams. Fat intake decreased by about 100 kcal or less, but
carbohydrate intake increased by about 150 to 200 kcal. The point estimate
of total energy intake in the 1990s was higher than in 1977–78, but the data
cannot reject the hypothesis of no change.
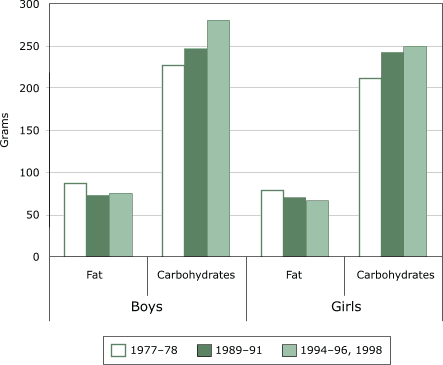
Figure 8.
Daily fat and carbohydrate intake in grams per day for U.S. boys and girls aged six to 11
years. Data from Continuing Survey of Food Intakes by Individuals for
1989–91, 1994–96, and 1998 and Nationwide Food Consumption Survey 1977–78,
published by Enns et al (15).
[A text description of this chart is also
available.]
An alternative data series is provided by the USDA’s Food Consumption Data
System, but it cannot identify trends for
subgroups because it is composed of macroeconomic data (Figure 9). Calories per capita remained
relatively constant from 1970 until the mid-1980s but then increased.
Consistent with the CSFII data, the energy increase is derived almost
exclusively from carbohydrates.
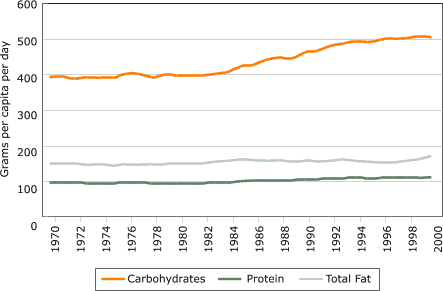
Figure 9.
U.S. food supply of macronutrients in grams per capita per day, 1970–2000. Data
from Food Consumption Data System, Economic Research Service, U.S.
Department of Agriculture (7).
[A text description of this chart is also
available.]
Price and income data may be important because they shed light on
underlying economic trends. The percentage of disposable income spent by
Americans on food has continuously declined since the end of World War II,
even as it bought more calories. Almost all of the decline is derived from food
prepared and consumed at
home; the share of disposable income for food away from home stayed
relatively constant. In 1970, Americans spent one third of their food
dollars on food away from home; this amount grew to 39% in 1980, 45% in
1990, and 47% in 2001. Away-from-home foods tend to be more energy-dense and
contain more fats and sugars than foods at home. USDA researchers have
calculated that if food away from home had the same average nutritional
densities as food at home in 1995, Americans would have consumed 197 fewer
calories per day and reduced their fat intake to 31.5% of calories (instead
of the actual 33.6%) (25).
With increasing income, people are shifting to more convenient food away
from home. Demographic reasons explain this shift as well. Increased numbers
of smaller households (resulting from lower fertility rates) and increased
numbers of single-parent households enjoy fewer economies of scale in
home-food production than larger families. Preparation of an in-home meal
involves a fixed time that differs little with the number of persons served,
whereas eating out involves the same marginal costs for each person. This
difference in “technology” combined with demographic changes alone would
have shifted incentives toward fewer meals prepared at home. In addition, relative
price changes have made the consumption of prepared foods cheaper compared
with the time costs of preparing food at home and cleaning up.
What is not clear is why the location of consumption should so
dramatically alter nutritional content. Lack of information at the point of
consumption is probably part of the reason, although this
argument would only apply to adults who are presumed to be able to make
rational decisions. If adults lack information about nutritional content at
the point of consumption, it is not surprising that competition takes place
among factors that consumers can evaluate easily (at least with repeat
purchases): price, amount, and taste. This type of market failure is well known to
economists since Nobel Laureate George Akerlof’s “lemon paper” (26). Akerlof
argued that if quality is an important dimension but cannot be assessed by a
buyer, competition will take place on price and other observed characteristics
(e.g., portion size) and drive out higher-quality products even if
they would be preferred by buyers with more complete information. When
informational problems are sufficiently severe, regulation is needed for an
efficient market. Requiring easily available and
understandable information about the nutritional content of prepared meals
at the point of consumption might address this informational problem.
Another economic trend shown by data collected by the USDA’s Economic
Research Service (7) also shifts incentives in a direction that does not
promote healthier eating patterns. Figure 10 shows relative price
changes, using the period 1982–1984 as the baseline (index = 100) for each
series. While the consumer price index increased to 180 by 2002, the price
index for fresh fruit and vegetables increased to 258. In contrast, sugars, sweets, fats and oils became relatively cheaper than other goods, and
their prices increased less than the consumer price index (data not shown
for fats and oils). With a 2002 price
index of 126, soft drinks were among the items that became (relatively) the
cheapest.
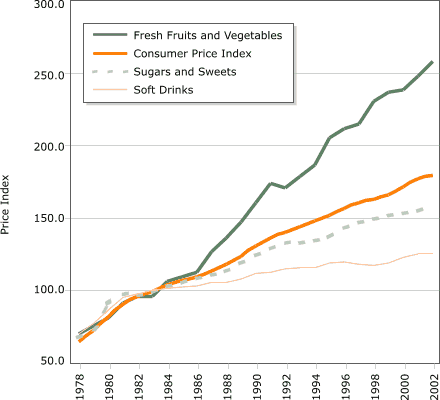
Figure 10. Relative price changes for fresh fruits
and vegetables, sugars and sweets, and soft drinks, using the period 1982–84
as the baseline (index = 100), 1978–2002. Data from Food Consumption Data
System, Economic Research Service, U.S. Department of Agriculture (7).
[A text description of this chart is also
available.]
Detailed data exist on lunches and breakfasts offered in schools
participating in the National School Lunch Program, although only for two
data points (school years 1991–92 and 1998–99) (27). Energy content has
remained fairly constant for lunches (with an increase of 3% in primary
schools and a decrease of
3% in secondary schools) but declined somewhat for breakfast (a decrease of 4% for
primary schools and a decrease of 10% for secondary schools). Fat content declined and was
replaced by carbohydrates with no change in protein content (27). The overall
role of school diet in children’s diet is less clear because the data refer to meals offered,
not necessarily consumed, and because there have been large increases in participation in the
School Breakfast Program. Schools provided
approximately 8% of all meals and snacks and contributed 9% of total calories
for children aged two to 19 years in 1994–1996, but the importance of school
foods in a child’s diet was highest among children aged six to 11
years (28).
Back to top
Discussion
In 1995, “Obesity in Britain: Gluttony or Sloth?,” a study
published in the BMJ, energized the debate on whether the obesity
epidemic is caused by declining physical activity or increasing energy
intake (29). The authors came down on the “sloth” side for adults. Even if one could separate energy intake and expenditure,
we saw in this review that existing data are too limited to support a conclusive analysis.
However, food consumption patterns have
changed dramatically while youth physical activity patterns have not. In
fact, the data generally show fewer changes in physical activity — changes in time studying at home, participating
in exercise, or taking part in high school PE — than
commonly thought. Changes went in the opposite
direction, even if at a minimal level — less television watching and more active transportation time.
These patterns do not exclude the possibility that overall physical activity
has declined, because major
changes in time use have occurred, and, for example, we have not determined activity levels in after-school and day-care settings where time
spent by children has increased substantially.
Both dietary and physical activity interventions can affect weight gain. Interventions affecting physical activity can be desirable even if recent
increases in obesity among youth have been primarily related to changes in diet.
Back to top
Acknowledgments
This report was prepared for the Robert Wood Johnson Foundation. Tania
Andreyeva and Hilary Rhodes provided research assistance.
Back to top Author Information
Corresponding Author: Roland Sturm, PhD, RAND, 1700 Main St, Santa Monica,
CA 90401. Telephone: 310-393-0411 ext. 6164. E-mail: Roland_Sturm@rand.org.
Back to top
References
- Ogden CL, Flegal KM, Carroll MD, Johnson CL.
Prevalence and trends
in overweight among US children and adolescents,1999-2000. JAMA 2002;288(14):1728-32.
- Hill JO, Peters JC.
Environmental contributions to the obesity
epidemic. Science 1998;280(5368):1371-4.
- Hill JO, Wyatt HR, Reed GW, Peters JC.
Obesity and the environment:
where do we go from here? Science 2003;299(5608):853-5.
- Ewing R, Schmid T, Killingsworth R, Zlot A, Raudenbush S.
Relationship between urban sprawl and physical activity, obesity, and morbidity. Am J Health Promot 2003;18(1):47-57.
- Sturm R, Cohen D.
Suburban sprawl and physical and mental health.
Public Health 2004 Oct;118(7)488-96.
- Koplan JP, Liverman CT, Kraak VA, editors. Preventing childhood obesity: health in the
balance. Washington (DC):
National Academies Press. Forthcoming.
- U.S. Department of Agriculture.
Food
consumption data system [Internet]. Washington (DC): Economic Research
Service; 2004.
- Robinson JP, Godbey GG. Time for life: the surprising ways
Americans use their time. 2nd ed. University Park (PA):
Pennsylvania State University Press; 1999.
- Bureau of Transportation Statistics.
National household travel survey [Internet]. Washington (DC): U.S.
Department of Transportation.
- Porter RC. Economics at the wheel: the costs of cars and drivers.
London: Academic Press; 1999.
- Carter RC.
The impact of public schools on childhood obesity.
JAMA
2002;288(17):2180.
- Centers for Disease Control and Prevention.
Guidelines for school
and community programs to promote lifelong physical activity among young
people. MMWR Recomm Rep 1997;46(RR-6):1-36.
- Datar A, Sturm R.
Physical education in elementary school and
body mass index: evidence from the early childhood longitudinal study. Am J Public Health
2004 Sep:94(9):1501-6.
- Centers for Disease Control and Prevention. Youth Risk Behavior
Surveillance System (YRBSS): United States, 2001. MMWR Morb Mortal Wkly
Rep 2002;51:1-62.
- Enns CW, Mickle SJ, Goldman JD. Trends in food and nutrient intakes by
children in the United States. Family Economics and Nutrition Review 2002;14(2):56-68.
- Nielsen SJ, Siega-Riz AM, Popkin BM.
Trends in energy intake in
U.S. between 1977 and 1996: similar shifts seen across age groups. Obes
Res 2002 May;10(5):370-8.
- Jahns L, Siega-Riz AM, Popkin BM.
The increasing prevalence of
snacking among US children from 1977 to 1996. J Pediatr 2001
Apr;138(4):493-8.
- Nielsen SJ, Popkin BM.
Patterns and trends in food portion sizes,
1977-1998. JAMA 2003 Jan 22-29;289(4):450-3.
- Bray GA, Nielsen SJ, Popkin BM.
Consumption of high-fructose corn
syrup in beverages may play a role in the epidemic of obesity. Am J Clin
Nutr 2004 Apr;79(4):537-43.
- Popkin BM, Nielsen SJ. The sweetening of the world's diet. Obes
Res 2003 Nov;11(11):1325-32.
- Ludwig DS, Peterson KE, Gortmaker SL.
Relation between consumption
of sugar-sweetened drinks and childhood obesity: A prospective
observational analysis. Lancet 2001;357(9255):505-8.
- Harnack L, Stang J, Story M.
Soft drink consumption among U.S.
children and adolescents: nutritional consequences. J Am Diet Assoc
1999;99(4):436-41.
- Cullen KW, Ash DM, Warneke C, de Moor C.
Intake of soft drinks,
fruit-flavored beverages, and fruit and vegetables by children in grades
4 through 6. Am J Public Health 2002;92(9):1475-8.
- Pereira MA, Jacobs DR Jr, Van Horn L, Slattery ML, Kartashov AI,
Ludwig DS.
Dairy consumption, obesity, and the insulin resistance syndrome
in young adults: the CARDIA Study. JAMA 2002;287(16):2081-9.
- Lin BH, Guthrie J, Frazão E.
Nutrient contribution of food away from home. In: America's eating habits: changes and consequences.
Washington (DC): U.S. Department of Agriculture, Economic Research
Service, Food and Rural Economics Division; undated. Agriculture
Information Bulletin No. 750, USDA/ERS, 213-242.
- Akerlof GA. The market for 'lemons': quality uncertainty and the
market mechanism. Quarterly Journal of Economics 1970;84(3):488-500.
- U.S. Department of Agriculture, Food and Nutrition Service.
School
Nutrition Dietary Assessment Study II. Washington (DC): The Office of Analysis, Nutrition and Evaluation;
2001 Jan. Special Nutrition Programs Report No. CN-01-SNDAIIFR.
- Lin BH, Guthrie J, Frazão E. Quality of children’s diets at and
away from home: 1994-96. Food Review 1999 Jan-Apr:2-10.
- Prentice AM, Jebb SA. Obesity in
Britain: gluttony or sloth? BMJ 1995;311(7002):437-9.
Back to top |
|
