 |
|
|
|
|
|
|
| ||||||||||
|
|
|
|
|
|
|
||||
| ||||||||||
|
|
|
|
|
Persons using assistive technology might not be able to fully access information in this file. For assistance, please send e-mail to: mmwrq@cdc.gov. Type 508 Accommodation and the title of the report in the subject line of e-mail. Youth Risk Behavior Surveillance --- United States, 2003Please note: An erratum has been published for this article. To view the erratum, please click here. Jo Anne Grunbaum, Ed.D.1 Abstract Problem/Condition: Priority health-risk behaviors, which contribute to the leading causes of morbidity and mortality among youth and adults, often are established during youth, extend into adulthood, are interrelated, and are preventable. Reporting Period: This report covers data collected during February--December 2003. Description of System: The Youth Risk Behavior Surveillance System (YRBSS) monitors six categories of priority health-risk behaviors among youth and young adults --- behaviors that contribute to unintentional injuries and violence; tobacco use; alcohol and other drug use; sexual behaviors that contribute to unintended pregnancy and sexually transmitted diseases (STDs), including human immunodeficiency virus (HIV) infection; unhealthy dietary behaviors; and physical inactivity --- plus overweight. YRBSS includes a national school-based survey conducted by CDC as well as state and local school-based surveys conducted by education and health agencies. This report summarizes results from the national survey, 32 state surveys, and 18 local surveys conducted among students in grades 9--12 during February--December 2003. Results and Interpretation: In the United States, 70.8% of all deaths among persons aged 10--24 years result from only four causes: motor-vehicle crashes, other unintentional injuries, homicide, and suicide. Results from the 2003 national Youth Risk Behavior Survey demonstrated that, during the 30 days preceding the survey, numerous high school students engage in behaviors that increase their likelihood of death from these four causes: 30.2% had ridden with a driver who had been drinking alcohol; 17.1% had carried a weapon; 44.9% had drunk alcohol; and 22.4% had used marijuana. In addition, during the 12 months preceding the survey, 33.0% of high school students had been in a physical fight, and 8.5% had attempted suicide. Substantial morbidity and social problems among young persons also result from unintended pregnancies and STDs, including HIV infection. In 2003, 46.7% of high school students had ever had sexual intercourse; 37% of sexually active students had not used a condom at last sexual intercourse; and 3.2% had ever injected an illegal drug. Among adults aged >25 years, 62.9% of all deaths results from two causes: cardiovascular diseases and cancer. Results from the 2003 national Youth Risk Behavior Survey demonstrate that the majority of risk behaviors associated with these two causes of death are initiated during adolescence. In 2003, a total of 21.9% of high school students had smoked cigarettes during the 30 days preceding the survey; 78% had not eaten >5 servings/day of fruits and vegetables during the 7 days preceding the survey; 33.4% had participated in an insufficient amount of physical activity; and 13.5% were overweight. Actions Taken: YRBSS data are being used to measure progress toward achieving 15 national health objectives for 2010 and three of the 10 leading health indicators. In addition, education and health officials at national, state, and local levels are using these YRBSS data to improve policies and programs to reduce priority health-risk behaviors among youth. IntroductionIn the United States, 70.8% of all deaths among youth and young adults aged 10--24 years result from only four causes: motor-vehicle crashes (32.3%), other unintentional injuries (11.7%), homicide (15.1%), and suicide (11.7%) (1). Substantial morbidity and social problems also result from the approximately 870,000 pregnancies that occur each year among females aged 15--19 years (2) and the estimated 3 million cases of sexually transmitted diseases (STDs) that occur each year among persons aged 10--19 years (3). Among adults aged >25 years, 62.9% of all deaths in the United States result from cardiovascular diseases (39.4%) and cancer (23.5%) (1). Leading causes of morbidity and mortality among all age groups in the United States are related to the following: behaviors that contribute to unintentional injuries and violence; tobacco use; alcohol and other drug use; sexual behaviors that contribute to unintended pregnancy and STDs, including human immunodeficiency virus (HIV) infection; unhealthy dietary behaviors; physical inactivity; and overweight. Behaviors are frequently interrelated and often are established during youth and extend into adulthood. To monitor priority health-risk behaviors among youth and young adults in each of these six categories, CDC developed the Youth Risk Behavior Surveillance System (YRBSS) (4). YRBSS includes national, state, and local school-based surveys of students in grades 9--12. National surveys were conducted biennially since 1991. Comparable state and local surveys also were conducted (Box). This report summarizes results from the 2003 national school-based survey and trends during 1991--2003 in selected risk behaviors. Data from the 32 state and 18 of the 20 local school-based surveys with weighted data in 2003 also are included (Figure 1). Data from the remaining 11 state and 2 local school-based surveys with unweighted data are not included in this report. The national survey, the 32 weighted state surveys, and 15 of the weighted local surveys were conducted during spring 2003. Three of the local surveys were conducted during fall 2003. MethodsSamplingNational Youth Risk Behavior Survey The sampling frame for the 2003 national Youth Risk Behavior Survey (YRBS) was obtained from the Quality Education Data (QED), Inc., database (5). The QED database encompasses both private and public schools, includes the latest data from the Common Core of Data from the National Center for Educational Statistics (6), and describes school-level enrollment by grade and minority status. The sampling frame consisted of all public and private schools with students in at least one of grades 9--12 in the 50 states and the District of Columbia. A three-stage cluster sample design produced a nationally representative sample of students in grades 9--12 who attend public and private schools. The first-stage sampling frame contained 1,262 primary sampling units (PSUs), consisting of counties, subareas of large counties, or groups of smaller, adjacent counties. The 1,262 PSUs were organized into 16 strata, based on the degree of urbanization and the percentage of black* and Hispanic† students in the PSU. From the 1,262 PSUs, 57 were selected with probability proportional to overall school enrollment size. At the second sampling stage, 195 schools with any of grades 9--12 were selected with probability proportional to school enrollment size. To enable separate analysis of data for black and Hispanic students, schools with substantial numbers of black and Hispanic students were sampled at higher rates than all other schools. The third sampling stage consisted of randomly selecting one or two intact classes from each grade 9--12 from either a required subject (e.g., English or social studies) or a required period (e.g., second period) at each chosen school. All students in selected classes were eligible to participate in the survey. A weighting factor was applied to each student record to adjust for nonresponse and for varying probabilities of selection, including those resulting from oversampling of black and Hispanic students. Numbers of students in other racial/ethnic populations (excluding white,§ black, and Hispanic students) were too low to analyze separately in this report. Weights were scaled so that 1) the weighted count of students was equal to the total sample size, and 2) the weighted proportions of students in each grade matched national population proportions. For the national YRBS, 15,240 questionnaires were completed in 158 schools. Schools that refused to participate were not replaced. The school response rate was 81%, and the student response rate was 83%. The school response rate multiplied by student response rate produces an overall response rate of 67% (Table 1). Additional information regarding YRBS is available at http://www.cdc.gov/yrbs. State and Local Youth Risk Behavior Surveys In 2003, each state and local school-based YRBS employed a two-stage cluster sample design to produce representative samples of students in grades 9--12 in their jurisdiction. In 30 states and six cities, schools with any of grades 9--12 were selected with probability proportional to school enrollment size. In two states and 12 cities, all schools with any of grades 9--12 were selected. The second sampling stage consisted of randomly selecting intact classes from either a required subject (e.g., English or social studies) or a required period (e.g., second period) at each chosen school. All students in selected classes were eligible to participate in the survey, except in Florida. In Florida, one third of randomly selected students in selected classes were eligible to participate in the YRBS survey; the remaining two thirds of students participated in other surveys. In 2003, the student sample sizes for the state and local YRBS ranged from 968 to 9,320. School response rates ranged from 67% to 100%; student response rates ranged from 60% to 94%; and overall response rates ranged from 60% to 90% (Table 1). The 32 state and 18 local surveys reported here each had an overall response rate >60% and appropriate documentation to allow the data to be weighted. Thus, the data are considered representative of students in grades 9--12 in those jurisdictions. The Texas survey excludes students from Houston. Data CollectionSurvey procedures for the national, state, and local surveys were designed to protect students' privacy by allowing for anonymous and voluntary participation. Students completed the self-administered questionnaire during one class period and recorded their responses directly on a computer-scannable questionnaire booklet or answer sheet. The core questionnaire contained 87 multiple-choice questions. To meet individual needs, 21 states and 12 cities added or deleted questions. Before the survey was conducted, local parental permission procedures were followed. Data AnalysisEach data set was cleaned and edited for inconsistencies. Missing data were not statistically imputed. Of the 15,240 completed questionnaires from the national YRBS, 26 failed quality control¶ and were excluded from analysis, leaving a total of 15,214 usable questionnaires. The number of completed questionnaires that failed quality-control checks and were excluded from analysis from the state and local surveys ranged from 0 to 86 across states (median: 4) and from 0 to 35 across cities (median: 8). At risk for overweight and overweight were calculated from self-reported height and weight and then applied to reference data from the National Health and Nutrition Examination Survey (7) to determine the percentage of students who were at risk for becoming overweight and who were overweight. At risk for becoming overweight was defined as a body mass index (BMI) of >85th percentile and <95th percentile by age and sex. Overweight was defined as a BMI >95th percentile by age and sex. A BMI >95th percentile by age and sex among youth is approximately equivalent to a BMI >30 among adults. For an adult, a BMI of 30 is approximately 30 pounds overweight. SAS® (8) and SUDAAN (9) were used to compute prevalence estimates and confidence intervals for all variables and all data sets. National Youth Risk Behavior Survey For the 2003 national YRBS data, SUDAAN was used to compute t-tests, which were used to determine pair-wise differences between subpopulations at the p < 0.05 level (10). Differences between prevalence estimates were considered statistically significant if the p-value was <0.05 for main effects (sex, race/ethnicity, and grade) and for interactions (sex by race/ethnicity and sex by grade). Only statistically significant differences are reported in the Results section in the following order: sex, sex by race/ethnicity, sex by grade, race/ethnicity, race/ethnicity by sex, grade, and grade by sex. Secular trends were analyzed by using logistic regression analyses that controlled for sex, grade, and race/ethnicity, and that simultaneously assessed linear and quadratic time effects (10). Quadratic trends indicate a significant but nonlinear trend in the data. When the trend includes significant linear and quadratic components, the data demonstrate nonlinear variation (e.g., leveling off or change of direction) in addition to a linear trend. ResultsBehaviors That Contribute to Unintentional InjuriesSeat Belt Use Nationwide, 18.2% of students had rarely or never worn seat belts when riding in a car driven by someone else (Table 2). Overall, the prevalence of having rarely or never worn seat belts was higher among male (21.5%) than female (14.6%) students; higher among black male (25.6%) than black female (15.6%) students; and higher among 10th grade male (20.4%) and 12th grade male (21.1%) than 10th grade female (13.3%) and 12th grade female (10.9%) students, respectively. Prevalence of having rarely or never worn seat belts ranged from 5.6% to 23.2% across state surveys (median: 15.1%) and from 5.4% to 33.7% across local surveys (median: 12.1%) (Table 3, Figure 2). Bicycle Helmet Use Among the 62.3% of students nationwide who had ridden a bicycle during the 12 months preceding the survey, 85.9% had rarely or never worn a bicycle helmet (Table 2). Overall, the prevalence of having rarely or never worn a bicycle helmet was higher among black (94.6%) than white (83.8%) and Hispanic students (90.1%) students; higher among Hispanic (90.1%) than white students (83.8%); higher among black female (94.3%) than white female (82.0%) and Hispanic female (87.9%) students; and higher among black male (95.0%) and Hispanic male (91.4%) than white male (85.2%) students. Prevalence of having rarely or never worn a bicycle helmet ranged from 52.0% to 95.7% across state surveys (median: 86.6%) and from 75.2% to 97.1% across local surveys (median: 89.0%) (Table 3). Rode with a Driver Who Had Been Drinking Alcohol During the 30 days preceding the survey, 30.2% of students nationwide had ridden in a car or other vehicle one or more times with a driver who had been drinking alcohol (Table 4). The prevalence of having ridden with a driver who had been drinking alcohol was higher among Hispanic female (40.0%) than Hispanic male (32.8%) students. Overall, the prevalence of having ridden with a driver who had been drinking alcohol was higher among Hispanic (36.4%) than white (28.5%) and black (30.9%) students and higher among Hispanic female (40.0%) than white female (29.8%) and black female (29.8%) students. Overall, the prevalence of having ridden with a driver who had been drinking alcohol was higher among 12th grade (33.3%) than 9th grade (28.2%) students and higher among 12th grade male (34.0%) than 9th grade male (26.4%) and 10th grade male (27.6%) students. Prevalence of having ridden with a driver who had been drinking alcohol ranged from 17.9% to 42.8% across state surveys (median: 28.2%) and from 18.6% to 40.6% across local surveys (median: 28.8%) (Table 5). Drove After Drinking Alcohol During the 30 days preceding the survey, 12.1% of students nationwide had driven a car or other vehicle one or more times after drinking alcohol (Table 4). Overall, the prevalence of having driven after drinking alcohol was higher among male (15.0%) than female (8.9%) students; higher among white male (15.2%), black male (13.4%), and Hispanic male (14.9%) than white female (10.3%), black female (4.6%), and Hispanic female (8.6%) students, respectively; and higher among 10th grade male (11.3%), 11th grade male (19.5%), and 12th grade male (25.6%) than 10th grade female (6.9%), 11th grade female (11.1%), and 12th grade female (13.6%) students, respectively. Overall, the prevalence of having driven after drinking alcohol was higher among white (12.9%) than black (9.1%) students and higher among white female (10.3%) and Hispanic female (8.6%) than black female students (4.6%). Overall, the prevalence of having driven after drinking alcohol was higher among 10th grade (9.2%), 11th grade (15.3%), and 12th grade (19.8%) than 9th grade (6.2%) students; higher among 11th grade (15.3%) and 12th grade (19.8%) than 10th grade (9.2%) students; higher among 12th grade (19.8%) than 11th grade (15.3%) students; higher among 11th grade female (11.1%) and 12th grade female (13.6%) than 9th grade female (5.1%) and 10th grade female (6.9%) students; higher among 10th grade male (11.3%), 11th grade male (19.5%), and 12th grade male (25.6%) than 9th grade male (7.2%) students; higher among 11th grade male (19.5%) and 12th grade male (25.6%) than 10th grade male (11.3%) students; and higher among 12th grade male (25.6%) than 11th grade male (19.5%) students. Prevalence of having driven after drinking alcohol ranged from 7.4% to 26.7% across state surveys (median: 11.3%) and from 4.5% to 12.3% across local surveys (median: 7.4%) (Table 5). Behaviors That Contribute to ViolenceCarried a Weapon Nationwide, 17.1% of students had carried a weapon (e.g., a gun, knife, or club) on >1 of the 30 days preceding the survey (Table 6). Overall, the prevalence of having carried a weapon was higher among male (26.9%) than female (6.7%) students; higher among white male (27.1%), black male (24.9%), and Hispanic male (24.3%) than white female (5.5%), black female (9.8%), and Hispanic female (8.5%) students, respectively; and higher among 9th grade male (26.6%), 10th grade male (26.5%), 11th grade male (29.2%), and 12th grade male (25.2%) than 9th grade female (8.8%), 10th grade female (5.2%), 11th grade female (6.8%), and 12th grade female (5.2%) students, respectively. The prevalence of having carried a weapon was higher among black female (9.8%) and Hispanic female (8.5%) than white female (5.5%) students. The prevalence of having carried a weapon was higher among 9th grade female (8.8%) than 10th grade female (5.2%) and 12th grade female (5.2%) students. Prevalence of having carried a weapon ranged from 12.3% to 24.6% across state surveys (median: 16.9%) and from 11.3% to 25.0% across local surveys (median: 16.0%) (Table 7, Figure 3). Carried a Gun Nationwide, 6.1% of students had carried a gun on >1 of the 30 days preceding the survey (Table 6). Overall, the prevalence of having carried a gun was higher among male (10.2%) than female (1.6%) students; higher among white male (10.0%), black male (10.6%), and Hispanic male (8.2%) than white female (1.5%), black female (1.4%), and Hispanic female (2.6%) students, respectively; and higher among 9th grade male (9.3%), 10th grade male (10.4%), 11th grade male (10.8%), and 12th grade male (10.0%) than 9th grade female (2.1%), 10th grade female (1.4%), 11th grade female (1.6%), and 12th grade female (1.0%) students, respectively. Prevalence of having carried a gun ranged from 3.4% to 10.5% across state surveys (median: 5.9%) and from 3.4% to 8.9% across local surveys (median: 5.7%) (Table 7). Physical Fighting Nationwide, 33.0% of students had been in a physical fight one or more times during the 12 months preceding the survey (Table 8). Overall, the prevalence of having been in a physical fight was higher among male (40.5%) than female (25.1%) students; higher among white male (38.4%), black male (45.6%), and Hispanic male (42.6%) than white female (22.1%), black female (34.0%), and Hispanic female (29.5%) students, respectively; and higher among 9th grade male (44.8%), 10th grade male (41.8%), 11th grade male (38.5%), and 12th grade male (35.0%) than 9th grade female (31.9%), 10th grade female (25.0%), 11th grade female (23.0%), and 12th grade female (17.7%) students, respectively. Overall, the prevalence of having been in a physical fight was higher among black (39.7%) than white (30.5%) and Hispanic (36.1%) students; higher among Hispanic (36.1%) than white (30.5%) students; higher among black female (34.0%) and Hispanic female (29.5%) than white female (22.1%) students; higher among black female (34.0%) than Hispanic female (29.5%) students; and higher among black male (45.6%) than white male (38.4%) students. Overall, the prevalence of having been in a physical fight was higher among 9th grade (38.6%) than 10th grade (33.5%), 11th grade (30.9%), and 12th grade (26.5%) students; higher among 10th grade (33.5%) and 11th grade (30.9%) than 12th grade (26.5%) students; higher among 9th grade female (31.9%) than 10th grade female (25.0%), 11th grade female (23.0%), and 12th grade female (17.7%) students; higher among 10th grade female (25.0%) and 11th grade female (23.0%) than 12th grade female (17.7%) students; higher among 9th grade male (44.8%) than 11th grade male (38.5%) and 12th grade male (35.0%) students; and higher among 10th grade male (41.8%) than 12th grade male (35.0%) students. Prevalence of having been in a physical fight ranged from 26.4% to 35.0% across state surveys (median: 30.3%) and from 27.2% to 44.3% across local surveys (median: 37.4%) (Table 9). Injured in a Physical Fight Among students nationwide, 4.2% had been in a physical fight one or more times during the 12 months preceding the survey that resulted in injuries that had to be treated by a doctor or nurse (Table 8). Overall, the prevalence of having been injured in a physical fight was higher among male (5.7%) than female (2.6%) students; higher among white male (4.0%), black male (7.3%), and Hispanic male (6.5%) than white female (1.7%), black female (3.7%), and Hispanic female (3.9%) students, respectively; and higher among 10th grade male (6.2%), 11th grade male (4.9%), and 12th grade male (4.3%) than 10th grade female (2.2%), 11th grade female (2.4%), and 12th grade female (1.8%) students, respectively. Overall, the prevalence of having been injured in a physical fight was higher among black (5.5%) and Hispanic (5.2%) than white (2.9%) students; higher among black female (3.7%) and Hispanic female (3.9%) than white female (1.7%) students; and higher among black male (7.3%) and Hispanic male (6.5%) than white male (4.0%) students. Prevalence of having been injured in a physical fight ranged from 2.4% to 4.8% across state surveys (median: 3.4%) and from 2.3% to 8.6% across local surveys (median: 4.2%) (Table 9). Dating Violence During the 12 months preceding the survey, 8.9% of students nationwide had been hit, slapped, or physically hurt on purpose by their boyfriend or girlfriend (i.e., dating violence) (Table 10). Overall, the prevalence of dating violence was higher among black (13.9%) than white (7.0%) and Hispanic (9.3%) students; higher among Hispanic (9.3%) than white (7.0%) students; higher among black female (14.0%) than Hispanic female (9.2%) and white female (7.5%) students; and higher among black male (13.7%) than Hispanic male (9.2%) and white male (6.6%) students. Prevalence of dating violence ranged from 6.5% to 14.0% across state surveys (median: 10.0%) and from 7.3% to 16.0% across local surveys (median: 11.7%) (Table 11). Forced Sexual Intercourse Nationwide, 9.0% of students had ever been physically forced to have sexual intercourse when they did not want to (Table 10). Overall, the prevalence of having been forced to have sexual intercourse was higher among female (11.9%) than male (6.1%) students; higher among white female (11.2%) and Hispanic female (13.0%) than white male (3.7%) and Hispanic male (7.6%) students, respectively; and higher among 9th grade female (11.3%), 11th grade female (13.5%), and 12th grade female (11.6%) than 9th grade male (5.0%), 11th grade male (4.8%), and 12th grade male (6.6%) students, respectively. Overall, the prevalence of having been forced to have sexual intercourse was higher among black (12.3%) and Hispanic (10.4%) than white (7.3%) students, and higher among black male (11.7%) and Hispanic male (7.6%) than white male (3.7%) students. Prevalence of having been forced to have sexual intercourse ranged from 5.4% to 11.0% across state surveys (median: 8.7%) and from 5.5% to 12.4% across local surveys (median: 8.5%) (Table 11). Carried a Weapon on School Property Nationwide, 6.1% of students carried a weapon (e.g., a gun, knife, or club) on school property on >1 of the 30 days preceding the survey (Table 12). Overall, the prevalence of having carried a weapon on school property was higher among male (8.9%) than female (3.1%) students; higher among white male (8.5%) and Hispanic male (7.7%) than white female (2.2%) and Hispanic female (4.2%) students, respectively; and higher among 10th grade male (8.9%), 11th grade male (10.3%), and 12th grade male (10.2%) than 10th grade female (3.0%), 11th grade female (2.7%), and 12th grade female (2.5%) students, respectively. The prevalence of having carried a weapon on school property was higher among black female (5.5%) and Hispanic female (4.2%) than white female (2.2%) students. The prevalence of having carried a weapon on school property was higher among 10th grade male (8.9%), 11th grade male (10.3%), and 12th grade male (10.2%) than 9th grade male (6.6%) students. Prevalence of having carried a weapon on school property ranged from 3.2% to 10.1% across state surveys (median: 5.8%) and from 3.5% to 10.6% across local surveys (median: 6.1%) (Table 13). Threatened or Injured with a Weapon on School Property During the 12 months preceding the survey, 9.2% of students nationwide had been threatened or injured with a weapon (e.g., a gun, knife, or club) on school property one or more times (Table 12). Overall, the prevalence of having been threatened or injured with a weapon on school property was higher among male (11.6%) than female (6.5%) students; higher among white male (9.6%), black male (14.3%), and Hispanic male (11.9%) than white female (5.8%), black female (7.5%), and Hispanic female (6.9%) students, respectively; and higher among 9th grade male (15.4%), 10th grade male (11.3%), 11th grade male (9.2%), and 12th grade male (8.5%) than 9th grade female (8.3%), 10th grade female (7.0%), 11th grade female (5.4%), and 12th grade female (3.9%) students, respectively. Overall, the prevalence of having been threatened or injured with a weapon on school property was higher among black (10.9%) than white (7.8%) students and higher among black male (14.3%) than white male (9.6%) students. Overall, the prevalence of having been threatened or injured with a weapon on school property was higher among 9th grade (12.1%) than 11th grade (7.3%) and 12th grade (6.3%) students; higher among 10th grade (9.2%) than 12th grade (6.3%) students; higher among 9th grade female (8.3%) than 11th grade female (5.4%) and 12th grade female (3.9%) students; higher among 10th grade female (7.0%) than 12th grade female (3.9%) students; and higher among 9th grade male (15.4%) than 11th grade male (9.2%) and 12th grade male (8.5%) students. Prevalence of having been threatened or injured with a weapon on school property ranged from 5.2% to 9.7% across state surveys (median: 7.5%) and from 6.8% to 12.7% across local surveys (median: 9.7%) (Table 13). Physical Fight on School Property Nationwide, 12.8% of students had been in a physical fight on school property one or more times during the 12 months preceding the survey (Table 14). Overall, the prevalence of having been in a physical fight on school property was higher among male (17.1%) than female (8.0%) students; higher among white male (14.3%), black male (21.5%), and Hispanic male (19.3%) than white female (5.3%), black female (12.6%), and Hispanic female (13.8%) students, respectively; and higher among 9th grade male (23.3%), 10th grade male (18.1%), 11th grade male (14.2%), and 12th grade male (9.6%) than 9th grade female (12.2%), 10th grade female (7.3%), 11th grade female (6.4%), and 12th grade female (4.7%) students, respectively. Overall, the prevalence of having been in a physical fight on school property was higher among black (17.1%) and Hispanic (16.7%) than white (10.0%) students; higher among black female (12.6%) and Hispanic female (13.8%) than white female (5.3%) students; and higher among black male (21.5%) and Hispanic male (19.3%) than white male (14.3%) students. Overall, the prevalence of having been in a physical fight on school property was higher among 9th grade (18.0%) than 10th grade (12.8%), 11th grade (10.4%), and 12th grade (7.3%) students; higher among 10th grade (12.8%) and 11th grade (10.4%) than 12th grade (7.3%) students; higher among 9th grade female (12.2%) than 10th grade female (7.3%), 11th grade female (6.4%), and 12th grade female (4.7%) students; higher among 10th grade female (7.3%) than 12th grade female (4.7%) students; higher among 9th grade male (23.3%) than 10th grade male (18.1%), 11th grade male (14.2%), and 12th grade male (9.6%) students; higher among 10th grade male (18.1%) than 11th grade male (14.2%) and 12th grade male (9.6%) students; and higher among 11th grade male (14.2%) than 12th grade male (9.6%) students. Prevalence of having been in a physical fight on school property ranged from 8.6% to 14.6% across state surveys (median: 11.3%) and from 9.3% to 22.5% across local surveys (median: 15.3%) (Table 15). Did Not Go to School Because of Safety Concerns Among students nationwide, 5.4% had not gone to school on >1 of the 30 days preceding the survey because they felt unsafe at school or on their way to or from school (Table 14). Overall, the prevalence of having not gone to school because of safety concerns was higher among black (8.4%) and Hispanic (9.4%) than white (3.1%) students; higher among black female (9.0%) and Hispanic female (10.0%) than white female (2.9%) students; and higher among black male (7.9%) and Hispanic male (8.9%) than white male (3.3%) students. Overall, the prevalence of having not gone to school because of safety concerns was higher among 9th grade (6.9%) than 10th grade (5.2%), 11th grade (4.5%), and 12th grade (3.8%) students; higher among 9th grade female (6.6%) than 11th grade female (4.6%) and 12th grade female (3.9%) students; and higher among 9th grade male (7.1%) than 11th grade male (4.3%) and 12th grade male (3.8%) students. Prevalence of having not gone to school because of safety concerns ranged from 2.8% to 8.7% across state surveys (median: 4.9%) and from 5.5% to 16.2% across local surveys (median: 9.8%) (Table 15). Property Stolen or Damaged on School Property Nationwide, 29.8% of students had their property (e.g., car, clothing, or books) stolen or deliberately damaged on school property one or more times during the 12 months preceding the survey (Table 14). Overall, the prevalence of having property stolen or damaged on school property was higher among male (33.1%) than female (26.2%) students; higher among white male (30.6%), black male (33.9%), and Hispanic male (37.0%) than white female (25.6%), black female (27.0%), and Hispanic female (27.6%) students, respectively; and higher among 9th grade male (37.4%), 10th grade male (34.3%), 11th grade male (30.5%), and 12th grade male (27.9%) than 9th grade female (31.9%), 10th grade female (26.6%), 11th grade female (23.9%), and 12th grade female (20.2%) students, respectively. Overall, the prevalence of having property stolen or damaged on school property was higher among Hispanic (32.3%) than white (28.2%) students and higher among Hispanic male (37.0%) than white male (30.6%) students. Overall, the prevalence of having property stolen or damaged on school property was higher among 9th grade (34.8%) than 10th grade (30.5%), 11th grade (27.2%), and 12th grade (24.2%) students; higher among 10th grade (30.5%) than 11th grade (27.2%) and 12th grade (24.2%) students; higher among 9th grade female (31.9%) than 10th grade female (26.6%), 11th grade female (23.9%), and 12th grade female (20.2%) students; higher among 10th grade female (26.6%) than 12th grade female (20.2%) students; and higher among 9th grade male (37.4%) and 10th grade male (34.3%) than 11th grade male (30.5%) and 12th grade male (27.9%) students. Prevalence of having property stolen or damaged on school property ranged from 23.0% to 35.7% across state surveys (median: 28.8%) and from 22.9% to 36.2% across local surveys (median: 29.0%) (Table 15). Felt Sad or Hopeless During the 12 months preceding the survey, 28.6% of students nationwide had felt so sad or hopeless almost every day for >2 weeks in a row that they stopped doing some usual activities (Table 16). Overall, the prevalence of having felt sad or hopeless almost every day for >2 weeks was higher among female (35.5%) than male (21.9%) students; higher among white female (33.3%), black female (30.8%), and Hispanic female (44.9%) than white male (19.6%), black male (21.7%), and Hispanic male (25.9%) students, respectively; and higher among 9th grade female (35.7%), 10th grade female (36.9%), 11th grade female (35.9%), and 12th grade female (32.6%) than 9th grade male (21.0%), 10th grade male (22.7%), 11th grade male (22.1%), and 12th grade male (22.0%) students, respectively. Overall, the prevalence of having felt sad or hopeless almost every day for >2 weeks was higher among Hispanic (35.4%) than white (26.2%) and black (26.3%) students; higher among Hispanic female (44.9%) than white female (33.3%) and black female (30.8%) students; and higher among Hispanic male (25.9%) than white male (19.6%) students. Prevalence of having felt sad or hopeless almost every day for >2 weeks ranged from 20.8% to 31.9% across state surveys (median: 27.9%) and from 25.9% to 34.6% across local surveys (median: 31.1%) (Table 17). Seriously Considered Attempting Suicide Nationwide, 16.9% of students had seriously considered attempting suicide during the 12 months preceding the survey (Table 16). Overall, the prevalence of having considered attempting suicide was higher among female (21.3%) than male (12.8%) students; higher among white female (21.2%), black female (14.7%), and Hispanic female (23.4%) than white male (12.0%), black male (10.3%), and Hispanic male (12.9%) students, respectively; and higher among 9th grade female (22.2%), 10th grade female (23.8%), 11th grade female (20.0%), and 12th grade female (18.0%) than 9th grade male (11.9%), 10th grade male (13.2%), 11th grade male (12.9%), and 12th grade male (13.2%) students, respectively. Overall, the prevalence of having considered attempting suicide was higher among white (16.5%) and Hispanic (18.1%) than black (12.5%) students and higher among white female (21.2%) and Hispanic female (23.4%) than black female (14.7%) students. Overall, the prevalence of having considered attempting suicide was higher among 10th grade (18.3%) than 12th grade (15.5%) students and higher among 9th grade female (22.2%) and 10th grade female (23.8%) than 12th grade female (18.0%) students. Prevalence of having considered attempting suicide ranged from 13.5% to 21.0% (median: 17.3%) across state surveys and from 11.5% to 19.4% across local surveys (median: 14.3%) (Table 17). Made a Suicide Plan During the 12 months preceding the survey, 16.5% of students nationwide had made a plan to attempt suicide (Table 16). The prevalence of having made a suicide plan was higher among black female (12.4%) than black male (8.4%) students and higher among 10th grade female (19.5%) than 10th grade male (13.1%) students. Overall, the prevalence of having made a suicide plan was higher among white (16.2%) and Hispanic (17.6%) than black (10.4%) students; higher among white female (18.6%) and Hispanic female (20.7%) than black female (12.4%) students; and higher among white male (13.9%) than black male (8.4%) students. Prevalence of having made a suicide plan ranged from 10.9% to 17.2% across state surveys (median: 13.3%) and from 8.6% to 16.7% across local surveys (median: 11.7%) (Table 17). Attempted Suicide Nationwide, 8.5% of students had actually attempted suicide one or more times during the 12 months preceding the survey (Table 18). Overall, the prevalence of having attempted suicide was higher among female (11.5%) than male (5.4%) students; higher among white female (10.3%) and Hispanic female (15.0%) than white male (3.7%) and Hispanic male (6.1%) students, respectively; and higher among 9th grade female (14.7%), 10th grade female (12.7%), and 11th grade female (10.0%) than 9th grade male (5.8%), 10th grade male (5.5%), and 11th grade male (4.6%) students, respectively. Overall, the prevalence of having attempted suicide was higher among Hispanic (10.6%) than white (6.9%) and black (8.4%) students; higher among Hispanic female (15.0%) than white female (10.3%) and black female (9.0%) students; and higher among black male (7.7%) and Hispanic male (6.1%) than white male (3.7%) students. Overall, the prevalence of having attempted suicide was higher among 9th grade (10.1%) than 11th grade (7.3%) and 12th grade (6.1%) students; higher among 10th grade (9.1%) than 12th grade (6.1%) students; higher among 9th grade female (14.7%) than 11th grade female (10.0%) and 12th grade female (6.9%) students; and higher among 10th grade female (12.7%) than 12th grade female (6.9%) students. Prevalence of having attempted suicide ranged from 6.6% to 11.9% across state surveys (median: 8.5%) and from 7.4% to 12.3% across local surveys (median: 9.9%) (Table 19). Suicide Attempt Required Medical Attention During the 12 months preceding the survey, 2.9% of students nationwide had made a suicide attempt that resulted in an injury, poisoning, or overdose that had to be treated by a doctor or nurse (Table 18). The prevalence of having made a suicide attempt that required medical attention was higher among white female (2.4%) than white male (1.1%) students. Overall, the prevalence of having made a suicide attempt that required medical attention was higher among black (3.7%) and Hispanic (5.0%) than white (1.7%) students; higher among Hispanic female (5.7%) than white female (2.4%) and black female (2.2%) students; and higher among black male (5.2%) and Hispanic male (4.2%) than white male (1.1%) students. Prevalence of having made a suicide attempt that required medical attention ranged from 1.6% to 5.0% across state surveys (median: 2.7%) and from 1.7% to 4.8% across local surveys (median: 3.3%) (Table 19). Tobacco UseLifetime Cigarette Use Nationwide, 58.4% of students had ever tried cigarette smoking (even one or two puffs) (i.e., lifetime cigarette use) (Table 20). Overall, the prevalence of lifetime cigarette use was higher among 10th grade (58.3%), 11th grade (60.0%), and 12th grade (65.4%) than 9th grade (52.0%) students; higher among 12th grade (65.4%) than 10th grade (58.3%) and 11th grade (60.0%) students; higher among 11th grade female (59.8%) and 12th grade female (65.9%) than 9th grade female (50.9%) students; higher among 12th grade female (65.9%) than 10th grade female (57.7%) and 11th grade female (59.8%) students; and higher among 12th grade male (64.7%) than 9th grade male (53.0%) students. Prevalence of lifetime cigarette use ranged from 32.8% to 71.1% across state surveys (median: 59.9%) and from 43.9% to 66.4% across local surveys (median: 53.5%) (Table 21). Lifetime Daily Cigarette Use Nationwide, 15.8% of students had ever smoked one or more cigarettes every day for 30 days (i.e., lifetime daily cigarette use) (Table 20). The prevalence of lifetime daily cigarette use was higher among white female (20.9%) and black male (10.9%) than white male (17.1%) and black female (5.2%) students, respectively. Overall, the prevalence of lifetime daily cigarette use was higher among white (18.9%) than black (8.2%) and Hispanic (10.7%) students; higher among white female (20.9%) than black female (5.2%) and Hispanic female (9.1%) students; higher among Hispanic female (9.1%) than black female (5.2%) students; and higher among white male (17.1%) than black male (10.9%) and Hispanic male (12.2%) students. Overall, the prevalence of lifetime daily cigarette use was higher among 11th grade (18.1%) and 12th grade (19.8%) than 9th grade (11.5%) students; higher among 12th grade (19.8%) than 10th grade (15.0%) students; higher among 11th grade female (18.4%) and 12th grade female (18.3%) than 9th grade female (11.6%) students; higher among 11th grade male (17.8%) and 12th grade male (21.0%) than 9th grade male (11.4%) students; and higher among 12th grade male (21.0%) than 10th grade male (14.3%) students. Prevalence of lifetime daily cigarette use ranged from 6.0% to 26.0% (median: 17.0%) across state surveys and from 4.7% to 13.4% across local surveys (median: 7.9%) (Table 21). Current Cigarette Use Nationwide, 21.9% of students had smoked cigarettes on >1 of the 30 days preceding the survey (i.e., current cigarette use) (Table 20). The prevalence of current cigarette use was higher among black male (19.3%) than black female (10.8%) students and higher among 12th grade male (29.0%) than 12th grade female (23.3%) students. Overall, the prevalence of current cigarette use was higher among white (24.9%) than black (15.1%) and Hispanic (18.4%) students; higher among white female (26.6%) than black female (10.8%) and Hispanic female (17.7%) students; and higher among Hispanic female (17.7%) than black female (10.8%) students. Overall, the prevalence of current cigarette use was higher among 10th grade (21.8%), 11th grade (23.6%), and 12th grade (26.2%) than 9th grade (17.4%) students; higher among 12th grade (26.2%) than 10th grade (21.8%) students; higher among 10th grade male (21.7%), 11th grade male (23.2%), and 12th grade male (29.0%) than 9th grade male (16.0%) students; and higher among 12th grade male (29.0%) than 10th grade male (21.7%) and 11th grade male (23.2%) students. Prevalence of current cigarette use ranged from 7.3% to 32.7% across state surveys (median: 23.2%) and from 9.1% to 18.1% across local surveys (median: 13.4%) (Table 21, Figure 4). Current Frequent Cigarette Use Approximately one tenth (9.7%) of students nationwide had smoked cigarettes on >20 of the 30 days preceding the survey (i.e., current frequent cigarette use) (Table 22). The prevalence of current frequent cigarette use was higher among black male (7.9%) than black female (3.1%) students. Overall, the prevalence of current frequent cigarette use was higher among white (11.8%) than black (5.5%) and Hispanic (5.5%) students; higher among white female (13.2%) than black female (3.1%) and Hispanic female (4.4%) students; and higher among white male (10.4%) than Hispanic male (6.6%) students. Overall, the prevalence of current frequent cigarette use was higher among 10th grade (9.2%), 11th grade (11.2%), and 12th grade (13.1%) than 9th grade (6.3%) students; higher among 12th grade (13.1%) than 10th grade (9.2%) students; higher among 11th grade female (11.8%) and 12th grade female (11.4%) than 9th grade female (6.9%) students; higher among 10th grade male (9.5%), 11th grade male (10.5%), and 12th grade male (14.5%) than 9th grade male (5.7%) students; and higher among 12th grade male (14.5%) than 10th grade male (9.5%) and 11th grade male (10.5%) students. Prevalence of current frequent cigarette use ranged from 3.0% to 18.4% across state surveys (median: 11.1%) and from 1.7% to 8.2% across local surveys (median: 4.0%) (Table 23). Smoked >10 Cigarettes/Day Nationwide, 3.1% of students had smoked >10 cigarettes/day on the days they smoked during the 30 days preceding the survey (Table 22). Overall, the prevalence of having smoked >10 cigarettes/day was higher among male (3.6%) than female (2.4%) students; higher among black male (2.1%) than black female (0.6%) students; and higher among 12th grade male (6.8%) than 12th grade female (2.6%) students. Overall, the prevalence of having smoked >10 cigarettes/day was higher among white (3.4%) than black (1.4%) and Hispanic (1.7%) students; higher among white female (3.1%) than black female (0.6%) and Hispanic female (1.4%) students; and higher among white male (3.6%) than black male (2.1%) and Hispanic male (2.0%) students. Overall, the prevalence of having smoked >10 cigarettes/day was higher among 12th grade (4.8%) than 9th grade (1.9%) and 10th grade (2.4%) students; higher among 11th grade female (3.1%) than 9th grade female (1.3%) students; and higher among 12th grade male (6.8%) than 9th grade male (2.4%), 10th grade male (2.4%), and 11th grade male (3.5%) students. Prevalence of having smoked >10 cigarettes/day ranged from 0.3% to 5.8% across state surveys (median: 2.8%) and from 0.2% to 2.3% across local surveys (median: 0.9%) (Table 23). Purchased Cigarettes at a Store or Gas Station Data regarding access to cigarettes are reported only for the 20.8% of students aged <18 years who reported current cigarette smoking. Nationwide, 18.9% of these students had purchased their cigarettes in a store or gas station during the 30 days preceding the survey (Table 22). Overall, the prevalence of having purchased cigarettes in a store or gas station was higher among male (24.2%) than female (13.8%) students; higher among white male (24.1%) than white female (12.0%) students; and higher among 10th grade male (19.3%), 11th grade male (34.5%), and 12th grade male (33.6%) than 10th grade female (7.8%), 11th grade female (21.2%), and 12th grade female (18.9%) students, respectively. Overall, the prevalence of having purchased cigarettes in a store or gas station was higher among 11th grade (27.9%) and 12th grade (26.1%) than 9th grade (12.0%) and 10th grade (13.6%) students; higher among 11th grade female (21.2%) than 9th grade female (10.4%) and 10th grade female (7.8%) students; higher among 12th grade female (18.9%) than 10th grade female (7.8%) students; and higher among 11th grade male (34.5%) and 12th grade male (33.6%) than 9th grade male (13.8%) and 10th grade male (19.3%) students. Prevalence of having purchased cigarettes in a store or gas station ranged from 5.9% to 24.1% across state surveys (median: 16.3%) and from 13.2% to 39.9% across local surveys (median: 22.7%) (Table 23). Current Smokeless Tobacco Use Nationwide, 6.7% of students had used smokeless tobacco (e.g., chewing tobacco, snuff, or dip) on >1 of the 30 days preceding the survey (i.e., current smokeless tobacco use) (Table 24). Overall, the prevalence of current smokeless tobacco use was higher among male (11.0%) than female (2.2%) students; higher among white male (13.2%) than white female (1.6%) students; and higher among 9th grade male (9.1%), 10th grade male (9.6%), 11th grade male (13.3%), and 12th grade male (12.7%) than 9th grade female (3.8%), 10th grade female (1.0%), 11th grade female (2.0%), and 12th grade female (1.3%) students, respectively. Overall, the prevalence of current smokeless tobacco use was higher among white (7.6%) than black (3.0%) students and higher among white male (13.2%) than black male (4.1%) and Hispanic male (6.1%) students. The prevalence of current smokeless tobacco use was higher among 9th grade female (3.8%) than 10th grade female (1.0%) students and higher among 11th grade male (13.3%) than 9th grade male (9.1%) students. Prevalence of current smokeless tobacco use ranged from 3.1% to 15.3% across state surveys (median: 7.2%) and from 1.5% to 5.5% across local surveys (median: 2.7%) (Table 25). Current Cigar Use Nationwide, 14.8% of students had smoked cigars, cigarillos, or little cigars on >1 of the 30 days preceding the survey (i.e. current cigar use) (Table 24). Overall, the prevalence of current cigar use was higher among male (19.9%) than female (9.4%) students; higher among white male (21.3%) and black male (19.5%) than white female (8.6%) and black female (10.3%) students, respectively; and higher among 10th grade male (17.0%), 11th grade male (22.2%), and 12th grade male (29.8%) than 10th grade female (9.3%), 11th grade female (10.0%), and 12th grade female (7.8%) students, respectively. The prevalence of current cigar use was higher among white male (21.3%) and black male (19.5%) than Hispanic male (14.9%) students. Overall, the prevalence of current cigar use was higher among 11th grade (16.3%) and 12th grade (19.1%) than 9th grade (11.9%) students; higher among 12th grade (19.1%) than 10th grade (13.2%) students; higher among 11th grade male (22.2%) and 12th grade male (29.8%) than 9th grade male (13.6%) and 10th grade male (17.0%) students; and higher among 12th grade male (29.8%) than 11th grade male (22.2%) students. Prevalence of current cigar use ranged from 7.3% to 18.7% across state surveys (median: 13.5%) and from 5.2% to 17.0% across local surveys (median: 10.6%) (Table 25). Current Tobacco Use Nationwide, 27.5% of students had reported current cigarette use, current smokeless tobacco use, or current cigar use on >1 of the 30 days preceding the survey (i.e., current tobacco use) (Table 24). Overall, the prevalence of current tobacco use was higher among male (30.3%) than female (24.6%) students; higher among black male (23.7%) and Hispanic male (24.9%) than black female (14.9%) and Hispanic female (19.8%) students, respectively; and higher among 10th grade male (29.2%), 11th grade male (33.7%), and 12th grade male (40.3%) than 10th grade female (23.6%), 11th grade female (27.0%), and 12th grade female (25.7%) students, respectively. Overall, the prevalence of current tobacco use was higher among white (31.1%) than black (19.3%) and Hispanic (22.4%) students; higher among white female (28.9%) than black female (14.9%) and Hispanic female (19.8%) students; higher among Hispanic female (19.8%) than black female (14.9%) students; and higher among white male (33.2%) than black male (23.7%) and Hispanic male (24.9%) students. Overall, the prevalence of current tobacco use was higher among 10th grade (26.4%), 11th grade (30.4%), and 12th grade (33.0%) than 9th grade (22.0%) students; higher among 12th grade (33.0%) than 10th grade (26.4%) students; higher among 10th grade male (29.2%), 11th grade male (33.7%), and 12th grade male (40.3%) than 9th grade male (21.5%) students; and higher among 12th grade male (40.3%) than 10th grade male (29.2%) and 11th grade male (33.7%) students. Prevalence of current tobacco use ranged from 10.3% to 41.2% across state surveys (median: 27.7%) and from 11.8% to 22.0% across local surveys (median: 15.8%) (Table 25). Alcohol and Other Drug UseLifetime Alcohol Use Approximately three fourths (74.9%) of students nationwide had had one or more drinks of alcohol on >1 day during their lifetime (i.e., lifetime alcohol use) (Table 26). Overall, the prevalence of lifetime alcohol use was higher among Hispanic (79.5%) than black (71.4%) students; higher among Hispanic female (81.4%) than black female (74.0%) students; and higher among white male (74.3%) and Hispanic male (77.5%) than black male (68.6%) students. Overall, the prevalence of lifetime alcohol use was higher among 10th grade (75.7%), 11th grade (78.6%), and 12th grade (83.0%) than 9th grade (65.0%) students; higher among 12th grade (83.0%) than 10th grade (75.7%) students; higher among 10th grade female (76.5%), 11th grade female (80.9%), and 12th grade female (83.3%) than 9th grade female (66.2%) students; higher among 12th grade female (83.3%) than 10th grade female (76.5%) students; higher among 10th grade male (74.9%), 11th grade male (76.4%), and 12th grade male (82.6%) than 9th grade male (64.0%) students; and higher among 12th grade male (82.6%) than 10th grade male (74.9%) and 11th grade male (76.4%) students. Prevalence of lifetime alcohol use ranged from 43.3% to 81.1% across state surveys (median: 75.7%) and from 63.7% to 81.5% across local surveys (median: 70.1%) (Table 27). Current Alcohol Use Nationwide, 44.9% of students had had one or more drinks of alcohol on >1 of the 30 days preceding the survey (i.e., current alcohol use) (Table 26). The prevalence of current alcohol use was higher among Hispanic female (48.4%) than Hispanic male (42.7%) students. Overall, the prevalence of current alcohol use was higher among white (47.1%) and Hispanic (45.6%) than black (37.4%) students; higher among white female (48.4%) and Hispanic female (48.4%) than black female (37.0%) students; and higher among white male (45.9%) than black male (37.5%) students. Overall, the prevalence of current alcohol use was higher among 10th grade (43.5%), 11th grade (47.0%), and 12th grade (55.9%) than 9th grade (36.2%) students; higher among 12th grade (55.9%) than 10th grade (43.5%) and 11th grade (47.0%) students; higher among 10th grade female (44.9%), 11th grade female (46.8%), and 12th grade female (55.5%) than 9th grade female (38.5%) students; higher among 12th grade female (55.5%) than 10th grade female (44.9%) and 11th grade female (46.8%) students; higher among 10th grade male (42.2%), 11th grade male (47.3%), and 12th grade male (56.0%) than 9th grade male (33.9%) students; and higher among 12th grade male (56.0%) than 10th grade male (42.2%) and 11th grade male (47.3%) students. Prevalence of current alcohol use ranged from 21.3% to 54.2% across state surveys (median: 44.3%) and from 28.7% to 44.4% across local surveys (median: 37.6%) (Table 27). Episodic Heavy Drinking Nationwide, 28.3% of students had had >5 drinks of alcohol in a row (i.e., within a couple of hours) on >1 of the 30 days preceding the survey (i.e., episodic heavy drinking) (Table 26). The prevalence of episodic heavy drinking was higher among black male (17.9%) than black female (12.7%) students. Overall, the prevalence of episodic heavy drinking was higher among white (31.8%) and Hispanic (28.9%) than black (15.3%) students; higher among white female (31.5%) and Hispanic female (29.8%) than black female (12.7%) students; and higher among white male (32.1%) and Hispanic male (27.9%) than black male (17.9%) students. Overall, the prevalence of episodic heavy drinking was higher among 10th grade (27.4%), 11th grade (31.8%), and 12th grade (37.2%) than 9th grade (19.8%) students; higher among 11th grade (31.8%) and 12th grade (37.2%) than 10th grade (27.4%) students; higher among 12th grade (37.2%) than 11th grade (31.8%) students; higher among 10th grade female (27.2%), 11th grade female (29.4%), and 12th grade female (34.5%) than 9th grade female (20.9%) students; higher among 12th grade female (34.5%) than 10th grade female (27.2%) and 11th grade female (29.4%) students; higher among 10th grade male (27.7%), 11th grade male (34.1%), and 12th grade male (39.5%) than 9th grade male (18.8%) students; and higher among 11th grade male (34.1%) and 12th grade male (39.5%) than 10th grade male (27.7%) students. Prevalence of episodic heavy drinking ranged from 14.3% to 39.5% across state surveys (median: 27.1%) and from 10.0% to 24.5% across local surveys (median: 16.7%) (Table 27). Lifetime Marijuana Use Nationwide, 40.2% of students had used marijuana one or more times during their lifetime (i.e., lifetime marijuana use) (Table 28). Overall, the prevalence of lifetime marijuana use was higher among male (42.7%) than female (37.6%) students; higher among black male (49.0%) and Hispanic male (46.7%) than black female (37.6%) and Hispanic female (38.5%) students, respectively; and higher among 10th grade male (44.2%) and 12th grade male (51.7%) than 10th grade female (36.4%) and 12th grade female (44.9%) students, respectively. The prevalence of lifetime marijuana use was higher among black male (49.0%) and Hispanic male (46.7%) than white male (40.5%) students. Overall, the prevalence of lifetime marijuana use was higher among 10th grade (40.4%), 11th grade (44.5%), and 12th grade (48.5%) than 9th grade (30.7%) students; higher among 12th grade (48.5%) than 10th grade (40.4%) students; higher among 10th grade female (36.4%), 11th grade female (43.5%), and 12th grade female (44.9%) than 9th grade female (28.1%) students; higher among 11th grade female (43.5%) and 12th grade female (44.9%) than 10th grade female (36.4%) students; higher among 10th grade male (44.2%), 11th grade male (45.4%), and 12th grade male (51.7%) than 9th grade male (33.1%) students; and higher among 12th grade male (51.7%) than 10th grade male (44.2%) students. Prevalence of lifetime marijuana use ranged from 21.6% to 49.6% across state surveys (median: 42.5%) and from 29.8% to 52.2% across local surveys (median: 40.9%) (Table 29, Figure 5). Current Marijuana Use Nationwide, 22.4% of students had used marijuana one or more times during the 30 days preceding the survey (i.e., current marijuana use) (Table 28). Overall, the prevalence of current marijuana use was higher among male (25.1%) than female (19.3%) students; higher among black male (29.8%) and Hispanic male (27.1%) than black female (18.1%) and Hispanic female (20.4%) students, respectively; and higher among 10th grade male (25.7%), 11th grade male (27.3%), and 12th grade male (30.0%) than 10th grade female (18.2%), 11th grade female (20.9%), and 12th grade female (21.3%) students, respectively. The prevalence of current marijuana use was higher among black male (29.8%) than white male (23.3%) students. Overall, the prevalence of current marijuana use was higher among 11th grade (24.1%) and 12th grade (25.8%) than 9th grade (18.5%) students; higher among 12th grade (25.8%) than 10th grade (22.0%) students; and higher among 10th grade male (25.7%), 11th grade male (27.3%), and 12th grade male (30.0%) than 9th grade male (19.6%) students. Prevalence of current marijuana use ranged from 11.4% to 30.6% across state surveys (median: 21.9%) and from 15.3% to 28.7% across local surveys (median: 22.3%) (Table 29). Lifetime Cocaine Use Nationwide, 8.7% of students had used a form of cocaine (e.g., powder, "crack,"** or "freebase"††) one or more times during their lifetime (i.e., lifetime cocaine use) (Table 30). The prevalence of lifetime cocaine use was higher among black male (4.8%) than black female (1.4%) students and higher among 12th grade male (12.9%) than 12th grade female (7.9%) students. Overall, the prevalence of lifetime cocaine use was higher among white (8.7%) and Hispanic (12.5%) than black (3.2%) students; higher among Hispanic (12.5%) than white (8.7%) students; higher among white female (8.0%) and Hispanic female (13.0%) than black female (1.4%) students; higher among Hispanic female (13.0%) than white female (8.0%) students; and higher among white male (9.3%) and Hispanic male (12.0%) than black male (4.8%) students. Overall, the prevalence of lifetime cocaine use was higher among 11th grade (9.0%) and 12th grade (10.5%) than 9th grade (6.8%) students; and higher among 10th grade male (9.7%), 11th grade male (10.2%), and 12th grade male (12.9%) than 9th grade male (6.1%) students. Prevalence of lifetime cocaine use ranged from 5.7% to 12.7% across state surveys (median: 8.4%) and from 2.3% to 11.9% across local surveys (median: 6.0%) (Table 31). Current Cocaine Use Nationwide, 4.1% of students had used a form of cocaine one or more times during the 30 days preceding the survey (i.e., current cocaine use) (Table 30). The prevalence of current cocaine use was higher among black male (3.3%) than black female (0.9%) students and higher among 12th grade male (5.8%) than 12th grade female (3.5%) students. Overall, the prevalence of current cocaine use was higher among white (3.8%) and Hispanic (5.7%) than black (2.2%) students; higher among Hispanic (5.7%) than white (3.8%) students; higher among white female (3.7%) and Hispanic female (5.8%) than black female (0.9%) students; higher among Hispanic female (5.8%) than white female (3.7%) students; and higher among Hispanic male (5.5%) than black male (3.3%) students. The prevalence of current cocaine use was higher among 12th grade male (5.8%) than 9th grade male (3.1%) students. Prevalence of current cocaine use ranged from 2.0% to 5.8% across state surveys (median: 3.8%) and from 0.8% to 4.9% across local surveys (median: 2.8%) (Table 31). Lifetime Illegal Injection-Drug Use Nationwide, 3.2% of students had used a needle to inject any illegal drug into their body one or more times during their lifetime§§ (i.e., lifetime illegal injection-drug use) (Table 30). The prevalence of lifetime illegal injection-drug use was higher among black male (3.4%) than black female (1.5%) students. Prevalence of lifetime illegal injection-drug use ranged from 1.3% to 3.3% across state surveys (median: 2.3%) and from 0.7% to 3.9% across local surveys (median: 1.7%) (Table 31). Lifetime Inhalant Use Nationwide, 12.1% of student had sniffed glue, breathed the contents of aerosol spray cans, or inhaled any paints or sprays to get high one or more times during their lifetime (i.e., lifetime inhalant use) (Table 32). Overall, the prevalence of lifetime inhalant use was higher among white (12.8%) and Hispanic (12.7%) than black (7.0%) students; higher among white female (12.2%) and Hispanic female (13.9%) than black female (6.4%) students; and higher among white male (13.3%) and Hispanic male (11.6%) than black male (7.5%) students. Overall, the prevalence of lifetime inhalant use was higher among 9th grade (13.6%) than 10th grade (11.1%) students and higher among 9th grade female (14.6%) than 10th grade female (10.3%), 11th grade female (9.4%), and 12th grade female (10.3%) students. Prevalence of lifetime inhalant use ranged from 9.6% to 15.4% across state surveys (median: 12.4%) and from 5.1% to 13.5% across local surveys (median: 9.2%) (Table 33). Current Inhalant Use Nationwide, 3.9% of students had used inhalants one or more times during the 30 days preceding the survey (i.e., current inhalant use) (Table 32). The prevalence of current inhalant use was higher among 10th grade male (4.3%) and 11th grade male (4.1%) than 10th grade female (2.6%) and 11th grade female (2.0%) students, respectively. The prevalence of current inhalant use was higher among Hispanic female (4.7%) than black female (2.2%) students. Overall, the prevalence of current inhalant use was higher among 9th grade (5.4%) than 10th grade (3.5%), 11th grade (3.1%), and 12th grade (2.7%) students and higher among 9th grade female (5.7%) than 10th grade female (2.6%), 11th grade female (2.0%), and 12th grade female (2.3%) students. Prevalence of current inhalant use ranged from 2.4% to 5.5% across state surveys (median: 3.8%) and from 1.4% to 5.0% across local surveys (median: 3.6%) (Table 33). Lifetime Illegal Steroid Use Nationwide, 6.1% of students had taken steroid pills or shots without a doctor's prescription one or more times during their lifetime (i.e., lifetime illegal steroid use) (Table 32). The prevalence of lifetime illegal steroid use was higher among black male (5.4%) than black female (1.9%) students and higher among 12th grade male (6.4%) than 12th grade female (3.3%) students. Overall, the prevalence of lifetime illegal steroid use was higher among white (6.2%) and Hispanic (7.2%) than black (3.6%) students and higher among white female (5.6%) and Hispanic female (6.6%) than black female (1.9%) students. The prevalence of lifetime illegal steroid use was higher among 9th grade female (7.3%) than 12th grade female (3.3%) students. Prevalence of lifetime illegal steroid use ranged from 3.2% to 7.1% across state surveys (median: 4.8%) and from 2.3% to 7.4% across local surveys (median: 3.1%) (Table 33). Lifetime Heroin Use Nationwide, 3.3% of students had used heroin one or more times during their lifetime (i.e., lifetime heroin use) (Table 34). Overall, the prevalence of lifetime heroin use was higher among male (4.3%) than female (2.0%) students; higher among white male (3.3%) and black male (4.4%) than white female (1.8%) and black female (0.8%) students, respectively; and higher among 10th grade male (4.0%), 11th grade male (3.9%), and 12th grade male (4.1%) than 10th grade female (1.7%), 11th grade female (1.9%), and 12th grade female (1.4%) students, respectively. Overall, the prevalence of lifetime heroin use was higher among Hispanic (3.9%) than white (2.6%) students; higher among white female (1.8%) and Hispanic female (3.4%) than black female (0.8%) students; and higher among Hispanic female (3.4%) than white female (1.8%) students. Prevalence of lifetime heroin use ranged from 1.7% to 3.8% across state surveys (median: 2.8%) and from 1.4% to 5.4% across local surveys (median: 2.3%) (Table 35). Lifetime Methamphetamine Use Nationwide, 7.6% of students had used methamphetamines one or more times during their lifetime (i.e., lifetime methamphetamine use) (Table 34). The prevalence of lifetime methamphetamine use was higher among black male (4.6%) than black female (1.7%) students and higher among 11th grade male (9.4%) and 12th grade male (9.8%) than 11th grade female (6.7%) and 12th grade female (5.9%) students, respectively. Overall, the prevalence of lifetime methamphetamine use was higher among white (8.1%) and Hispanic (8.3%) than black (3.1%) students; higher among white female (7.8%) and Hispanic female (8.1%) than black female (1.7%) students; and higher among white male (8.4%) and Hispanic male (8.5%) than black male (4.6%) students. The prevalence of lifetime methamphetamine use was higher among 11th grade male (9.4%) and 12th grade male (9.8%) than 9th grade male (6.3%) students. Prevalence of lifetime methamphetamine use ranged from 4.7% to 12.5% across state surveys (median: 7.5%) and from 1.7% to 8.5% across local surveys (median: 4.5%) (Table 35). Lifetime Ecstasy Use Nationwide, 11.1% of students had used ecstasy one or more times during their lifetime (i.e., lifetime ecstasy use) (Table 34). The prevalence of lifetime ecstasy use was higher among black male (8.3%) than black female (3.8%) students. Overall, the prevalence of lifetime ecstasy use was higher among Hispanic (13.0%) than black (6.0%) students; higher among white female (11.4%) and Hispanic female (11.5%) than black female (3.8%) students; and higher among Hispanic male (14.4%) than black male (8.3%) students. Prevalence of lifetime ecstasy use ranged from 4.9% to 10.3% across states (median: 7.6%) and from 3.1% to 12.1% across local surveys (median: 6.3%) (Table 35). Age of Initiation of Risk BehaviorsCigarette Smoking Before Age 13 Years Nationwide, 18.3% of students had smoked a whole cigarette for the first time before age 13 years (Table 36). Overall, the prevalence of having smoked a whole cigarette before age 13 years was higher among male (20.0%) than female (16.4%) students; higher among black male (19.2%) than black female (11.5%) students; and higher among 11th grade male (18.0%) than 11th grade female (14.1%) students. Overall, the prevalence of having smoked a whole cigarette before age 13 years was higher among white (18.9%) and Hispanic (18.3%) than black (15.3%) students and higher among white female (18.4%) and Hispanic female (16.1%) than black female (11.5%) students. Overall, the prevalence of having smoked a whole cigarette before age 13 years was higher among 10th grade (20.1%) than 11th grade (16.0%) and 12th grade (16.5%) students and higher among 10th grade female (18.4%) than 11th grade female (14.1%) students. Prevalence of having smoked a whole cigarette before age 13 years ranged from 9.1% to 29.4% across state surveys (median: 19.2%) and from 12.4% to 18.8% across local surveys (median: 15.0%) (Table 37). Alcohol Use Before Age 13 Years Nationwide, 27.8% of students had drunk alcohol (other than a few sips) for the first time before age 13 years (Table 36). Overall, the prevalence of having drunk alcohol before age 13 years was higher among male (32.0%) than female (23.3%) students; higher among white male (30.0%), black male (35.7%), and Hispanic male (34.1%) than white female (21.2%), black female (26.8%), and Hispanic female (26.3%) students, respectively; and higher among 10th grade male (33.3%), 11th grade male (27.6%), and 12th grade male (25.1%) than 10th grade female (23.5%), 11th grade female (18.2%), and 12th grade female (15.2%) students, respectively. Overall, the prevalence of having drunk alcohol before age 13 years was higher among black (31.2%) and Hispanic (30.2%) than white (25.7%) students; higher among black female (26.8%) and Hispanic female (26.3%) than white female (21.2%) students; and higher among black male (35.7%) than white male (30.0%) students. Overall, the prevalence of having drunk alcohol before age 13 years was higher among 9th grade (36.4%) than 10th grade (28.5%), 11th grade (23.0%), and 12th grade (20.3%) students; higher among 10th grade (28.5%) than 11th grade (23.0%) and 12th grade (20.3%) students; higher among 9th grade female (33.3%) than 10th grade female (23.5%), 11th grade female (18.2%), and 12th grade female (15.2%) students; higher among 10th grade female (23.5%) than 11th grade female (18.2%) and 12th grade female (15.2%) students; higher among 9th grade male (39.4%) than 10th grade male (33.3%), 11th grade male (27.6%), and 12th grade male (25.1%) students; and higher among 10th grade male (33.3%) than 12th grade male (25.1%) students. Prevalence of having drunk alcohol before age 13 years ranged from 17.4% to 34.7% across state surveys (median: 26.4%) and from 24.4% to 32.9% across local surveys (median: 28.9%) (Table 37). Marijuana Use Before Age 13 Years One tenth (9.9%) of students nationwide had tried marijuana for the first time before age 13 years (Table 36). Overall, the prevalence of having tried marijuana before age 13 years was higher among male (12.6%) than female (6.9%) students; higher among white male (10.5%), black male (18.5%), and Hispanic male (13.0%) than white female (6.8%), black female (5.8%), and Hispanic female (8.5%) students, respectively; and higher among 9th grade male (13.6%), 10th grade male (14.3%), 11th grade male (10.9%), and 12th grade male (11.0%) than 9th grade female (9.7%), 10th grade female (7.3%), 11th grade female (5.2%), and 12th grade female (4.3%) students, respectively. Overall, the prevalence of having tried marijuana before age 13 years was higher among black (12.1%) than white (8.7%) students and higher among black male (18.5%) than white male (10.5%) and Hispanic male (13.0%) students. Overall, the prevalence of having tried marijuana before age 13 years was higher among 9th grade (11.7%) and 10th grade (10.8%) than 11th grade (8.1%) and 12th grade (7.8%) students; higher among 9th grade female (9.7%) than 11th grade female (5.2%) and 12th grade female (4.3%) students; higher among 10th grade female (7.3%) than 12th grade female (4.3%) students; and higher among 10th grade male (14.3%) than 12th grade male (11.0%) students. Prevalence of having tried marijuana before age 13 years ranged from 5.8% to 13.4% across state surveys (median: 10.4%) and from 6.8% to 14.4% across local surveys (median: 11.0%) (Table 37). Tobacco, Alcohol, and Other Drug Use on School PropertyCigarette Use on School Property Nationwide, 8.0% of students had smoked cigarettes on school property on >1 of the 30 days preceding the survey (Table 38). The prevalence of having smoked cigarettes on school property was higher among black male (8.4%) than black female (3.5%) students and higher among 12th grade male (10.5%) than 12th grade female (5.9%) students. Overall, the prevalence of having smoked cigarettes on school property was higher among white (8.9%) than black (5.9%) and Hispanic (6.0%) students; higher among white female (9.6%) and Hispanic female (5.8%) than black female (3.5%) students; and higher among white female (9.6%) than Hispanic female (5.8%) students. The prevalence of having smoked cigarettes on school property was higher among 12th grade male (10.5%) than 9th grade male (7.3%) and 10th grade male (7.5%) students. Prevalence of having smoked cigarettes on school property ranged from 2.7% to 14.3% across state surveys (median: 7.7%) and from 2.5% to 8.7% across local surveys (median: 5.1%) (Table 39). Smokeless Tobacco Use on School Property Nationwide, 5.9% of students had used smokeless tobacco on school property on >1 of the 30 days preceding the survey (Table 38). Overall, the prevalence of having used smokeless tobacco on school property was higher among male (8.5%) than female (3.3%) students; higher among white male (9.9%) than white female (3.3%) students; and higher among 10th grade male (7.7%), 11th grade male (10.8%), and 12th grade male (10.1%) than 10th grade female (2.6%), 11th grade female (3.2%), and 12th grade female (2.3%) students, respectively. The prevalence of having used smokeless tobacco on school property was higher among white male (9.9%) than black male (3.2%) students. The prevalence of having used smokeless tobacco on school property was higher among 11th grade male (10.8%) than 9th grade male (6.0%) students. Prevalence of having used smokeless tobacco on school property ranged from 1.5% to 9.3% across state surveys (median: 4.1%) and from 0.4% to 3.5% across local surveys (median: 1.6%) (Table 39). Alcohol Use on School Property Nationwide, 5.2% of students had had one or more drinks of alcohol on school property on >1 of the 30 days preceding the survey (Table 38). Overall, the prevalence of having drunk alcohol on school property was higher among male (6.0%) than female (4.2%) students; higher among black male (7.9%) than black female (3.8%) students; and higher among 11th grade male (6.4%) and 12th grade male (6.5%) than 11th grade female (3.5%) and 12th grade female (2.6%) students, respectively. Overall, the prevalence of having drunk alcohol on school property was higher among black (5.8%) and Hispanic (7.6%) than white (3.9%) students; higher among Hispanic female (7.9%) than white female (3.2%) and black female (3.8%) students; and higher among black male (7.9%) and Hispanic male (7.4%) than white male (4.5%) students. The prevalence of having drunk alcohol on school property was higher among 9th grade female (5.2%) and 10th grade female (5.0%) than 12th grade female (2.6%) students. Prevalence of having drunk alcohol on school property ranged from 2.6% to 7.4% across state surveys (median: 4.6%) and from 3.1% to 8.8% across local surveys (median: 5.7%) (Table 39). Marijuana Use on School Property Nationwide, 5.8% of students had used marijuana on school property one or more times during the 30 days preceding the survey (Table 40). Overall, the prevalence of having used marijuana on school property was higher among male (7.6%) than female (3.7%) students; higher among white male (5.8%), black male (9.7%), and Hispanic male (10.4%) than white female (3.1%), black female (3.6%), and Hispanic female (6.0%) students; and higher among 10th grade male (7.2%), 11th grade male (7.9%), and 12th grade male (7.1%) than 10th grade female (3.0%), 11th grade female (3.3%), and 12th grade female (2.6%) students, respectively. Overall, the prevalence of having used marijuana on school property was higher among Hispanic (8.2%) than white (4.5%) students; higher among Hispanic female (6.0%) than white female (3.1%) and black female (3.6%) students; and higher among black male (9.7%) and Hispanic male (10.4%) than white male (5.8%) students. The prevalence of having used marijuana on school property was higher among 9th grade female (5.1%) than 12th grade female (2.6%) students. Prevalence of having used marijuana on school property ranged from 2.6% to 8.0% across state surveys (median: 4.5%) and from 3.3% to 8.2% across local surveys (median: 6.7%) (Table 41). Offered, Sold, or Given an Illegal Drug on School Property Nationwide, 28.7% of students had been offered, sold, or given an illegal drug on school property during the 12 months preceding the survey (Table 40). Overall, the prevalence of having been offered, sold, or given an illegal drug on school property was higher among male (31.9%) than female (25.0%) students; higher among black male (27.7%) and Hispanic male (40.6%) than black female (18.3%) and Hispanic female (32.5%) students, respectively; and higher among 11th grade male (33.5%) and 12th grade male (29.7%) than 11th grade female (26.1%) and 12th grade female (19.6%) students, respectively. Overall, the prevalence of having been offered, sold, or given an illegal drug on school property was higher among Hispanic (36.5%) than white (27.5%) and black (23.1%) students; higher among Hispanic female (32.5%) than white female (24.5%) and black female (18.3%) students; and higher among Hispanic male (40.6%) than white male (30.2%) and black male (27.7%) students. The prevalence of having been offered, sold, or given an illegal drug on school property was higher among 9th grade female (26.7%) and 10th grade female (26.5%) than 12th grade female (19.6%) students. Prevalence of having been offered, sold, or given an illegal drug on school property ranged from 18.1% to 34.5% across state surveys (median: 26.7%) and from 18.3% to 41.1% across local surveys (median: 31.2%) (Table 41). Sexual Behaviors That Contribute to Unintended Pregnancy and Stds, Including HIV InfectionSexual Intercourse Nationwide, 46.7% of students had had sexual intercourse during their lifetime (Table 42). The prevalence of having had sexual intercourse was higher among black male (73.8%) and Hispanic male (56.8%) than black female (60.9%) and Hispanic female (46.4%) students, respectively, and higher among 9th grade male (37.3%) than 9th grade female (27.9%) students. Overall, the prevalence of having had sexual intercourse was higher among black (67.3%) than white (41.8%) and Hispanic (51.4%) students; higher among Hispanic (51.4%) than white (41.8%) students; higher among black female (60.9%) than white female (43.0%) and Hispanic female (46.4%) students; higher among black male (73.8%) than white male (40.5%) and Hispanic male (56.8%) students; and higher among Hispanic male (56.8%) than white male (40.5%) students. Overall, the prevalence of having had sexual intercourse was higher among 10th grade (44.1%), 11th grade (53.2%), and 12th grade (61.6%) than 9th grade (32.8%) students; higher among 11th grade (53.2%) and 12th grade (61.6%) than 10th grade (44.1%) students; higher among 12th grade (61.6%) than 11th grade (53.2%) students; higher among 10th grade female (43.1%), 11th grade female (53.1%), and 12th grade female (62.3%) than 9th grade female (27.9%) students; higher among 11th grade female (53.1%) and 12th grade female (62.3%) than 10th grade female (43.1%) students; higher among 12th grade female (62.3%) than 11th grade female (53.1%) students; higher among 10th grade male (45.1%), 11th grade male (53.4%), and 12th grade male (60.7%) than 9th grade male (37.3%) students; and higher among 11th grade male (53.4%) and 12th grade male (60.7%) than 10th grade male (45.1%) students. Prevalence of having had sexual intercourse ranged from 36.4% to 61.0% across state surveys (median: 44.3%) and from 38.8% to 63.9% across local surveys (median: 53.7%) (Table 43, Figure 6). Sexual Intercourse Before Age 13 Years Nationwide, 7.4% of students had sexual intercourse for the first time before age 13 years (Table 42). Overall, the prevalence of having sexual intercourse before age 13 years was higher among male (10.4%) than female (4.2%) students; higher among black male (31.8%) and Hispanic male (11.6%) than black female (6.9%) and Hispanic female (5.2%) students, respectively; and higher among 9th grade male (13.2%), 10th grade male (11.2%), 11th grade male (7.5%), and 12th grade male (8.8%) than 9th grade female (5.3%), 10th grade female (5.7%), 11th grade female (3.2%), and 12th grade female (1.9%) students, respectively. Overall, the prevalence of having sexual intercourse before age 13 years was higher among black (19.0%) and Hispanic (8.3%) than white (4.2%) students; higher among black (19.0%) than Hispanic (8.3%) students; higher among black female (6.9%) than white female (3.4%) students; higher among black male (31.8%) and Hispanic male (11.6%) than white male (5.0%) students; and higher among black male (31.8%) than Hispanic male (11.6%) students. Overall, the prevalence of having sexual intercourse before age 13 years was higher among 9th grade (9.3%) and 10th grade (8.5%) than 11th grade (5.4%) and 12th grade (5.5%) students; higher among 9th grade female (5.3%) and 10th grade female (5.7%) than 12th grade female (1.9%) students; higher among 10th grade female (5.7%) than 11th grade female (3.2%) students; and higher among 9th grade male (13.2%) than 11th grade male (7.5%) and 12th grade male (8.8%) students. Prevalence of having sexual intercourse before age 13 years ranged from 2.8% to 11.4% across state surveys (median: 5.8%) and from 5.9% to 18.2% across local surveys (median: 11.1%) (Table 43). Four or More Sex Partners Nationwide, 14.4% of students had had sexual intercourse during their lifetime with >4 sex partners (Table 42). Overall, the prevalence of having had >4 sex partners was higher among male (17.5%) than female (11.2%) students; higher among black male (41.7%) and Hispanic male (20.5%) than black female (16.3%) and Hispanic female (11.2%) students, respectively; and higher among 9th grade male (14.2%), 10th grade male (16.4%), 11th grade male (18.6%), and 12th grade male (22.2%) than 9th grade female (6.4%), 10th grade female (8.8%), 11th grade female (13.4%), and 12th grade female (17.9%) students, respectively. Overall, the prevalence of having had >4 sex partners was higher among black (28.8%) and Hispanic (15.7%) than white (10.8%) students; higher among black (28.8%) than Hispanic (15.7%) students; higher among black female (16.3%) than white female (10.1%) and Hispanic female (11.2%) students; higher among black male (41.7%) and Hispanic male (20.5%) than white male (11.5%) students; and higher among black male (41.7%) than Hispanic male (20.5%) students. Overall, the prevalence of having had >4 sex partners was higher among 12th grade (20.3%) than 9th grade (10.4%), 10th grade (12.6%), and 11th grade (16.0%) students; higher among 11th grade (16.0%) than 9th grade (10.4%) students; higher among 10th grade female (8.8%), 11th grade female (13.4%), and 12th grade female (17.9%) than 9th grade female (6.4%) students; higher among 11th grade female (13.4%) and 12th grade female (17.9%) than 10th grade female (8.8%) students; higher among 12th grade female (17.9%) than 11th grade female (13.4%) students; and higher among 12th grade male (22.2%) than 9th grade male (14.2%) and 10th grade male (16.4%) students. Prevalence of having had >4 sex partners ranged from 8.9% to 23.6% across state surveys (median: 13.8%) and from 9.5% to 28.0% across local surveys (median: 20.2%) (Table 43). Currently Sexually Active Approximately one third (34.3%) of students nationwide had had sexual intercourse during the 3 months preceding the survey (i.e., currently sexually active) (Table 44). The prevalence of being currently sexually active was higher among white female (33.1%) and black male (54.0%) than white male (28.5%) and black female (44.2%) students, respectively, and higher among 9th grade male (24.0%) than 9th grade female (18.3%) students. Overall, the prevalence of being currently sexually active was higher among black (49.0%) than white (30.8%) and Hispanic (37.1%) students; higher among Hispanic (37.1%) than white (30.8%) students; higher among black female (44.2%) than white female (33.1%) and Hispanic female (35.8%) students; higher among black male (54.0%) and Hispanic male (38.5%) than white male (28.5%) students; and higher among Hispanic male (38.5%) than white male (28.5%) students. Overall, the prevalence of being currently sexually active was higher among 10th grade (30.6%), 11th grade (41.1%), and 12th grade (48.9%) than 9th grade (21.2%) students; higher among 11th grade (41.1%) and 12th grade (48.9%) than 10th grade (30.6%) students; higher among 12th grade (48.9%) than 11th grade (41.1%) students; higher among 10th grade female (31.2%), 11th grade female (42.9%), and 12th grade female (51.0%) than 9th grade female (18.3%) students; higher among 11th grade female (42.9%) and 12th grade female (51.0%) than 10th grade female (31.2%) students; higher among 12th grade female (51.0%) than 11th grade female (42.9%) students; higher among 10th grade male (30.0%), 11th grade male (39.2%), and 12th grade male (46.5%) than 9th grade male (24.0%) students; higher among 11th grade male (39.2%) and 12th grade male (46.5%) than 10th grade male (30.0%) students; and higher among 12th grade male (46.5%) than 11th grade male (39.2%) students. Prevalence of being currently sexually active ranged from 26.5% to 46.3% across state surveys (median: 31.6%) and from 25.0% to 47.6% across local surveys (median: 39.0%) (Table 45). Condom Use During Last Sexual Intercourse Among the 34.3% of currently sexually active students nationwide, 63.0% reported that either they or their partner had used a condom during last sexual intercourse (Table 44). Overall, the prevalence of having used a condom during last sexual intercourse was higher among male (68.8%) than female (57.4%) students; higher among white male (69.0%), black male (81.2%), and Hispanic male (62.5%) than white female (56.5%), black female (63.6%), and Hispanic female (52.3%) students, respectively; and higher among 11th grade male (66.7%) and 12th grade male (67.0%) than 11th grade female (55.5%) and 12th grade female (48.5%) students, respectively. Overall, the prevalence of having used a condom during last sexual intercourse was higher among black (72.8%) than white (62.5%) and Hispanic (57.4%) students; higher among black female (63.6%) than white female (56.5%) and Hispanic female (52.3%) students; higher among black male (81.2%) and white male (69.0%) than Hispanic male (62.5%) students; and higher among black male (81.2%) than white male (69.0%) students. Overall, the prevalence of having used a condom during last sexual intercourse was higher among 9th grade (69.0%) and 10th grade (69.0%) than 11th grade (60.8%) and 12th grade (57.4%) students; higher among 9th grade female (66.1%) and 10th grade female (66.4%) than 12th grade female (48.5%) students; and higher among 10th grade female (66.4%) than 11th grade female (55.5%) students. Prevalence of having used a condom during last sexual intercourse ranged from 55.4% to 70.4% across state surveys (median: 62.0%) and from 52.7% to 77.5% (median: 70.2%) across local surveys (Table 45). Birth Control Pill Use Before Last Sexual Intercourse Among the 34.3% of currently sexually active students nationwide, 17.0% reported either they or their partner had used birth control pills to prevent pregnancy before last sexual intercourse (Table 44). Overall, the prevalence of having used birth control pills before last sexual intercourse was higher among female (20.6%) than male (13.1%) students; higher among white female (26.5%) and black female (11.7%) than white male (17.3%) and black male (4.4%) students, respectively; and higher among 11th grade female (24.1%) and 12th grade female (27.2%) than 11th grade male (14.8%) and 12th grade male (17.5%) students, respectively. Overall, the prevalence of having used birth control pills before last sexual intercourse was higher among white (22.3%) than black (7.9%) and Hispanic (11.2%) students; higher among white female (26.5%) than black female (11.7%) and Hispanic female (12.1%) students; higher among white male (17.3%) and Hispanic male (10.3%) than black male (4.4%) students; and higher among white male (17.3%) than Hispanic male (10.3%) students. Overall, the prevalence of having used birth control pills before last sexual intercourse was higher among 11th grade (19.6%) and 12th grade (22.6%) than 9th grade (8.7%) and 10th grade (12.7%) students; higher among 11th grade female (24.1%) and 12th grade female (27.2%) than 9th grade female (11.6%) and 10th grade female (13.5%) students; and higher among 11th grade male (14.8%) and 12th grade male (17.5%) than 9th grade male (6.6%) students. Prevalence of having used birth control pills before last sexual intercourse ranged from 11.9% to 36.7% across state surveys (median: 21.6%) and from 5.5% to 16.1% across local surveys (median: 8.6%) (Table 45). Alcohol or Drug Use Before Last Sexual Intercourse Among the 34.3% of currently sexually active students nationwide, 25.4% had drunk alcohol or used drugs before last sexual intercourse (Table 46). Overall, the prevalence of having drunk alcohol or used drugs before last sexual intercourse was higher among male (29.8%) than female (21.0%) students; higher among white male (30.5%), black male (23.8%), and Hispanic male (29.5%) than white female (23.6%), black female (14.6%), and Hispanic female (18.8%) students, respectively; and higher among 11th grade male (28.8%) and 12th grade male (33.5%) than 11th grade female (21.0%) and 12th grade female (17.6%) students, respectively. Overall, the prevalence of having drunk alcohol or used drugs before last sexual intercourse was higher among white (26.8%) and Hispanic (24.1%) than black (19.5%) students; higher among white female (23.6%) than black female (14.6%) students; and higher among white male (30.5%) than black male (23.8%) students. The prevalence of having drunk alcohol or used drugs before last sexual intercourse was higher among 10th grade female (23.1%) than 12th grade female (17.6%) students. Prevalence of having drunk alcohol or used drugs before last sexual intercourse ranged from 18.1% to 33.7% across state surveys (median: 24.4%) and from 13.2% to 25.5% across local surveys (median: 18.4%) (Table 47). Pregnancy Nationwide, 4.2% of students had been pregnant or had gotten someone pregnant (Table 46). Overall, the prevalence of having been pregnant or having gotten someone pregnant was higher among female (4.9%) than male (3.5%) students; higher among white female (2.8%) than white male (1.7%) students; and higher among 11th grade female (5.3%) and 12th grade female (7.6%) than 11th grade male (3.2%) and 12th grade male (4.7%) students, respectively. Overall, the prevalence of having been pregnant or having gotten someone pregnant was higher among black (9.1%) and Hispanic (6.4%) than white (2.3%) students; higher among black (9.1%) than Hispanic (6.4%) students; higher among black female (10.4%) and Hispanic female (7.3%) than white female (2.8%) students; higher among black male (7.6%) and Hispanic male (5.2%) than white male (1.7%) students; and higher among black male (7.6%) than Hispanic male (5.2%) students. Overall, the prevalence of having been pregnant or having gotten someone pregnant was higher among 10th grade (4.3%), 11th grade (4.3%), and 12th grade (6.2%) than 9th grade (2.6%) students; higher among 10th grade female (5.0%), 11th grade female (5.3%), and 12th grade female (7.6%) than 9th grade female (2.3%) students; and higher among 12th grade female (7.6%) than 10th grade female (5.0%) students. Prevalence of having been pregnant or having gotten someone pregnant ranged from 2.3% to 7.7% across state surveys (median: 4.1%) and from 2.4% to 10.3% across local surveys (median: 7.7%) (Table 47). AIDS or HIV Infection Education Nationwide 87.9% of students had been taught in school about acquired immunodeficiency syndrome (AIDS) or HIV infection (Table 46). Overall, the prevalence of having been taught in school about AIDS or HIV infection was higher among white (90.3%) than black (85.1%) and Hispanic (83.4%) students; higher among white female (90.6%) than Hispanic female (83.9%) students; and higher among white male (90.1%) than black male (82.5%) and Hispanic male (82.8%) students. Overall, the prevalence of having been taught in school about AIDS or HIV infection was higher among 10th grade (89.2%), 11th grade (89.3%), and 12th grade (90.3%) than 9th grade (84.3%) students; higher among 10th grade female (90.5%) and 12th grade female (90.3%) than 9th grade female (85.4%) students; and higher among 10th grade male (88.0%), 11th grade male (88.9%), and 12th grade male (90.3%) than 9th grade male (83.2%) students. Prevalence of having been taught in school about AIDS or HIV infection ranged from 77.9% to 93.6% across state surveys (median: 88.4%) and from 78.8% to 92.7% across local surveys (median: 84.6%) (Table 47). Dietary BehaviorsConsumption of Fruits and Vegetables Approximately one fifth (22.0%) of students nationwide had eaten fruits and vegetables¶¶ >5 times/day during the 7 days preceding the survey (Table 48). Overall, the prevalence of having eaten fruits and vegetables >5 times/day was higher among male (23.6%) than female (20.3%) students; higher among black male (26.1%) than black female (20.3%) students; and higher among 9th grade male (25.3%) and 11th grade male (24.5%) than 9th grade female (21.2%) and 11th grade female (18.3%) students, respectively. Overall, the prevalence of having eaten fruits and vegetables >5 times/day was higher among Hispanic (24.4%) than white (20.5%) students and higher among black male (26.1%) and Hispanic male (27.4%) than white male (21.2%) students. Overall, the prevalence of having eaten fruits and vegetables >5 times/day was higher among 9th grade (23.3%) and 10th grade (23.0%) than 12th grade (19.5%) students. Prevalence of having eaten fruits and vegetables >5 times/day ranged from 13.2% to 28.4% across state surveys (median: 18.4%) and from 14.5% to 29.1% across local surveys (median: 18.8%) (Table 49). Consumption of Milk Nationwide, 17.1% of students had drunk >3 glasses/day of milk during the 7 days preceding the survey (Table 48). Overall, the prevalence of having drunk >3 glasses/day of milk was higher among male (22.7%) than female (11.2%) students; higher among white male (26.8%), black male (16.0%), and Hispanic male (17.0%) than white female (12.8%), black female (7.5%), and Hispanic female (9.0%) students, respectively; and higher among 9th grade male (25.1%), 10th grade male (23.8%), 11th grade male (22.6%), and 12th grade male (18.1%) than 9th grade female (13.5%), 10th grade female (11.8%), 11th grade female (9.8%), and 12th grade female (8.9%) students, respectively. Overall, the prevalence of having drunk >3 glasses/day of milk was higher among white (20.0%) than black (11.6%) and Hispanic (13.1%) students; higher among white female (12.8%) than black female (7.5%) students; and higher among white male (26.8%) than black male (16.0%) and Hispanic male (17.0%) students. Overall, the prevalence of having drunk >3 glasses/day of milk was higher among 9th grade (19.5%) than 12th grade (13.6%) students; higher among 9th grade female (13.5%) than 12th grade female (8.9%) students; and higher among 9th grade male (25.1%) than 12th grade male (18.1%) students. Prevalence of having drunk >3 glasses/day of milk ranged from 8.4% to 28.2% across state surveys (median: 16.7%) and from 5.7% to 11.9% across local surveys (median: 10.5%) (Table 49). Physical ActivitySufficient Vigorous Physical Activity Nationwide, 62.6% of students had exercised or participated in physical activities that made them sweat and breathe hard (e.g., basketball, soccer, running, swimming laps, fast bicycling, fast dancing, or similar aerobic activity) for >20 minutes on >3 of the 7 days preceding the survey (i.e., sufficient vigorous physical activity) (Table 50). Overall, the prevalence of having participated in sufficient vigorous physical activity was higher among male (70.0%) than female (55.0%) students; higher among white male (71.9%), black male (65.0%), and Hispanic male (66.7%) than white female (58.1%), black female (44.9%), and Hispanic female (51.8%) students, respectively; and higher among 9th grade male (73.1%), 10th grade male (71.5%), 11th grade male (70.4%), and 12th grade male (63.7%) than 9th grade female (63.6%), 10th grade female (58.2%), 11th grade female (49.4%), and 12th grade female (46.4%) students, respectively. Overall, the prevalence of having participated in sufficient vigorous physical activity was higher among white (65.2%) than black (54.8%) and Hispanic (59.3%) students; higher among white female (58.1%) and Hispanic female (51.8%) than black female (44.9%) students; higher among white female (58.1%) than Hispanic female (51.8%) students; and higher among white male (71.9%) than black male (65.0%) and Hispanic male (66.7%) students. Overall, the prevalence of having participated in sufficient vigorous physical activity was higher among 9th grade (68.5%) and 10th grade (64.9%) than 11th grade (60.1%) and 12th grade (55.0%) students; higher among 11th grade (60.1%) than 12th grade (55.0%) students; higher among 9th grade female (63.6%) and 10th grade female (58.2%) than 11th grade female (49.4%) and 12th grade female (46.4%) students; and higher among 9th grade male (73.1%), 10th grade male (71.5%), and 11th grade male (70.4%) than 12th grade male (63.7%) students. Prevalence of having participated in sufficient vigorous physical activity ranged from 53.3% to 71.1% across state surveys (median: 62.8%) and from 40.1% to 65.8% across local surveys (median: 54.0%) (Table 51). Sufficient Moderate Physical Activity One fourth (24.7%) of students nationwide had participated in physical activities that did not make them sweat or breathe hard (e.g., fast walking, slow bicycling, skating, pushing a lawn mower, or mopping floors) for >30 minutes on >5 of the 7 days preceding the survey (i.e., sufficient moderate physical activity) (Table 50). Overall, the prevalence of having participated in sufficient moderate physical activity was higher among male (27.2%) than female (22.1%) students; higher among white male (28.9%) and black male (25.8%) than white female (23.3%) and black female (17.5%) students, respectively; and higher among 9th grade male (28.3%), 11th grade male (28.1%), and 12th grade male (26.3%) than 9th grade female (22.3%), 11th grade female (20.0%), and 12th grade female (20.0%) students, respectively. Overall, the prevalence of having participated in sufficient moderate physical activity was higher among white (26.2%) than black (21.7%) and Hispanic (22.0%) students; higher among white female (23.3%) than black female (17.5%) students; and higher among white male (28.9%) than Hispanic male (23.3%) students. The prevalence of having participated in sufficient moderate physical activity was higher among 10th grade female (25.3%) than 11th grade female (20.0%) and 12th grade female (20.0%) students. Prevalence of having participated in sufficient moderate physical activity ranged from 18.0% to 29.5% across state surveys (median: 25.6%) and from 14.9% to 27.2% across local surveys (median: 21.0%) (Table 51). Insufficient Amount of Physical Activity Nationwide, 33.4% of students had not participated in sufficient vigorous physical activity and had not participated in sufficient moderate physical activity during the 7 days preceding the survey (i.e., insufficient amount of physical activity) (Table 52). Overall, the prevalence of having participated in an insufficient amount of physical activity was higher among female (40.1%) than male (26.9%) students; higher among white female (37.5%), black female (50.4%), and Hispanic female (42.6%) than white male (24.8%), black male (31.8%), and Hispanic male (30.3%) students, respectively; and higher among 9th grade female (32.7%), 10th grade female (35.9%), 11th grade female (46.2%), and 12th grade female (48.4%) than 9th grade male (23.8%), 10th grade male (25.6%), 11th grade male (27.0%), and 12th grade male (32.1%) students, respectively. Overall, the prevalence of having participated in an insufficient amount of physical activity was higher among black (41.2%) and Hispanic (36.5%) than white (31.0%) students; higher among black (41.2%) than Hispanic (36.5%) students; higher among black female (50.4%) than white female (37.5%) and Hispanic female (42.6%) students; and higher among black male (31.8%) and Hispanic male (30.3%) than white male (24.8%) students. Overall, the prevalence of having participated in an insufficient amount of physical activity was higher among 11th grade (36.5%) and 12th grade (40.2%) than 9th grade (28.1%) and 10th grade (30.8%) students; higher among 11th grade female (46.2%) and 12th grade female (48.4%) than 9th grade female (32.7%) and 10th grade female (35.9%) students; and higher among 12th grade male (32.1%) than 9th grade male (23.8%), 10th grade male (25.6%), and 11th grade male (27.0%) students. Prevalence of having participated in an insufficient amount of physical activity ranged from 24.8% to 41.9% across state surveys (median: 32.0%) and from 30.3% to 55.3% across local surveys (median: 41.5%) (Table 53). No Vigorous or Moderate Physical Activity Nationwide, 11.5% of students had not participated in either vigorous physical activity or moderate physical activity during the 7 days preceding the survey (Table 52). The prevalence of no vigorous or moderate physical activity was higher among black female (20.0%) and Hispanic female (15.4%) than black male (12.6%) and Hispanic male (10.6%) students, respectively, and higher among 11th grade female (16.7%) and 12th grade female (17.0%) than 11th grade male (10.8%) and 12th grade male (10.9%) students, respectively. Overall, the prevalence of no vigorous or moderate physical activity was higher among black (16.3%) than white (10.2%) and Hispanic (13.0%) students and higher among black female (20.0%) than white female (11.1%) and Hispanic female (15.4%) students. Overall, the prevalence of no vigorous or moderate physical activity was higher among 11th grade (13.7%) and 12th grade (14.0%) than 9th grade (9.1%) students; and higher among 11th grade female (16.7%) and 12th grade female (17.0%) than 9th grade female (9.7%) and 10th grade female (10.2%) students. Prevalence of no vigorous or moderate physical activity ranged from 5.3% to 15.3% across state surveys (median: 9.1%) and from 9.4% to 26.1% across local surveys (median: 14.0%) (Table 53). Enrolled in Physical Education Class Nationwide, 55.7% of students went to physical education (PE) classes on one or more days in an average week when they were in school (i.e., enrolled in PE class) (Table 54). The prevalence of having been enrolled in PE class was higher among black male (63.1%) than black female (49.3%) students. Overall, the prevalence of having been enrolled in PE class was higher among 9th grade (71.0%) and 10th grade (60.7%) than 11th grade (45.7%) and 12th grade (39.5%) students; higher among 9th grade female (71.2%) and 10th grade female (58.3%) than 11th grade female (40.8%) and 12th grade female (34.6%) students; and higher among 9th grade male (70.8%) and 10th grade male (63.0%) than 11th grade male (50.5%) and 12th grade male (44.5%) students. Prevalence of having been enrolled in PE class ranged from 27.3% to 93.7% across state surveys (median: 44.9%) and from 32.6% to 88.0% across local surveys (median: 48.1%) (Table 55). Attended PE Class Daily Nationwide, 28.4% of students went to PE classes 5 days in an average week when they were in school (i.e., daily PE class attendance) (Table 54). Overall, the prevalence of daily PE class attendance was higher among Hispanic (36.7%) than white (24.9%) students and higher among black male (37.1%) and Hispanic male (39.5%) than white male (26.8%) students. Overall, the prevalence of daily PE class attendance was higher among 9th grade (37.9%) and 10th grade (31.3%) than 12th grade (18.2%) students; higher among 9th grade (37.9%) than 11th grade (22.6%) students; higher among 9th grade female (38.0%) and 10th grade female (29.1%) than 12th grade female (15.2%) students; higher among 9th grade female (38.0%) than 11th grade female (19.2%) students; higher among 9th grade male (37.7%) and 10th grade male (33.5%) than 12th grade male (21.4%) students; and higher among 9th grade male (37.7%) than 11th grade male (26.0%) students. Prevalence of daily PE class attendance ranged from 8.2% to 37.2% across state surveys (median: 27.5%) and from 9.2% to 51.0% across local surveys (median: 24.5%) (Table 55, Figure 7). Exercised or Played Sports >20 Minutes During PE Class Among the 55.7% of students nationwide enrolled in PE class, 80.3% actually exercised or played sports >20 minutes during an average PE class (Table 54). Overall, the prevalence of having exercised or played sports >20 minutes during an average PE class was higher among male (84.5%) than female (75.3%) students; higher among white male (85.8%), black male (80.0%), and Hispanic male (82.5%) than white female (76.6%), black female (66.7%), and Hispanic female (73.5%) students, respectively; and higher among 9th grade male (84.8%), 10th grade male (83.2%), 11th grade male (83.7%), and 12th grade male (87.2%) than 9th grade female (75.7%), 10th grade female (77.0%), 11th grade female (71.6%), and 12th grade female (74.9%) students, respectively. Overall, the prevalence of having exercised or played sports >20 minutes during an average PE class was higher among white (81.5%) than black (74.0%) students; higher among white female (76.6%) than black female (66.7%) students; and higher among white male (85.8%) than black male (80.0%) students. Prevalence of having exercised or played sports >20 minutes during an average PE class ranged from 76.2% to 91.1% across state surveys (median: 84.5%) and from 55.7% to 82.0% across local surveys (median: 72.4%) (Table 55). Participated in Strengthening Exercises Nationwide, 51.9% of students had done exercises to strengthen or tone their muscles (e.g., push-ups, sit-ups, or weightlifting) on >3 of the 7 days preceding the survey (Table 56). Overall, the prevalence of having done strengthening exercises was higher among male (60.1%) than female (43.4%) students; higher among white male (60.6%), black male (59.6%), and Hispanic male (59.4%) than white female (46.1%), black female (31.3%), and Hispanic female (43.6%) students, respectively; and higher among 9th grade male (63.1%), 10th grade male (60.1%), 11th grade male (62.3%), and 12th grade male (54.6%) than 9th grade female (47.9%), 10th grade female (49.2%), 11th grade female (39.8%), and 12th grade female (34.4%) students, respectively. Overall, the prevalence of having done strengthening exercises was higher among white (53.6%) and Hispanic (51.5%) than black (45.4%) students and higher among white female (46.1%) and Hispanic female (43.6%) than black female (31.3%) students. Overall, the prevalence of having done strengthening exercises was higher among 9th grade (55.8%), 10th grade (54.7%), and 11th grade (51.2%) than 12th grade (44.6%) students; higher among 9th grade female (47.9%) and 10th grade female (49.2%) than 11th grade female (39.8%) and 12th grade female (34.4%) students; and higher among 9th grade male (63.1%) and 11th grade male (62.3%) than 12th grade male (54.6%) students. The prevalence of having done strengthening exercises ranged from 42.6% to 58.4% across state surveys (median: 51.0%) and from 37.2% to 56.8% across local surveys (median: 44.9%) (Table 57). Played on Sports Teams Nationwide, 57.6% of students had played on one or more sports teams (run by their school or community groups) during the 12 months preceding the survey (Table 56). Overall, the prevalence of having played on one or more sports teams was higher among male (64.0%) than female (51.0%) students; higher among white male (65.4%), black male (67.5%), and Hispanic male (56.2%) than white female (55.9%), black female (39.6%), and Hispanic female (42.8%) students, respectively; and higher among 9th grade male (65.0%), 10th grade male (62.0%), 11th grade male (66.3%), and 12th grade male (62.3%) than 9th grade female (55.2%), 10th grade female (53.9%), 11th grade female (47.8%), and 12th grade female (45.9%) students, respectively. Overall, the prevalence of having played on one or more sports teams was higher among white (60.8%) than black (53.2%) and Hispanic (49.5%) students; higher among white female (55.9%) than black female (39.6%) and Hispanic female (42.8%) students; and higher among white male (65.4%) and black male (67.5%) than Hispanic male (56.2%) students. Overall, the prevalence of having played on one or more sports teams was higher among 9th grade (60.3%) than 12th grade (54.0%) students; and higher among 9th grade female (55.2%) and 10th grade female (53.9%) than 11th grade female (47.8%) and 12th grade female (45.9%) students. Prevalence of having played on one or more sports teams ranged from 50.7% to 64.9% across state surveys (median: 56.3%) and from 44.1% to 55.8% across local surveys (median: 47.9%) (Table 57). Watched Television Nationwide, 38.2% of students had watched television >3 hours/day on an average school day (Table 56). The prevalence of having watched television >3 hours/day was higher among white male (31.7%) than white female (26.8%) students. Overall, the prevalence of having watched television >3 hours/day was higher among black (67.2%) and Hispanic (45.9%) than white (29.3%) students; higher among black (67.2%) than Hispanic (45.9%) students; higher among black female (70.0%) and Hispanic female (45.1%) than white female (26.8%) students; higher among black female (70.0%) than Hispanic female (45.1%) students; higher among black male (64.3%) and Hispanic male (46.8%) than white male (31.7%) students; and higher among black male (64.3%) than Hispanic male (46.8%) students. Overall, the prevalence of having watched television >3 hours/day was higher among 9th grade (44.0%) and 10th grade (41.0%) than 11th grade (34.4%) and 12th grade (30.6%) students; higher among 9th grade female (41.2%) and 10th grade female (39.0%) than 12th grade female (31.3%) students; higher among 9th grade female (41.2%) than 11th grade female (34.7%) students; and higher among 9th grade male (46.5%) and 10th grade male (42.9%) than 11th grade male (34.1%) and 12th grade male (29.9%) students. Prevalence of having watched television >3 hours/day ranged from 21.3% to 54.1% across state surveys (median: 32.2%) and from 41.8% to 65.5% across local surveys (median: 53.7%) (Table 57). Overweight And Weight ControlAt Risk for Overweight Nationwide, 15.4% of students were at risk for becoming overweight (Table 58). The prevalence of being at risk for overweight was higher among black female (21.2%) than black male (15.5%) students. Overall, the prevalence of being at risk for overweight was higher among black (18.3%) and Hispanic (17.3%) than white (14.1%) students; higher among black female (21.2%) than white female (13.8%) and Hispanic female (15.7%) students; and higher among Hispanic male (19.0%) than white male (14.3%) students. Prevalence of being at risk for overweight ranged from 11.0% to 16.7% across state surveys (median: 14.5%) and from 14.2% to 20.6% across local surveys (17.4%) (Table 59). Overweight Nationwide, 13.5% of students were overweight (Table 58). Overall, the prevalence of being overweight was higher among male (17.4%) than female (9.4%) students; higher among white male (16.2%) and Hispanic male (21.7%) than white female (7.8%) and Hispanic female (11.8%) students, respectively; and higher among 9th grade male (19.0%), 10th grade male (17.9%), 11th grade male (17.0%), and 12th grade male (14.7%) than 9th grade female (11.2%), 10th grade female (9.3%), 11th grade female (8.6%), and 12th grade female (8.0%) students, respectively. Overall, the prevalence of being overweight was higher among black (17.6%) than white (12.2%) students and higher among black female (15.6%) than white female (7.8%) students. Prevalence of being overweight ranged from 7.0% to 15.7% across state surveys (median: 11.1%) and from 9.3% to 19.9% across local surveys (median: 13.8%) (Table 59, Figure 8). Described Themselves as Overweight Nationwide, 29.6% of students described themselves as slightly or very overweight (Table 60). Overall, the prevalence of describing themselves as overweight was higher among female (36.1%) than male (23.5%) students; higher among white female (38.5%), black female (26.4%), and Hispanic female (36.1%) than white male (23.5%), black male (17.9%), and Hispanic male (27.1%) students, respectively; and higher among 9th grade female (33.1%), 10th grade female (36.1%), 11th grade female (36.9%), and 12th grade female (38.7%) than 9th grade male (22.6%), 10th grade male (23.2%), 11th grade male (24.3%), and 12th grade male (24.1%) students, respectively. Overall, the prevalence of describing themselves as overweight was higher among white (30.8%) and Hispanic (31.6%) than black (22.3%) students; higher among white female (38.5%) and Hispanic female (36.1%) than black female (26.4%) students; and higher among white male (23.5%) and Hispanic male (27.1%) than black male (17.9%) students. Overall, the prevalence of describing themselves as overweight was higher among 12th grade (31.4%) than 9th grade (27.7%) students; and higher among 12th grade female (38.7%) than 9th grade female (33.1%) students. Prevalence of describing themselves as overweight ranged from 26.5% to 34.9% across state surveys (median: 31.0%) and from 21.0% to 36.1% across local surveys (27.4%) (Table 61). Trying To Lose Weight Nationwide, 43.8% of students were trying to lose weight (Table 60). Overall, the prevalence of trying to lose weight was higher among female (59.3%) than male (29.1%) students; higher among white female (62.6%), black female (46.7%), and Hispanic female (61.7%) than white male (27.9%), black male (22.7%), and Hispanic male (37.4%) students, respectively; and higher among 9th grade female (54.1%), 10th grade female (62.2%), 11th grade female (60.4%), and 12th grade female (61.7%) than 9th grade male (31.2%), 10th grade male (28.3%), 11th grade male (28.3%), and 12th grade male (28.0%) students, respectively. Overall, the prevalence of trying to lose weight was higher among white (44.8%) and Hispanic (49.4%) than black (34.7%) students; higher among white female (62.6%) and Hispanic female (61.7%) than black female (46.7%) students; higher among white male (27.9%) and Hispanic male (37.4%) than black male (22.7%) students; and higher among Hispanic male (37.4%) than white male (27.9%) students. The prevalence of trying to lose weight was higher among 10th grade female (62.2%) and 12th grade female (61.7%) than 9th grade female (54.1%) students. Prevalence of trying to lose weight ranged from 41.6% to 51.0% across state surveys (median: 44.7%) and from 30.5% to 53.0% across local surveys (median: 43.0%) (Table 61). Ate Less Food To Lose Weight or To Keep From Gaining Weight During the 30 days preceding the survey, 42.2% of students nationwide had eaten less food, fewer calories, or foods low in fat to lose weight or to keep from gaining weight (Table 62). Overall, the prevalence of having eaten less food, fewer calories, or foods low in fat to lose weight or to keep from gaining weight was higher among female (56.2%) than male (28.9%) students; higher among white female (61.1%), black female (39.0%), and Hispanic female (54.9%) than white male (29.1%), black male (21.8%), and Hispanic male (33.7%) students, respectively; and higher among 9th grade female (53.0%), 10th grade female (58.1%), 11th grade female (56.4%), and 12th grade female (57.9%) than 9th grade male (28.8%), 10th grade male (27.8%), 11th grade male (29.4%), and 12th grade male (29.8%) students, respectively. Overall, the prevalence of having eaten less food, fewer calories, or foods low in fat to lose weight or to keep from gaining weight was higher among white (44.6%) and Hispanic (44.2%) than black (30.5%) students; higher among white female (61.1%) and Hispanic female (54.9%) than black female (39.0%) students; higher among white female (61.1%) than Hispanic female (54.9%) students; and higher among white male (29.1%) and Hispanic male (33.7%) than black male (21.8%) students. Overall, the prevalence of having eaten less food, fewer calories, or foods low in fat to lose weight or to keep from gaining weight was higher among 12th grade (43.7%) than 9th grade (40.4%) students and higher among 12th grade female (57.9%) than 9th grade female (53.0%) students. Prevalence of having eaten less food, fewer calories, or foods low in fat to lose weight or to keep from gaining weight ranged from 37.6% to 46.9% across state surveys (median: 41.1%) and from 27.3% to 41.1% across local surveys (median: 37.2%) (Table 63). Exercised To Lose Weight or To Keep From Gaining Weight Nationwide, 57.1% of students had exercised to lose weight or to keep from gaining weight during the 30 days preceding the survey (Table 62). Overall, the prevalence of having exercised to lose weight or to keep from gaining weight was higher among female (65.7%) than male (49.0%) students; higher among white female (69.6%) and Hispanic female (64.1%) than white male (48.1%) and Hispanic male (53.7%) students, respectively; and higher among 9th grade female (65.7%), 10th grade female (68.9%), 11th grade female (64.5%), and 12th grade female (63.2%) than 9th grade male (50.2%), 10th grade male (49.8%), 11th grade male (49.4%), and 12th grade male (46.4%) students, respectively. Overall, the prevalence of having exercised to lose weight or to keep from gaining weight was higher among white (58.5%) and Hispanic (58.9%) than black (47.5%) students; higher among white female (69.6%) and Hispanic female (64.1%) than black female (49.2%) students; and higher among Hispanic male (53.7%) than black male (46.1%) students. Prevalence of having exercised to lose weight or to keep from gaining weight ranged from 53.2% to 63.8% across state surveys (median: 59.5%) and from 38.7% to 64.1% across local surveys (median: 56.5%) (Table 63). Went Without Eating for >24 Hours To Lose Weight or To Keep From Gaining Weight Nationwide, 13.3% of students had gone without eating for >24 hours to lose weight or to keep from gaining weight during the 30 days preceding the survey (Table 64). Overall, the prevalence of having gone without eating for >24 hours to lose weight or to keep from gaining weight was higher among female (18.3%) than male (8.5%) students; higher among white female (18.4%), black female (14.5%), and Hispanic female (18.2%) than white male (7.1%), black male (10.5%), and Hispanic male (9.2%) students, respectively; and higher among 9th grade female (18.8%), 10th grade female (18.5%), 11th grade female (19.6%), and 12th grade female (15.7%) than 9th grade male (10.7%), 10th grade male (7.0%), 11th grade male (8.2%), and 12th grade male (6.9%) students, respectively. The prevalence of having gone without eating for >24 hours to lose weight or to keep from gaining weight was higher among white female (18.4%) and Hispanic female (18.2%) than black female (14.5%) students and higher among black male (10.5%) than white male (7.1%) students. Overall, the prevalence of having gone without eating for >24 hours to lose weight or to keep from gaining weight was higher among 9th grade (14.6%) than 12th grade (11.2%) students; higher among 11th grade female (19.6%) than 12th grade female (15.7%) students; and higher among 9th grade male (10.7%) than 10th grade male (7.0%) and 12th grade male (6.9%) students. Prevalence of having gone without eating for >24 hours to lose weight or to keep from gaining weight ranged from 9.1% to 17.3% across state surveys (median: 12.3%) and from 9.8% to 14.7% across local surveys (median: 11.9%) (Table 65). Took Diet Pills, Powders, or Liquids To Lose Weight or To Keep From Gaining Weight Nationwide, 9.2 % of students had taken diet pills, powders, or liquids without a doctor's advice to lose weight or to keep from gaining weight during the 30 days preceding the survey (Table 64). Overall, the prevalence of having taken diet pills, powders, or liquids without a doctor's advice to lose weight or to keep from gaining weight was higher among female (11.3%) than male (7.1%) students; higher among white female (13.0%) than white male (6.8%) students; and higher among 10th grade female (10.9%), 11th grade female (12.6%), and 12th grade female (13.0%) than 10th grade male (5.8%), 11th grade male (7.7%), and 12th grade male (8.5%) students, respectively. Overall, the prevalence of having taken diet pills, powders, or liquids without a doctor's advice to lose weight or to keep from gaining weight was higher among white (9.8%) and Hispanic (10.5%) than black (5.0%) students and higher among white female (13.0%) and Hispanic female (11.7%) than black female (5.1%) students. Prevalence of having taken diet pills, powders, or liquids without a doctor's advice to lose weight or to keep from gaining weight ranged from 5.3% to 11.8% across state surveys (median: 7.7%) and from 4.5% to 9.0% across local surveys (median: 6.8%) (Table 65). Vomited or Took Laxatives To Lose Weight or To Keep From Gaining Weight Nationwide, 6.0% of students had vomited or taken laxatives to lose weight or to keep from gaining weight during the 30 days preceding the survey (Table 64). Overall, the prevalence of having vomited or taken laxatives to lose weight or to keep from gaining weight was higher among female (8.4%) than male (3.7%) students; higher among white female (8.5%) than white male (2.7%) students; and higher among 10th grade female (9.3%), 11th grade female (8.8%), and 12th grade female (7.3%) than 10th grade male (3.5%), 11th grade male (2.6%), and 12th grade male (3.8%) students, respectively. The prevalence of having vomited or taken laxatives to lose weight or to keep from gaining weight was higher among white female (8.5%) and Hispanic female (9.7%) than black female (5.6%) students. Prevalence of having vomited or taken laxatives to lose weight or to keep from gaining weight ranged from 3.1% to 7.5% across state surveys (median: 5.3%) and from 4.0% to 7.5% across local surveys (median: 5.1%) (Table 65). Trends During 1991--2003During 1991--2003, significant decreases occurred in the percentage of students who had never or who had rarely worn seat belts (25.9%--18.2%), rode with a driver who had been drinking alcohol (39.9%--30.2%), drove after drinking alcohol (16.7%--12.1%), had been in a physical fight (42.5%--33.0%), and made a plan to attempt suicide (18.6%--16.5%). The percentage of students who carried a weapon decreased significantly from 1991--1997 (26.1%--18.3%) and then remained constant from 1997--2003 (18.3%--17.1%). The percentage of students who ever tried cigarette smoking remained constant from 1991--1999 (70.1%--70.4%) and then decreased significantly from 1999--2003 (70.4%--58.4%). The percentage of students who reported current cigarette use increased significantly from 1991--1997 (27.5%--36.4%) and then decreased significantly from 1997--2003 (36.4%--21.9%). During 1995--2003, current smokeless tobacco use decreased significantly (11.4%--6.7%), and during 1997--2003 current cigar use also decreased significantly (22.0%--14.8%). The percentage of students who reported lifetime alcohol use decreased significantly from 1991--2003 (81.6%--74.9%). The percentage of students who reported lifetime and current marijuana use increased significantly from 1991--1997 (31.3%--47.1% and 14.7%--26.2%, respectively) and then decreased significantly from 1997--2003 (47.1%--40.2% and 26.2%--22.4%, respectively). The percentage of students who reported lifetime and current cocaine use increased significantly from 1991--1999 (5.9%--9.5% and 1.7%--4.0%, respectively) and then leveled off from 1999--2003 (9.5%--8.7% and 4.0%--4.1%, respectively). During 1991--2003, the percentage of students who had had sexual intercourse and had >4 sex partners decreased significantly (54.1%--46.7% and 18.7%--14.4%, respectively). During 1991--2003, the percentage of currently sexually active students who used a condom during last sexual intercourse increased significantly (46.2%--63.0%). During 1991--2003, the percentage of currently sexually active students who had drunk alcohol or used drugs before last sexual intercourse also increased significantly (21.6%--25.4%). Although the percentage of students enrolled in PE class remained constant from 1991--2003 (48.9%--55.7%), the percentage of students with daily PE class attendance decreased significantly from 1991--1995 (41.6%--25.4%) and then increased significantly from 1995--2003 (25.4%--28.4%). DiscussionSince 1991, selected risk behaviors associated with unintentional injuries and violence; tobacco, alcohol, and marijuana use; and HIV infection, other STDs, and unintended pregnancy have decreased among high school students nationwide. However, risk for chronic health problems might have increased. Even with improvements in certain behaviors over time, too many high school students continue to engage in health risk behaviors. For example, during the 30 days preceding the survey, 2.6 million high school students rarely or never wore seat belts, 2.4 million carried a weapon, 3.1 million smoked cigarettes, 6.4 million drank alcohol, and 3.2 million used marijuana. During the 12 months preceding the survey 4.7 million high school students were in a physical fight. In addition, 6.6 million high school student had ever had sexual intercourse, and 1.9 million were overweight. Certain risk behaviors are more likely to occur among particular subpopulations of students defined by sex, race/ethnicity, and grade. However, this analysis could not isolate the effects of sex, race/ethnicity, or grade from those measures of socioeconomic status (SES) or culture on risk behaviors with substantial disparities. In a 1992 national study, after controlling for age, sex, race/ethnicity, and school enrollment status (in or out of school), adolescents aged 12--17 years were less likely to report selected risk behaviors (e.g., smoking, physical inactivity, eating too little fruit and vegetables, and episodic heavy drinking) as the SES (education or family income) of the responsible adult increased (11). Additional research is needed to assess the effect of specific educational, socioeconomic, cultural, and racial/ethnic factors on the prevalence of health-risk behaviors among high school students. For the majority of risk behaviors, limited variability in their prevalence occurs from state to state and from city to city. However, across state surveys, a range of >25 percentage points was identified for the following risk behaviors:
Across local surveys, a range of >25 percentage points was identified for the following risk behaviors:
These variations might occur, in part, because of differences in state and local laws and policies, enforcement practices, access to illegal drugs, availability of effective interventions, prevailing behavioral norms, demographic characteristics of the population, and adult practices. Longitudinal research is needed to better understand the effect of these factors on the prevalence of risk behaviors. Healthy People 2010The national YRBS is the primary source of data to measure 15 Healthy People 2010 objectives and three leading health indicators (12). The Healthy People 2010 objectives provide a comprehensive agenda for improving the health of all persons in the United States during the first decade of the 21st century. This report provides the 2010 target and data from the 2003 national YRBS for 14 of the 15 objectives (Table 66). LimitationsThe findings in this report are subject to multiple limitations. First, these data apply only to youth who attend school and, therefore, are not representative of all persons in this age group. Nationwide, of persons aged 16--17 years, approximately 5% were not enrolled in a high school program and had not completed high school (13). Second, the extent of underreporting or overreporting of behaviors cannot be determined, although survey questions demonstrate good test-retest reliability (14). Third, BMI is calculated on the basis of self-reported height and weight and, therefore, tends to underestimate the prevalence of overweight and at risk for overweight (15). ConclusionUses of YRBS DataThe national YRBS data are used routinely by CDC and other federal agencies. As examples, CDC uses YRBS data to
State and local agencies and nongovernmental organizations use YRBS data to set health education and health promotion goals, support curricula or program modifications, support legislation that promotes health, and seek funding for new initiatives. For example, the Dallas Independent School District used YRBS data to develop the District's strategic plan, Vision 2003, which identifies student well-being as one of seven critical areas for improvement. The Montana Healthy Schools Network used YRBS data to support a legislative proposal for improved nutrition and physical activity in schools, and to support a change in state accreditation standards to ensure that elementary teachers have undergraduate coursework in health education content. The Nevada Governor's Youth Advisory Council used YRBS data to help set youth health-related priorities. On the basis of YRBS data and other data sources, the Kentucky Board of Education endorsed a Comprehensive School Health Vision Statement in December 2002. In February 2004, the Board followed up with a physical activity resolution encouraging schools to integrate physical activity throughout the school day. Also, the majority of states and local agencies post their YRBS data on their websites to ensure use of their data by community agencies. Continued support for YRBSS will help monitor and ensure the effectiveness of these and other public health and school health programs for youth. * In this report, black students refers to black or African-American, non-Hispanic students. † In this report, Hispanic students refers to Hispanic or Latino students of any race. § In this report, white students refers to white, non-Hispanic students. ¶ A questionnaire that fails quality control has <20 remaining responses after editing or has the same answer to >15 questions in a row. ** Pellet-sized pieces of highly purified cocaine. †† A process whereby cocaine is dissolved in ether or sodium hydroxide and the precipitate filtered off. §§ Students were classified as injection-drug users only if they 1) reported injecting-drug use and 2) answered "one or more times" to any of the following questions: "During your life, how many times have you used any form of cocaine including powder, crack, or freebase?"; "During your life, how many times have you used heroin (also called smack, junk, or China white)?"; "During your life, how many times have you used methamphetamines (also called speed, crystal, crank, or ice)?"; or "During your life, how many times have you taken steroid pills or shots without a doctor's prescription?" ¶¶ Consumption of fruits and vegetables includes 100% fruit juice, fruit, green salad, potatoes (excluding French fries, fried potatoes, or potato chips), carrots, or other vegetables. References
2003 State and Local Youth Risk Behavior Coordinators Alabama, Martha Holloway, M.S., Department of Education; Alaska, Tammy Green, M.P.H., Department of Health and Human Services; Arizona, Denise Muller, M.P.H., Department of Education; Boston, Massachusetts, Nancy M. Strunk, M.S., Boston Public Schools; Chicago, Illinois, Margaret Finnegan, M.A., Chicago Public Schools; Dallas, Texas, Phyllis E. Simpson, Ph.D., Dallas Independent School District; DeKalb, Georgia, Mary E. Patrick, M.P.H., Board of Health; Delaware, Janet Arns Ray, M.S., Department of Education; Detroit, Michigan, Anntinette McCain, Detroit Public Schools; District of Columbia, Linda Wright, M.A., District of Columbia Public Schools; Florida, Faye Johnson, Department of Education, Fort Lauderdale, Florida, Mike Weissberg, M.S., School Board of Broward County; Georgia, Dafna Kanny, Ph.D., Department of Public Health; Idaho, Barbara S. Eisenbarth, M.Ed., Department of Education; Indiana, Katherine Newland, Department of Education; Kentucky, Barbara Donica, M.A., Department of Education; Los Angeles, California, Ric Loya, M.S., Los Angeles Unified School District; Maine, Joni Foster, Department of Education; Massachusetts, Belinda J. Hanlon, M.P.H., Department of Education; Memphis, Tennessee, Deborah L. Slawson, Ph.D., Memphis Public Schools; Miami, Florida, Rodolfo Abella, Ph.D., Miami-Dade County Public Schools; Michigan, Kim Kovalchick, M.P.H., M.S.W., Department of Education; Milwaukee, Wisconsin, Bob Helminiak, M.S., Milwaukee Public Schools; Mississippi, Patricia Clemen, M.T.S., Department of Health; Missouri, Kevin Miller, M.A., Department of Elementary and Secondary Education; Montana, Susan Court, Office of Public Instruction; Nebraska, Jeff Armitage, Department of Education; Nevada, Robinette Bacon, Department of Education; New Hampshire, Mary D. Bubnis, M.Ed., Department of Education; New Orleans, Louisiana, Stephanie Turlich, New Orleans Public Schools; New York, Patricia Kocialski, M.S.E., Department of Education; New York City, New York, Lorna Thorpe, Ph.D., New York City Department of Health; North Carolina, Brad McMillan, Ph.D., Department of Public Instruction; North Dakota, Nicole L. Wright, M.S., Department of Public Instruction; Ohio, Angela Norton, M.A., Department of Health; Oklahoma, J. Sunshine Cowan, M.P.H., Department of Health; Orange County, Florida, Kathy Bowman-Harrow, M.S., Orange County Public Schools; Palm Beach, Florida, Dannette Fitzgerald, School District of Palm Beach County; Philadelphia, Pennsylvania, Bettyann Creighton, M.Ed., School District of Philadelphia; Rhode Island, Donald K. Perry, M.P.A., Department of Health; San Bernardino, California, Angela Jones, M.S., San Bernardino Unified School District; San Diego, California, Margaret L. Kleinsmith, M.S., M.F.T., San Diego Unified School District; South Dakota, April Sitzler, Department of Education; Tennessee, Jerry Swaim, M.S., Department of Education; Texas, Phil Huang, M.D., M.P.H., Department of Health; Utah, Verne Larsen, Department of Health; Vermont, Kelly Hale LaMonda, M.A., Department of Education; West Virginia, James Dean Lee, Department of Education; Wisconsin, Brian Weaver, Department of Public Instruction; Wyoming, Sunny Kaste, Department of Education. Table 1  Return to top. Figure 1 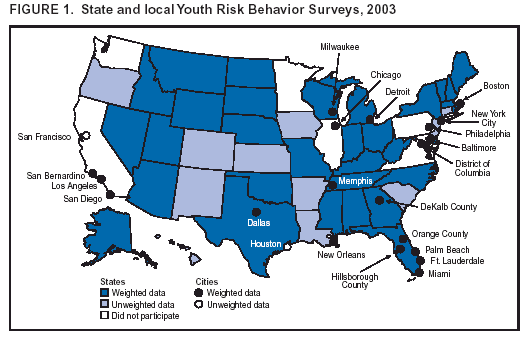 Return to top. Table 2 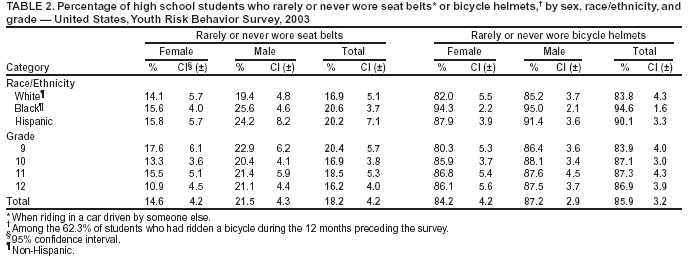 Return to top. Figure 2  Return to top. Table 3 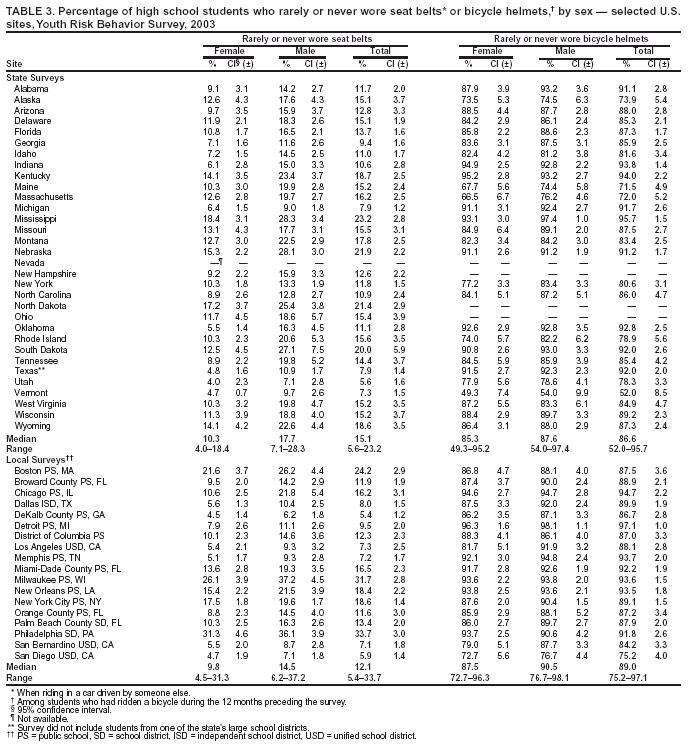 Return to top. Figure 3 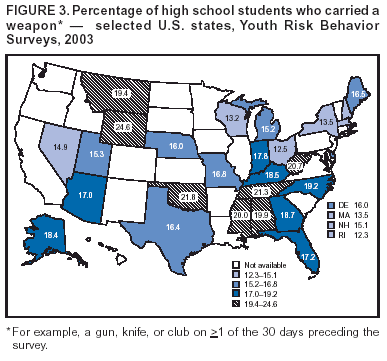 Return to top. Table 4  Return to top. Figure 4 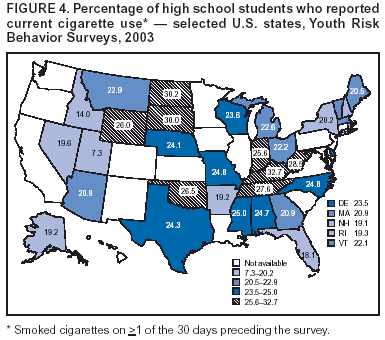 Return to top. Table 5  Return to top. Figure 5 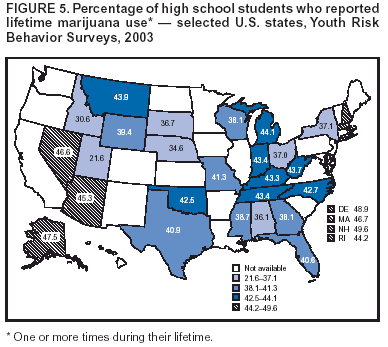 Return to top. Table 6 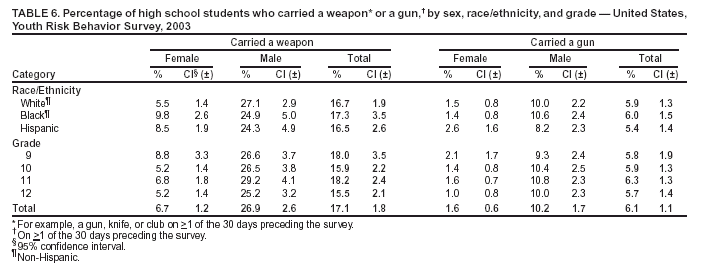 Return to top. Figure 6  Return to top. Table 7 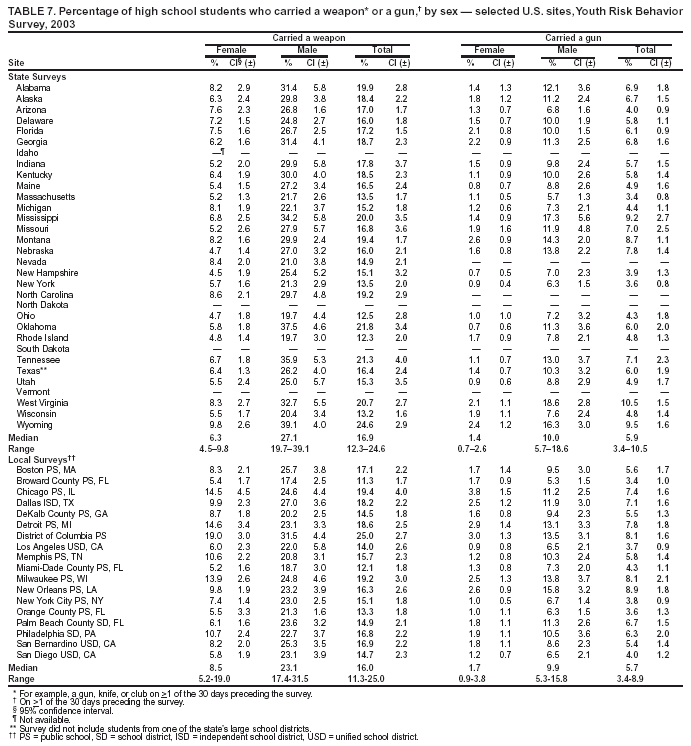 Return to top. Figure 7 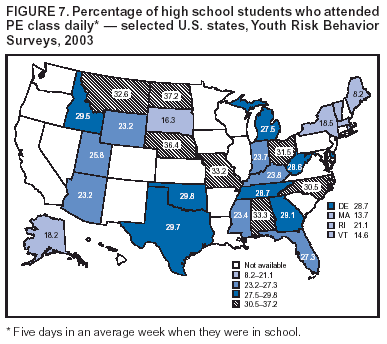 Return to top. Table 8  Return to top. Figure 8  Return to top. Table 9 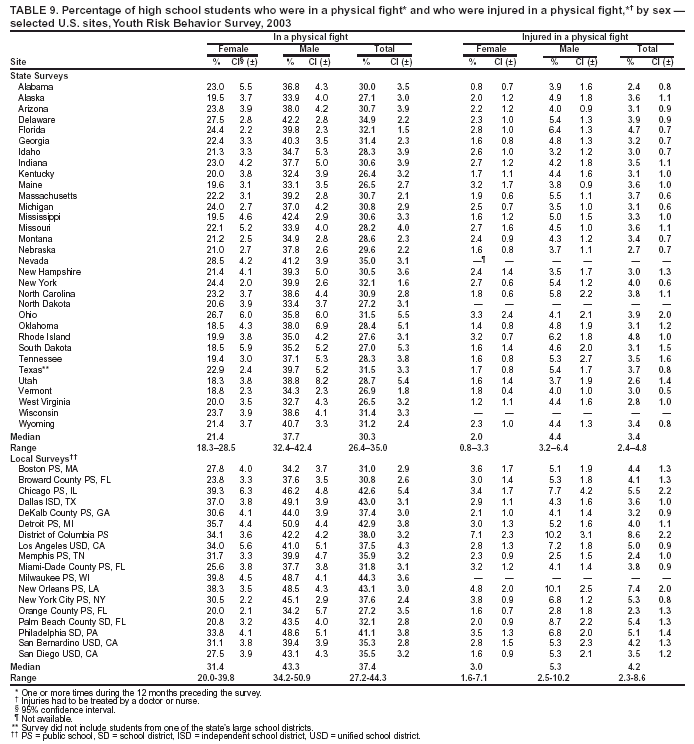 Return to top. Table 10 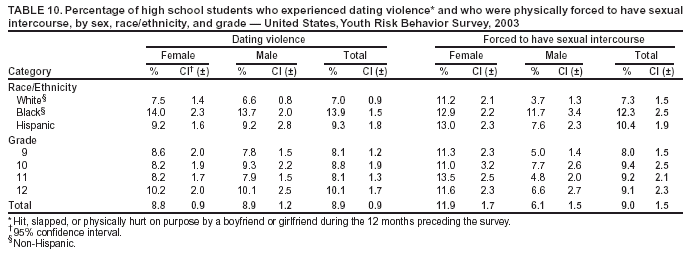 Return to top. Table 11 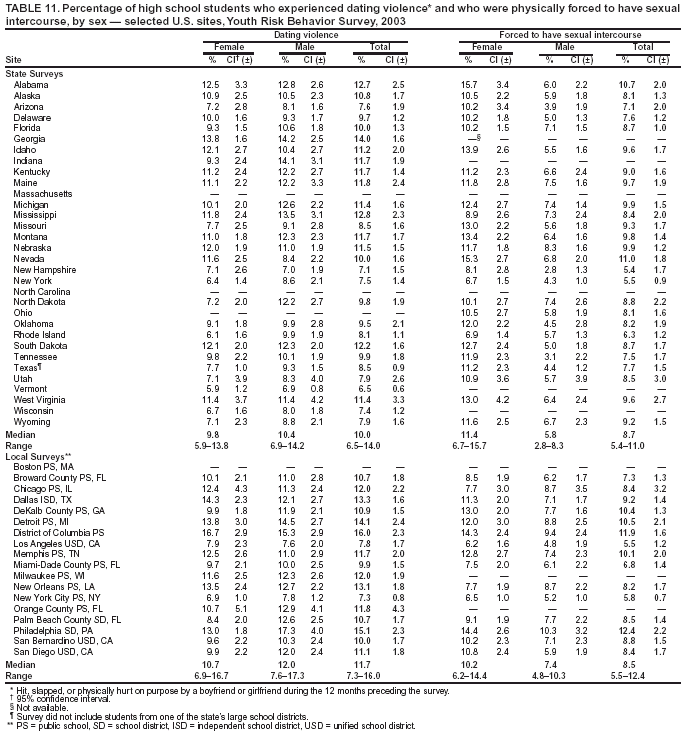 Return to top. Table 12 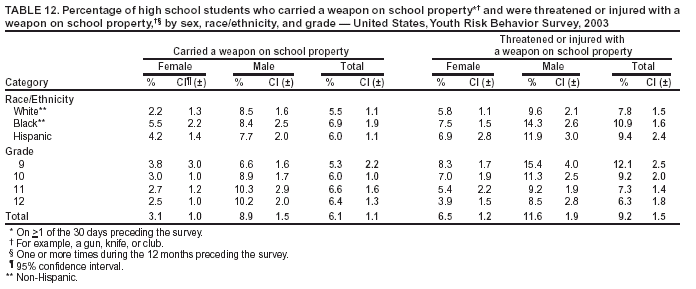 Return to top. Table 13  Return to top. Table 14  Return to top. Table 15 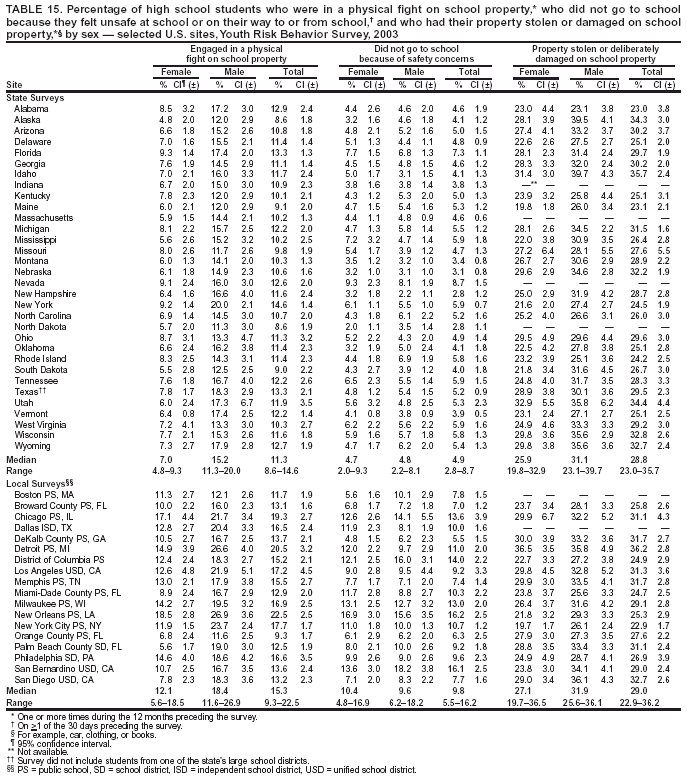 Return to top. Table 16  Return to top. Table 17 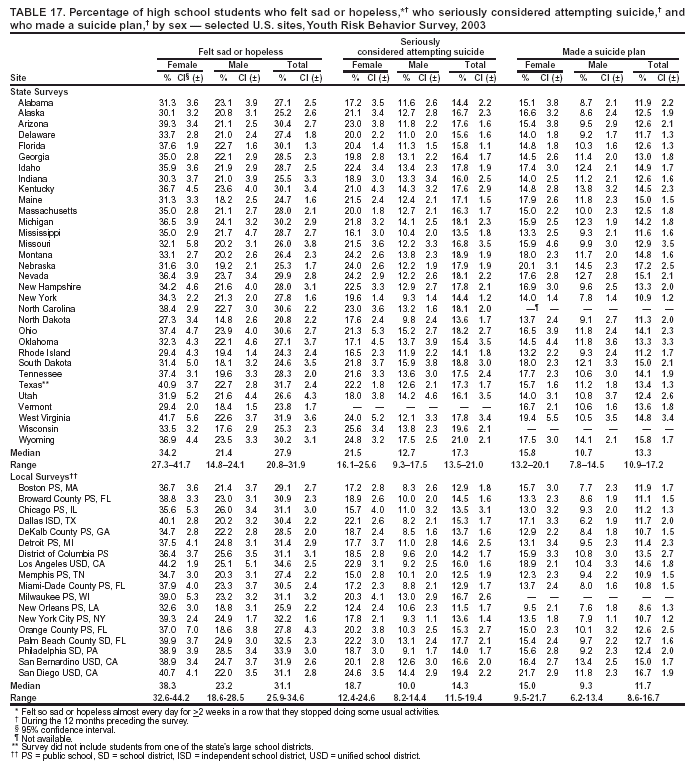 Return to top. Table 18  Return to top. Table 19 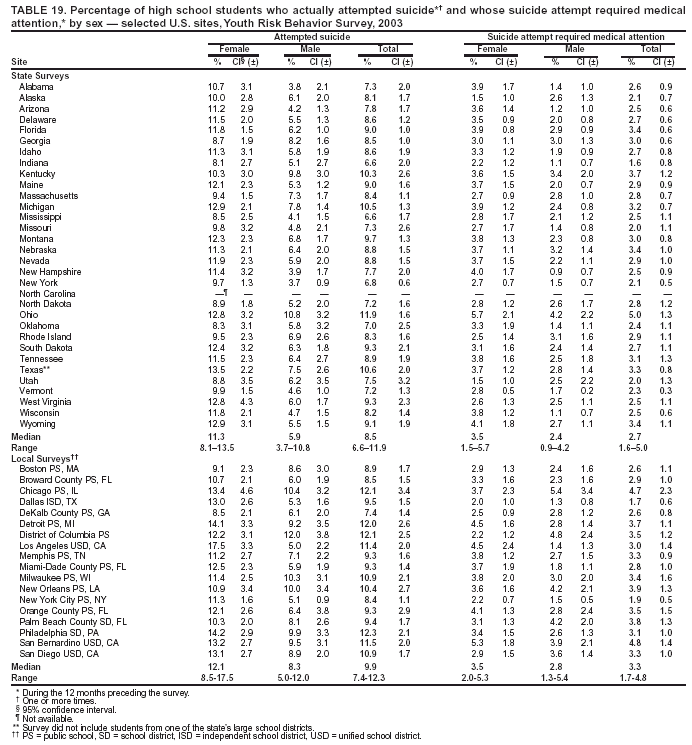 Return to top. Table 20 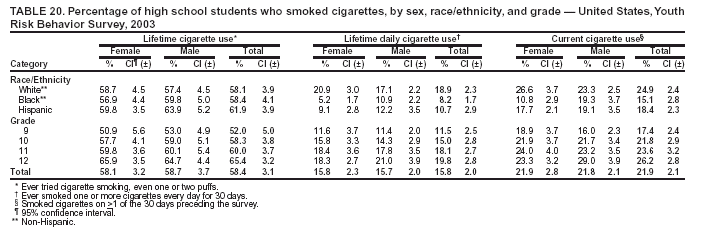 Return to top. Table 21 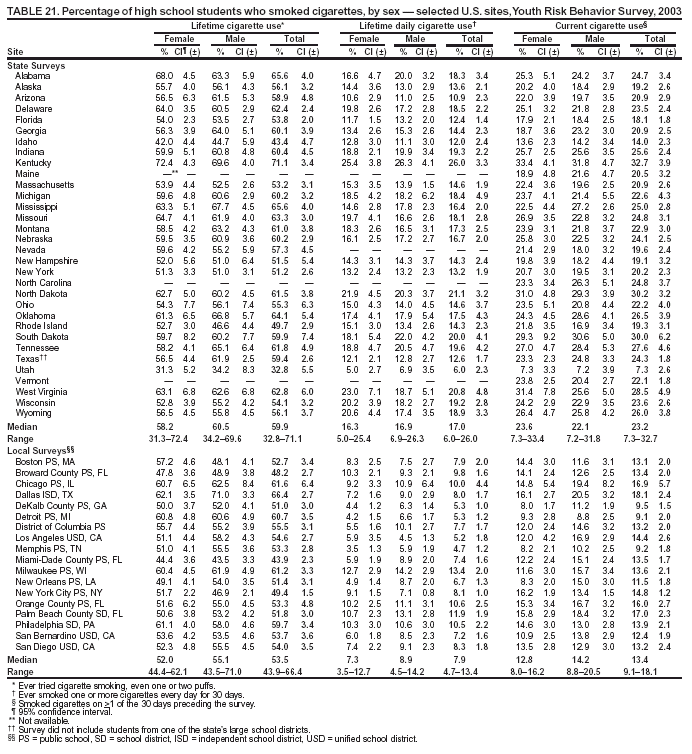 Return to top. Table 22  Return to top. Table 23  Return to top. Table 24  Return to top. Table 25  Return to top. Table 26  Return to top. Table 27 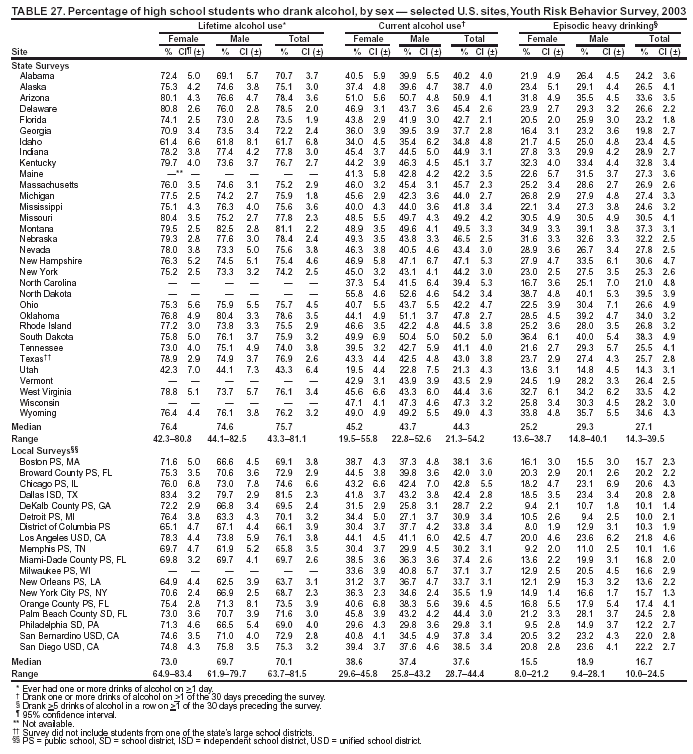 Return to top. Table 28 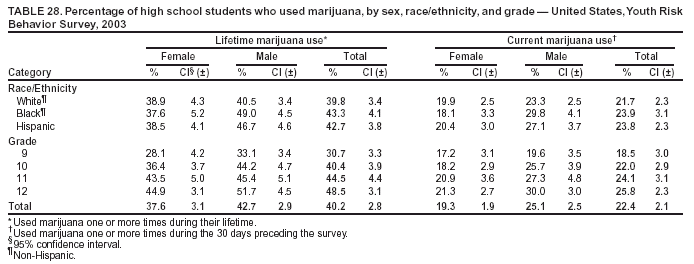 Return to top. Table 29  Return to top. Table 30 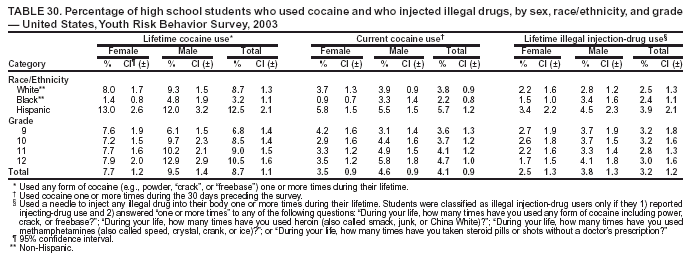 Return to top. Table 31 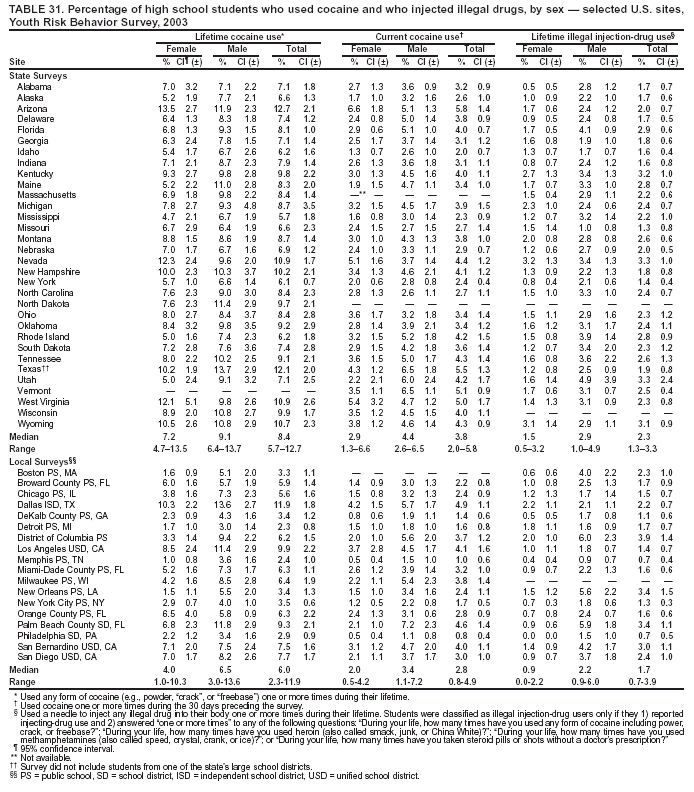 Return to top. Table 32 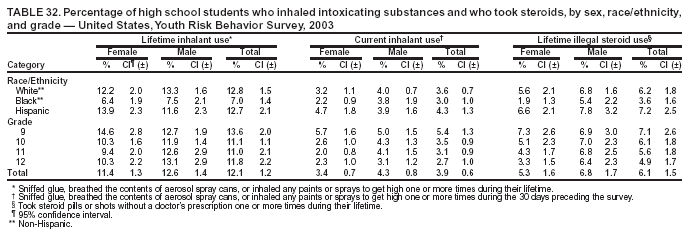 Return to top. Table 33  Return to top. Table 34  Return to top. Table 35 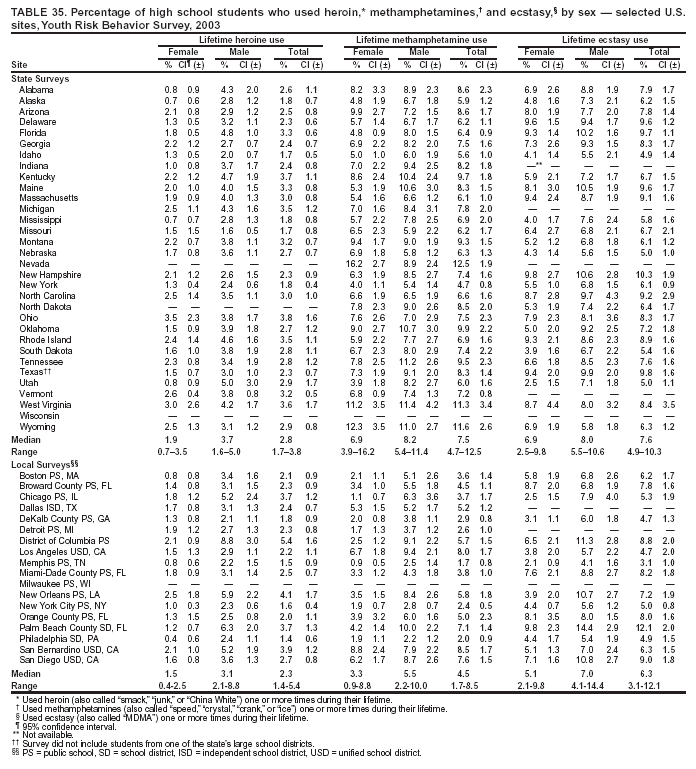 Return to top. Table 36 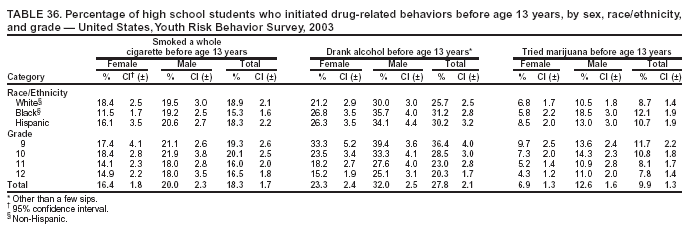 Return to top. Table 37 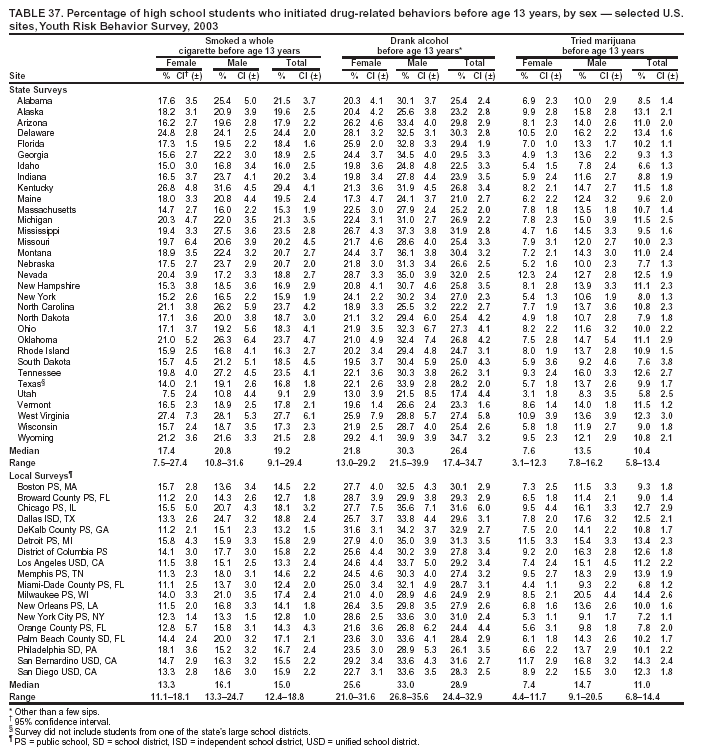 Return to top. Table 38 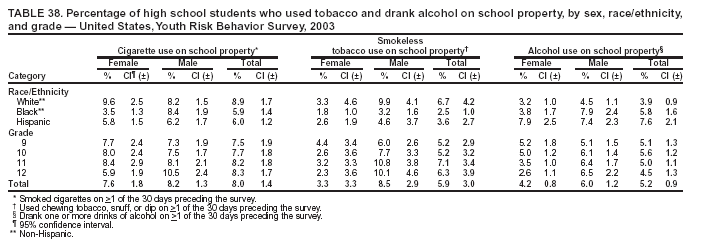 Return to top. Table 39  Return to top. Table 40 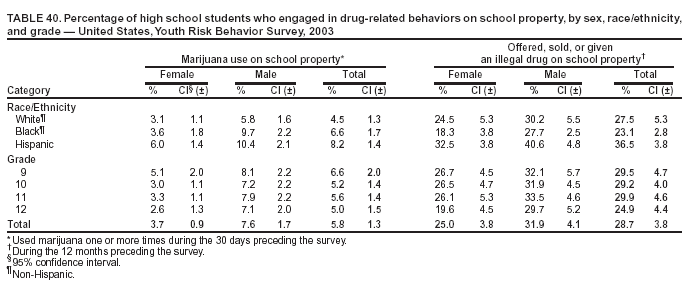 Return to top. Table 41 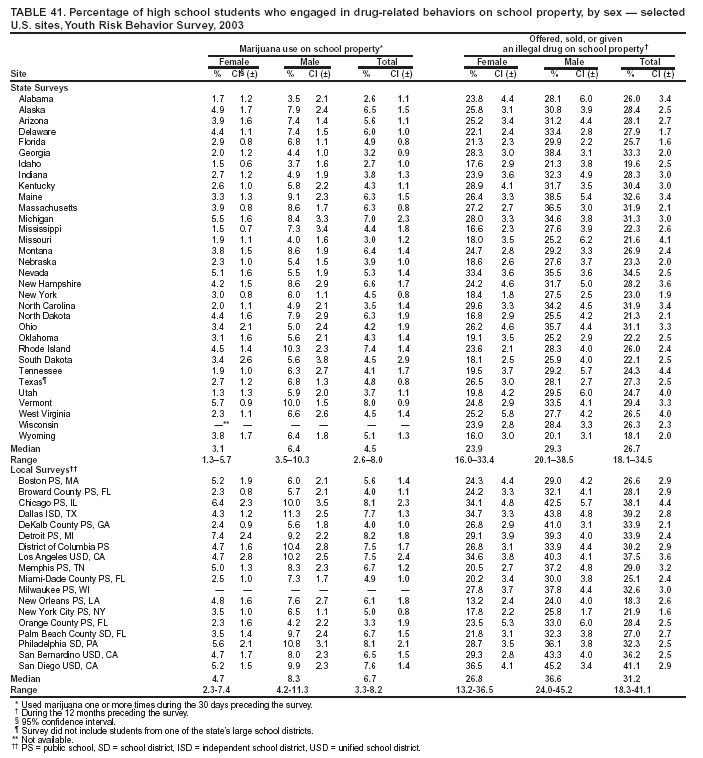 Return to top. Table 42 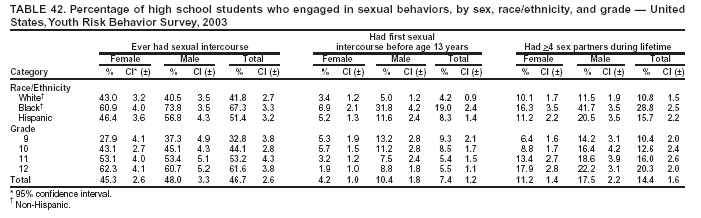 Return to top. Table 43 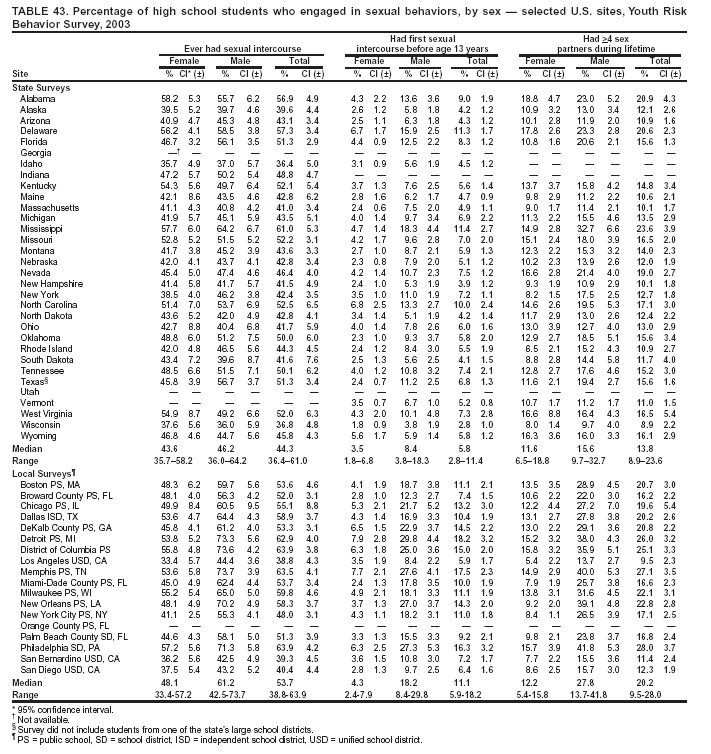 Return to top. Table 44 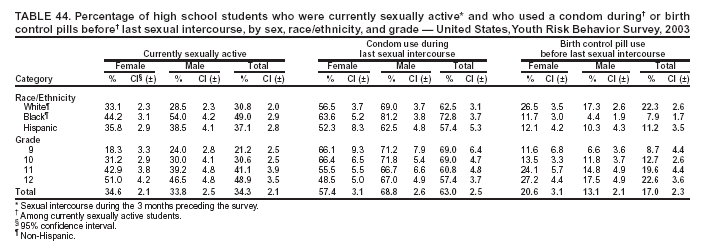 Return to top. Table 45  Return to top. Table 46  Return to top. Table 47  Return to top. Table 48 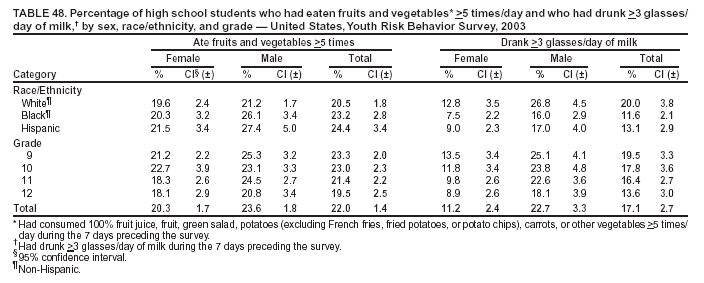 Return to top. Table 49 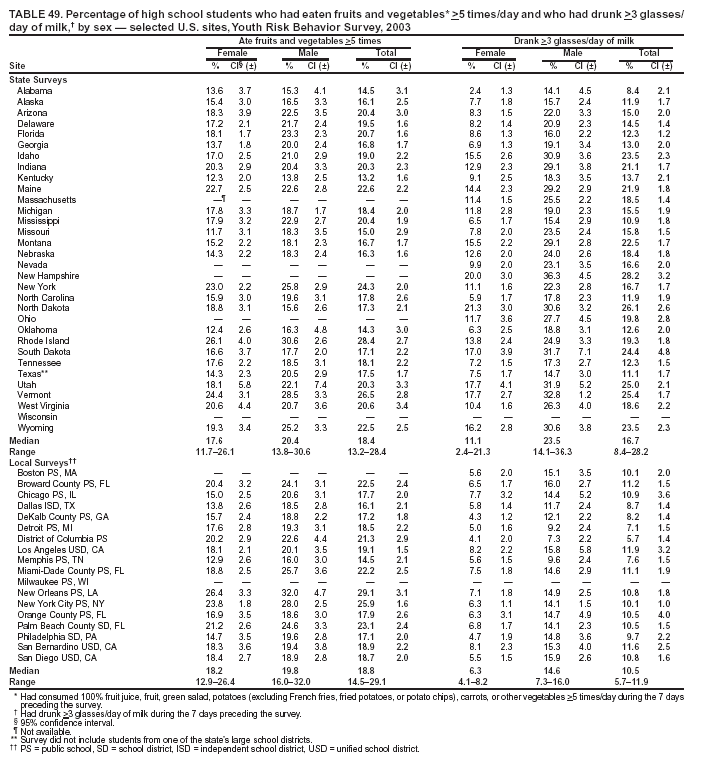 Return to top. Table 50  Return to top. Table 51 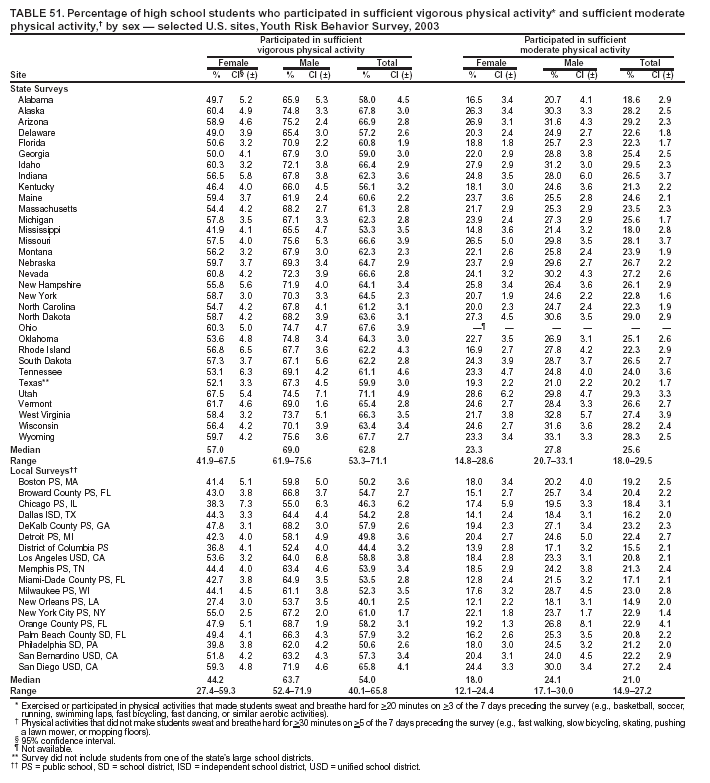 Return to top. Table 52 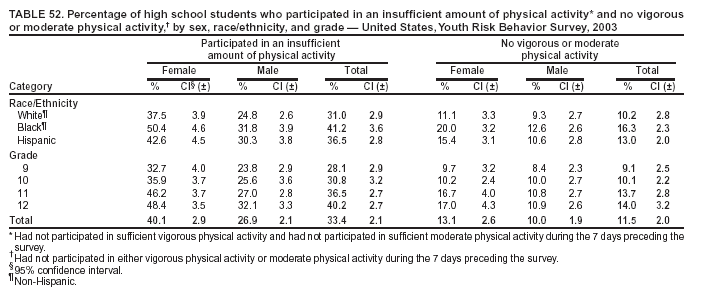 Return to top. Table 53  Return to top. Table 54 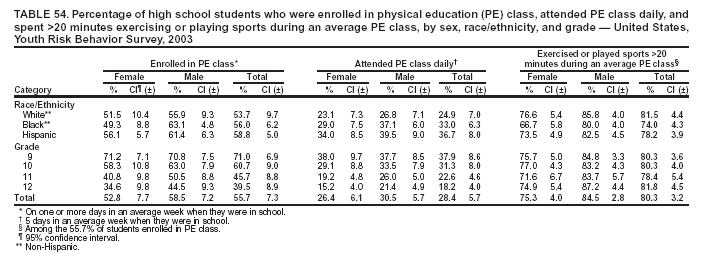 Return to top. Table 55 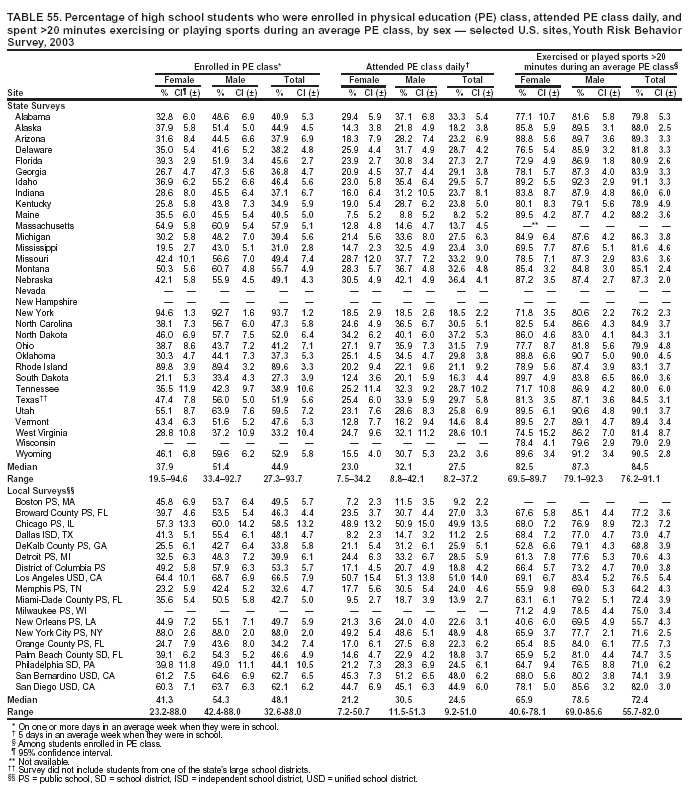 Return to top. Table 56  Return to top. Table 57  Return to top. Table 58  Return to top. Table 59 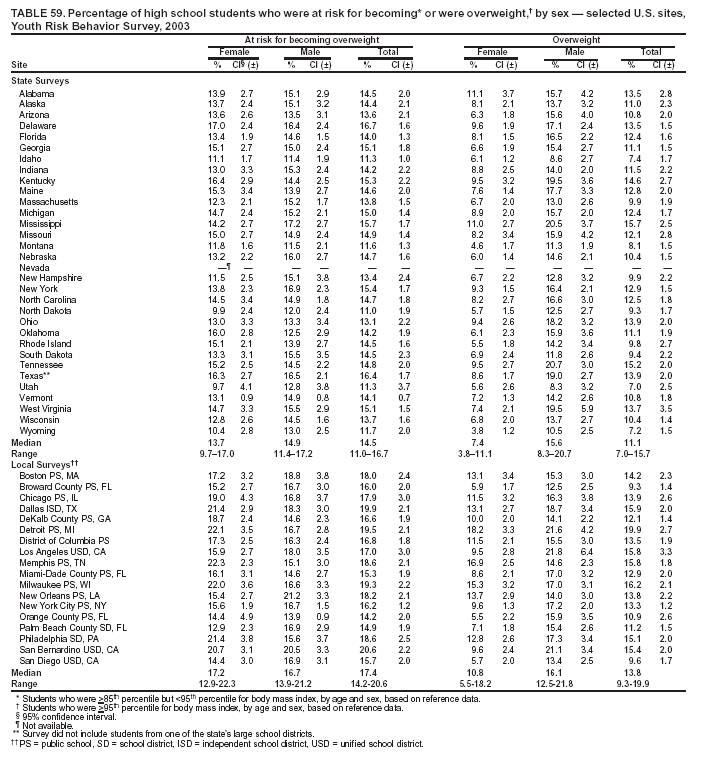 Return to top. Table 60 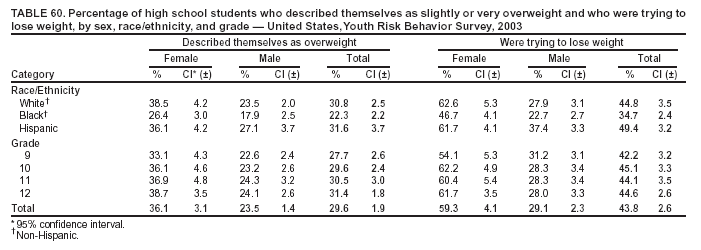 Return to top. Table 61  Return to top. Table 62  Return to top. Table 63 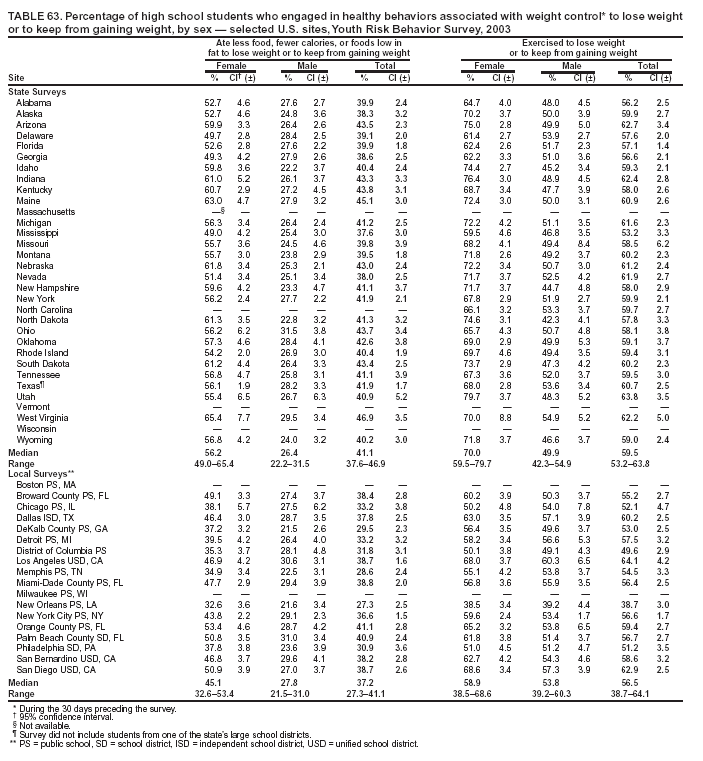 Return to top. Table 64  Return to top. Table 65  Return to top. Table 66 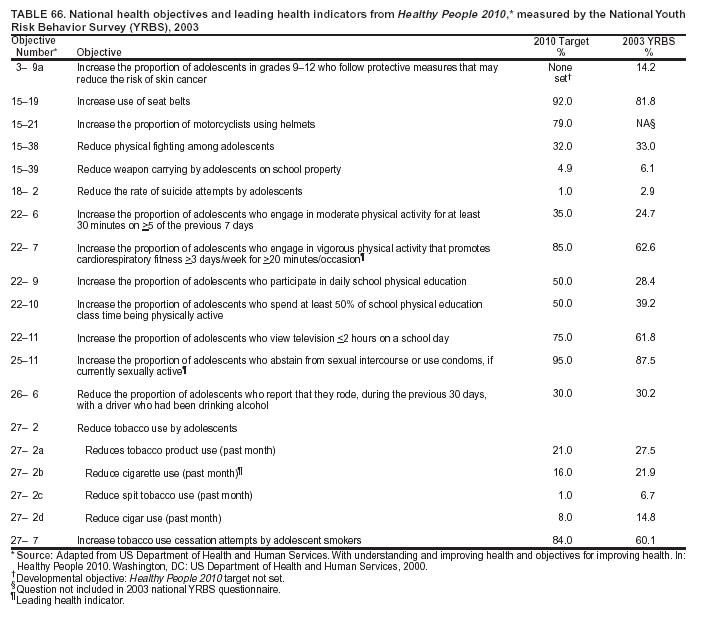 Return to top. Box 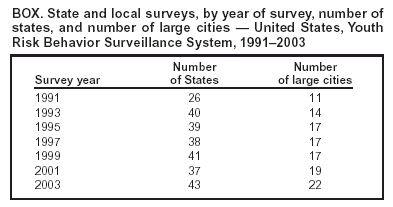 Return to top.
Disclaimer All MMWR HTML versions of articles are electronic conversions from ASCII text into HTML. This conversion may have resulted in character translation or format errors in the HTML version. Users should not rely on this HTML document, but are referred to the electronic PDF version and/or the original MMWR paper copy for the official text, figures, and tables. An original paper copy of this issue can be obtained from the Superintendent of Documents, U.S. Government Printing Office (GPO), Washington, DC 20402-9371; telephone: (202) 512-1800. Contact GPO for current prices. **Questions or messages regarding errors in formatting should be addressed to mmwrq@cdc.gov.Page converted: 5/18/2004 |
|||||||||
This page last reviewed 5/18/2004
|