 |
|
|
|
|
|
|
| ||||||||||
|
|
|
|
|
|
|
||||
| ||||||||||
|
|
|
|
|
Persons using assistive technology might not be able to fully access information in this file. For assistance, please send e-mail to: mmwrq@cdc.gov. Type 508 Accommodation and the title of the report in the subject line of e-mail. Homicide and Suicide Rates --- National Violent Death Reporting System, Six States, 2003In 2003, CDC instituted a new surveillance system, the National Violent Death Reporting System (NVDRS); the system collects detailed information regarding violent deaths from multiple sources. This report describes preliminary 2003 data from the first six states* that participated in NVDRS and compares these data with 1993--2002 data from the National Vital Statistics System (NVSS). The findings indicate a substantial increase in homicide rates among young males from 2002 to 2003 and substantial increases in both homicide and suicide rates among males from 2000 to 2003. These findings underscore the need for states to have timely information for effective violence-prevention programs. NVDRS is a state-based, active surveillance system that collects information on all homicides, suicides, deaths of undetermined intent, deaths resulting from legal intervention, and deaths from unintentional firearm injuries. State health departments participating in NVDRS typically identify these violent deaths as their death certificates are filed and then establish details of the cases from medical examiner, coroner, and law enforcement records. Details collected include the circumstances contributing to the deaths, interpersonal relationships, and toxicology results. The first six states to join NVDRS in 2003 accounted for 10% of suicides and 11% of homicides in the United States in 2002. International Classification of Diseases, Tenth Revision (ICD-10) codes for the underlying cause of deaths in 2003 have not yet been reported to NVDRS from two of the six states. However, trained coders in each state routinely assign a cause of death to all cases by using standard NVDRS definitions after reviewing information from all available sources. The cause of death, as defined by NVDRS, is consistent with the way most medical examiners and coroners assign cause of death. The NVDRS cause of death used for this analysis was consistent with the underlying cause of death from death certificates in approximately 97% of the homicides and suicides for which ICD-10 codes were available. This analysis was restricted to occurrent deaths (i.e., deaths within the state borders of both residents and nonresidents) because of delays in reporting deaths of state residents that occurred out of state. All NVDRS 2003 data are preliminary. NVDRS data for 2003 were compared with data for 1993--2002 from NVSS for the same six states. In NVSS, a homicide was defined as a death in which the underlying cause was coded as X85--Y09 or Y87.1; these codes exclude deaths attributed to legal intervention, operations of war, or terrorism (1). A suicide was defined as a death in which the underlying cause was coded as X60--X84 or Y87.0. Deaths that occurred in Oregon as a result of its Death with Dignity Act are not classified as suicides by Oregon law and were excluded from this analysis. Rates were calculated by using intercensal and postcensal bridged-race population estimates compiled by the National Center for Health Statistics (2) and were age-adjusted to the 2000 standard U.S. population. Rates were also stratified by sex and age. Because of limited death counts in some age groupings, the age categories were collapsed into ages 0--24 years, 25--64 years, and >65 years. Percentage changes in rates from 2002 to 2003 and 95% confidence intervals (CIs) were calculated. Trends in homicide and suicide rates in the six states during 2000--2003 were tested for statistical significance by using Poisson regression analysis. During 1993--2000, the age-adjusted homicide rate for the six NVDRS states decreased 29%, from 7.0 to 5.0 per 100,000 population (Figure). During 2000--2002, the age-adjusted homicide rate for the same states increased 6%, from 5.0 to 5.3. In 2003, the six states recorded 1,952 homicides, representing a further increase of 4% (95% CI = -2%--11%) above 2002 rates (Table). In four of the six states, homicide rates increased in 2003, but only an increase in New Jersey was statistically significant. The largest increase in rates was among males aged 0--24 years (18%; CI = 5%--32%); young males accounted for nearly all of the overall homicide increase in 2003. During 2000--2003, the trend test for homicide rates was significant, primarily because of the substantial increase in homicides among males aged 0--24 years. During 1993--2000, the age-adjusted suicide rate for the six states declined 13%, from 10.2 to 8.9 per 100,000 population (Figure). During 2000--2002, the age-adjusted suicide rate was relatively stable in the six states, declining only 0.3%. However, in 2003, NVDRS recorded 3,415 suicides, representing a significant increase of 5% (CI = 0.4%--11%) above 2002 rates (Table). From 2002 to 2003, suicide rates increased in four of six states, but only an increase in Oregon was statistically significant. From 2002 to 2003, significant increases were observed among females in all six states combined (19%; CI = 7%--32%) but not among males. However, during 2000--2003, the trend test for suicide rates was significant for males but not for females. Reported by: TL Serpi, MS, Maryland Dept of Health and Mental Hygiene. B Wiersema, Univ of Maryland, College Park; H Hackman, MD, L Ortega, MD, Massachusetts Dept of Health. BJ Jacquemin, MPH, KS Weintraub, MA, New Jersey Dept of Health and Senior Svcs. M Kohn, MD, L Millet, MSH, Oregon Dept of Human Svcs. LP Carter, MS, MA Weis, MPH, South Carolina Dept of Health and Environmental Control. KE Head, V Powell, PhD, Virginia Dept of Health. M Mueller, MPH, Public Health Prevention Svc; LJ Paulozzi, MD, Div of Violence Prevention; D White, MPS, G Ryan, PhD, Office of Statistics and Programming, National Center for Injury Prevention and Control, CDC. Editorial Note:During 1993--2000, NVSS data indicate that homicide and suicide rates declined in the United States; the age-adjusted rates of homicide and suicide declined 38% and 13%, respectively. These declines ended with small, consecutive increases in homicide and suicide rates in 2001 and 2002, even after exclusion of the deaths associated with the September 11, 2001, terrorist attacks (3). A similar pattern was observed during 1993--2002 in the six NVDRS states. Although preliminary national homicide and suicide rates did not increase in 2003, preliminary rates typically underestimate final rates for these conditions by 3%--4% (1). The homicide increase in NVDRS states, however, is consistent with final data from law enforcement reports compiled by the Federal Bureau of Investigation, which indicate an increase in the national homicide rate in 2003 (4). The homicide rate increase in NVDRS was caused by a substantial increase in homicides among males aged <24 years. Similarly, fluctuations in the national homicide rate in the 1980s and early 1990s were caused by homicides among males aged 15--24 years (5). Although NVDRS collects detailed information about circumstances associated with these deaths, determining how risk factors might have changed in recent years with only 1 year of data was not possible. Changes in rates of violence have been attributed to various risk factors (e.g., changes in the economy, the availability of drugs and weapons, and gang violence) (5,6), particularly with respect to homicide. NVDRS will monitor future data for changes in the proportions of violent deaths that involve specific risk factors. The findings in this report are subject to at least three limitations. First, all death rates were based on deaths by place of occurrence rather than place of residence, and some decedents might not have resided in the six states that provided data. However, 2002 NVSS data indicate that the numbers of resident and occurrent homicides in these six states combined differed by only 1.7%, and the difference was only 0.7% with respect to suicides. Therefore, occurrent deaths are acceptable substitutes for resident deaths. Second, preliminary NVDRS data might differ from final NVDRS data if late cases are added to the system. Third, NVDRS data might differ from data generated from NVSS because the NVDRS classification of a death might differ from the way a death is recorded on a death certificate in a limited number of cases. Although only six states began collecting data in 2003, NVDRS is now funding programs in 11 additional states† to collect data on violent deaths and submit these data to CDC. Further studies using NVDRS data will allow interpretation of broader trends across more states. Analyzing data on the circumstances associated with violent deaths should provide a better understanding of personal and social risk factors for violence and help identify potential prevention opportunities. Reviews of promising strategies conclude that those simultaneously addressing multiple risk factors for violence are most likely to be effective (7--9). Acknowledgments The findings in this report are based, in part, on contributions by L Frazier Jr, MSPH, K Webb, J Vigeant, L Annest, PhD, other staff of the Office of Statistics and Programming, National Center for Injury Prevention and Control, CDC. References
* Maryland, Massachusetts, New Jersey, Oregon, South Carolina, and Virginia † Alaska, California, Colorado, Connecticut, Georgia, New Mexico, North Carolina, Oklahoma, Rhode Island, Utah, and Wisconsin..
Table 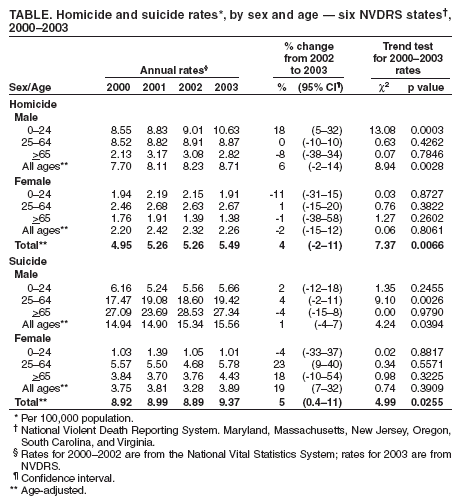 Return to top. Figure 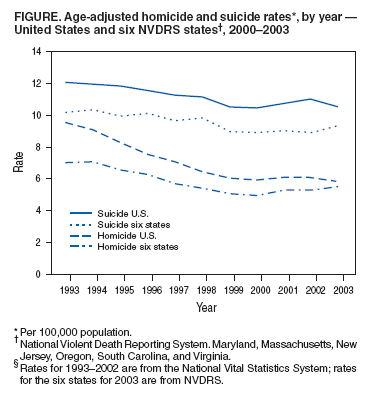 Return to top.
Disclaimer All MMWR HTML versions of articles are electronic conversions from ASCII text into HTML. This conversion may have resulted in character translation or format errors in the HTML version. Users should not rely on this HTML document, but are referred to the electronic PDF version and/or the original MMWR paper copy for the official text, figures, and tables. An original paper copy of this issue can be obtained from the Superintendent of Documents, U.S. Government Printing Office (GPO), Washington, DC 20402-9371; telephone: (202) 512-1800. Contact GPO for current prices. **Questions or messages regarding errors in formatting should be addressed to mmwrq@cdc.gov.Date last reviewed: 4/21/2005 |
|||||||||
|