 |
|
|
|
|
|
|
| ||||||||||
|
|
|
|
|
|
|
||||
| ||||||||||
|
|
|
|
|
Persons using assistive technology might not be able to fully access information in this file. For assistance, please send e-mail to: mmwrq@cdc.gov. Type 508 Accommodation and the title of the report in the subject line of e-mail. Changes in Mortality From Heart Failure -- United States, 1980-1995Heart failure is a disabling chronic disease and the leading principal diagnosis for hospitalization among older adults. Among the estimated 4.8 million U.S. residents who have heart failure, 70% are aged greater than or equal to 60 years (1). During the past decade, the number of hospitalizations for heart failure have increased among Medicare beneficiaries (2), and these numbers are expected to increase with progressive aging of the U.S. population even though the case-fatality rate for heart failure is high. This report summarizes trends in mortality from heart failure in the United States for 1980-1995 and presents state-specific death rates for 1995 (the most recent year for which such data are available). National mortality statistics are based on information from death certificates filed in state vital statistics offices and are compiled by CDC. Cause-of-death statistics are based on the underlying cause of death * recorded on the death certificate by the attending physician, medical examiner, or coroner in a manner specified by the World Health Organization and endorsed by CDC. Population estimates from the Bureau of the Census were used to calculate death rates for the U.S. population. Heart failure deaths were defined as those for which the underlying cause of death listed on the death certificate was International Classification of Diseases, Ninth Revision (ICD-9), code 428. This category includes congestive heart failure (ICD-9 code 428.0), left heart failure (428.1), and unspecified heart failure (428.9). Age-adjusted estimates were standardized to the 1970 U.S. population. Race-specific rates were limited to blacks and whites because numbers for other racial/ethnic groups were too small for meaningful analysis. The average annual percentage change in mortality from 1988 through 1995 was calculated as the 1995 rate minus the 1988 rate divided by the 1988 rate divided by seven and multiplied by 100. From 1980 to 1995, the number of deaths with heart failure as the underlying cause increased from 27,415 to 46,484; in 1995, approximately 43,600 (94%) of these deaths occurred among adults aged greater than or equal to 65 years. The overall rate changed from 10.3 in 1980 to 11.7 in 1995. Death rates for heart failure per 100,000 population were directly proportionate to age. For example, in 1995, age-specific rates were 633.5 for persons aged greater than or equal to 85 years, 130.8 for persons aged 75-84 years, and 32.2 for persons aged 65-74 years. The rate for persons aged greater than or equal to 85 years increased during 1980-1988 but declined slightly during 1989-1992 (Figure_1). Similar small declines also were observed during the same period for adults aged 75-84 years and those aged 65-74 years. For persons aged greater than or equal to 65 years, age-adjusted death rates for heart failure increased during 1980-1988 and declined after 1988 in each racial and sex group (Figure_2). Age-adjusted rates for the U.S. population aged greater than or equal to 65 years declined from 116.9 per 100,000 standard population in 1988 to 107.6 in 1995 (an average annual decline of 1.1% compared with 1988 rates). Among persons aged greater than or equal to 65 years, age-adjusted rates for 1995 were 126.1 for black men, 117.0 for white men, 107.6 for black women, and 101.2 for white women. The largest average annual percentage decline compared with 1988 rates occurred among black men (3.0% per year), followed by black women (2.2%), white men (1.7%), and white women (0.5%). Because of greater declines in death rates for heart failure among black adults, from 1980 to 1995 the black:white ratio for men narrowed from 1.3:1 to 1.1:1 and for women from 1.4:1 to 1.1:1. In 1995, age-adjusted death rates for heart failure among all ages varied substantially among the states and ranged from 3.4 (New Hampshire) to 29.7 (Mississippi) (Table_1). For persons aged greater than or equal to 65 years, age-adjusted rates for 1995 ranged from 30.7 (New Hampshire) to 255.6 (Alabama). Reported by: GA Haldeman, A Rashidee, R Horswell, Louisiana Health Care Review, Inc., Baton Rouge, Louisiana. Cardiovascular Health Br, Div of Adult and Community Health, National Center for Chronic Disease Prevention and Health Promotion, CDC. Editorial NoteEditorial Note: The findings in this report are consistent with a previously observed increase in age-adjusted death rates for heart failure during 1980-1988 (3) that was followed by a decline after 1988. The decline suggests improved survival of older adults with heart failure or misdiagnosis of the underlying cause of death among adults with heart failure. For example, heart failure is five to six times more likely to be reported as a contributor rather than as the underlying cause of death on the death certificate. Adults who survive a myocardial infarction or other hypertension-related diseases remain at increased risk for heart failure as they age. Among Medicare beneficiaries who are hospitalized for heart failure, hypertension is the secondary condition most commonly observed among black adults, and coronary heart disease is most common among white adults (2). Declines in death rates for heart failure during 1988-1995 among black adults and white men may reflect improved early detection of and changes in the therapeutic management of patients with hypertension (4), myocardial infarction (5), and heart failure (6-9). Since 1988, declines in death rates were greater among black adults than among white adults. Narrowing of the black-white ratio for heart failure mortality may reflect improved control of hypertension and access to medical care among older black adults. Low numbers of deaths in some states should be interpreted with caution because they may reflect random variation. However, variations by state in death rates for heart failure also may reflect regional differences in the prevalence and treatment of predisposing conditions (e.g., hypertension, myocardial infarction, and other heart diseases) and variations in access to early diagnosis and therapeutic management of heart failure. Medical specialty differences in treating heart failure (9) and state variations in mortality from heart failure suggest that national professional education initiatives may be needed to ensure that the clinical practice guidelines for evaluation and care of patients with heart failure are followed appropriately by all physicians to improve survival and reduce the risk for hospitalization through consistent pharmacologic management of this condition. Peer review organizations in states such as Louisiana (10) have begun to assess statewide practices of evaluating and treating heart failure as the first stage for implementing standardized quality improvement efforts that will target the hospital care of all Medicare patients with heart failure. Historically, the treatment of heart failure included combinations of diuretics and digitalis. Guidelines for clinical practice (7,8) recommend a trial of angiotensin-converting enzyme (ACE) inhibitors for heart failure patients with left ventricular systolic dysfunction (i.e., an ejection fraction of less than or equal to 40%), unless specific contraindications exist, and use of diuretics for patients with volume overload. Digoxin should be initiated with ACE inhibitors and diuretics in patients with severe heart failure and should be added in patients who remain symptomatic despite optimal management with ACE inhibitors and diuretics. Although mortality for heart failure is declining, an increasing number of older adults with heart failure will have a substantial impact on national health-care resources and expenditures. Despite potential progress in the treatment of heart failure, public health and clinical efforts should continue to target the prevention and treatment of high blood pressure and acute myocardial infarction -- the two major, preventable underlying conditions associated with increased risk for heart failure. Primary prevention of heart failure includes adherence to everyday health practices associated with preventing hypertension and myocardial infarction (e.g., reduced dietary fat and/or sodium intake, moderate alcohol intake, weight maintenance, regular physical activity, and nonsmoking or smoking cessation). In addition, adults with hypertension should control blood pressure levels by improving daily health practices and using antihypertensive medications to prevent the development of heart failure. References
Defined by the World Health Organization's International Classification of Diseases, Ninth Revision, as "(a) the disease or injury which initiated the train of morbid events leading directly to death, or (b) the circumstances of the accident or violence which produced the fatal injury." Figure_1 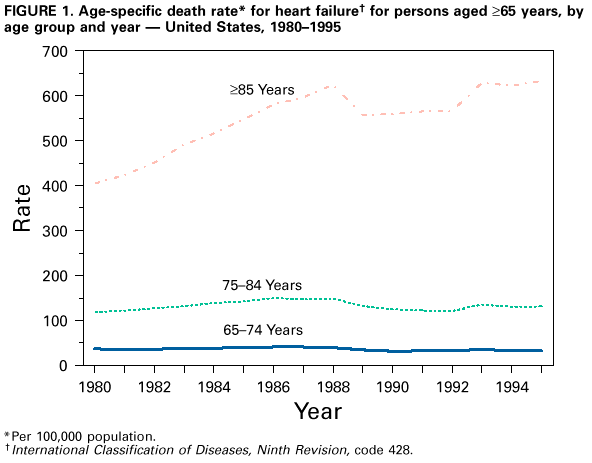 Return to top. Figure_2  Return to top. Table_1 Note: To print large tables and graphs users may have to change their printer settings to landscape and use a small font size.
TABLE 1. Number of deaths from, and age-adjusted rates for heart failure, * overall +
and among persons aged >=65 years, & by state -- United States, 1995
==============================================================================================
                           All ages         Persons aged >=65 years
                        --------------      -----------------------
State                     No.     Rate           No.           Rate
-------------------------------------------------------------------
Alabama                  1,825    28.8          1,668         255.6
Alaska                      34    12.3             29         114.1
Arizona                    463     7.4            431          67.3
Arkansas                 1,077    25.1          1,007         226.0
California               2,277     5.5          2,148          52.0
Colorado                   643    13.9            615         132.6
Connecticut                591     9.9            565          93.8
Delaware                   124    12.4            114         111.3
District of Columbia       101    11.9             88          96.8
Florida                  1,150     3.7          1,099          34.5
Georgia                  1,405    17.1          1,277         154.4
Hawaii                      87     5.5             78          46.9
Idaho                      234    14.3            227         137.8
Illinois                 2,619    14.6          2,460         134.0
Indiana                  1,548    17.5          1,475         165.3
Iowa                       202     3.6            200          33.0
Kansas                     811    16.8            780         157.8
Kentucky                 1,222    21.8          1,127         196.6
Louisiana                  932    16.9            826         146.2
Maine                      276    12.9            264         119.7
Maryland                   660    10.2            614          94.4
Massachusetts            1,551    13.8          1,502         132.6
Michigan                 1,804    12.9          1,706         121.5
Minnesota                  884    11.1            864         107.4
Mississippi              1,124    29.7            987         247.6
Missouri                 1,252    13.4          1,173         121.3
Montana                    214    15.3            204         142.3
Nebraska                   534    18.3            495         159.5
Nevada                     291    17.3            265         158.3
New Hampshire               56     3.4             52          30.7
New Jersey               1,225     9.7          1,156          89.0
New Mexico                 250    11.8            231         108.8
New York                 2,272     7.7          2,148          71.0
North Carolina           1,048    10.3            964          93.7
North Dakota               176    13.4            172         129.6
Ohio                     2,203    12.4          2,100         118.0
Oklahoma                 1,087    19.8          1,021         181.5
Oregon                     619    11.6            595         109.5
Pennsylvania             2,940    13.1          2,802         122.0
Rhode Island                66     3.5             63          32.4
South Carolina             702    15.1            628         131.8
South Dakota               197    13.5            190         127.1
Tennessee                  504     6.7            458          58.6
Texas                    2,764    12.4          2,517         112.5
Utah                       335    16.1            320         155.1
Vermont                     98    10.3             97         102.9
Virginia                 1,276    15.3          1,175         140.4
Washington                 786    10.1            757          97.2
West Virginia              551    17.0            529         161.8
Wisconsin                1,304    14.7          1,252         138.1
Wyoming                     84    12.9             81         123.4

Total                   46,484    11.7         43,596         107.6
-------------------------------------------------------------------
* International Classification of Diseases, Ninth Revision, code 428.
+ Per 100,000 population; standardized to the 1970 Bureau of the Census population.
& Per 100,000 population; standardized to the 1970 Bureau of the Census population aged >=65
  years.
==============================================================================================
Return to top. Disclaimer All MMWR HTML versions of articles are electronic conversions from ASCII text into HTML. This conversion may have resulted in character translation or format errors in the HTML version. Users should not rely on this HTML document, but are referred to the electronic PDF version and/or the original MMWR paper copy for the official text, figures, and tables. An original paper copy of this issue can be obtained from the Superintendent of Documents, U.S. Government Printing Office (GPO), Washington, DC 20402-9371; telephone: (202) 512-1800. Contact GPO for current prices. **Questions or messages regarding errors in formatting should be addressed to mmwrq@cdc.gov.Page converted: 10/05/98 |
|||||||||
This page last reviewed 5/2/01
|