1997 Revised Guidelines for Performing CD4+ T-Cell Determinations in Persons Infected with Human Immunodeficiency Virus (HIV)
Summary
These revised guidelines were developed by CDC for
laboratories
performing lymphocyte immunophenotyping assays in human
immunodeficiency
virus-infected persons. This report updates previous
recommendations
(MMWR 43{No. RR-3}) and reflects current technology in a field that
is
rapidly changing. The recommendations address laboratory safety,
specimen
collection, specimen transport, maintenance of specimen integrity,
specimen processing, flow cytometer quality control, sample
analyses,
data analysis, data storage, data reporting, and quality assurance.
INTRODUCTION
Accurate and reliable measures of CD4+ T-lymphocytes (CD4+
T-cells)
are essential to the assessment of the immune system of human
immunodeficiency virus (HIV)-infected persons (1-3). The
pathogenesis of
acquired immunodeficiency syndrome (AIDS) is largely attributable
to the
decrease in T-lymphocytes that bear the CD4 receptor (4-8).
Progressive
depletion of CD4+ T-lymphocytes is associated with an increased
likelihood of clinical complications (9,10). Consequently, the
Public
Health Service (PHS) has recommended that CD4+ T-lymphocyte levels
be
monitored every 3-6 months in all HIV-infected persons (11). The
measurement of CD4+ T-cell levels has been used to establish
decision
points for initiating Pneumocystis carinii pneumonia prophylaxis
(12) and
antiviral therapy (13) and to monitor the efficacy of treatment
(14-16).
CD4+ T-lymphocyte levels also are used as prognostic indicators in
patients who have HIV disease (17,18) and recently have been
included as
one of the criteria for initiating prophylaxis for several
opportunistic
infections that are sequelae of HIV infection (19,20). Moreover,
CD4+
T-lymphocyte levels are a criterion for categorizing HIV-related
clinical
conditions by CDC's classification system for HIV infection and
surveillance case definition for AIDS among adults and adolescents
(21).
Most laboratories measure absolute CD4+ T-cell levels in whole
blood
by a multi-platform, three-stage process. The CD4+ T-cell number is
the
product of three laboratory techniques: the white blood cell (WBC)
count;
the percentage of WBCs that are lymphocytes (differential); and the
percentage of lymphocytes that are CD4+ T-cells. The last stage in
the
process of measuring the percentage of CD4+ T-lymphocytes in the
whole-blood sample is referred to as "immunophenotyping by flow
cytometry" (22-28). Immunophenotyping refers to the detection of
antigenic determinants (which are unique to particular cell types)
on the
surface of WBCs using antigen-specific monoclonal antibodies that
have
been labeled with a fluorescent dye or fluorochrome (e.g.,
phycoerythrin
{PE} or fluorescein isothiocyanate {FITC}). The
fluorochrome-labeled
cells are analyzed by using a flow cytometer, which categorizes
individual cells according to size, granularity, fluorochrome, and
intensity of fluorescence. Size and granularity, detected by light
scattering, characterize the types of WBCs (i.e., granulocytes,
monocytes, and lymphocytes). Fluorochrome-labeled antibodies
distinguish
populations and subpopulations of WBCs. Although flow cytometric
immunophenotyping is a highly complex technology, methodology for
performing CD4+ T-cell determinations has become more standardized
between laboratories. The publication of several sets of guidelines
addressing aspects of the CD4+ T-lymphocyte testing process (e.g.,
quality control, quality assurance, and reagents for flow
cytometric
immunophenotyping of lymphocytes) has contributed to this
standardization
(29-32).
The CDC guidelines concerning CD4+ T-cell determinations (33)
were
first published in the MMWR in 1992 to provide laboratorians with
the
most complete information about how to measure CD4+ T-lymphocytes
in
blood from HIV-infected persons by using flow cytometry. These
guidelines
were based on data from scientific literature, information from
discussions with technical experts, and experience with related
voluntary
standards for flow cytometric analyses (29). The 1992 guidelines
concluded that more data were needed and that revisions would be
published as additional information became available and as
important
innovations in technology were made. In 1993, a national conference
was
convened by CDC with sponsorship from the Food and Drug
Administration
(FDA), National Institutes of Health, and Association of State and
Territorial Public Health Laboratory Directors. The objectives of
the
conference were to review data collected after 1992 and to obtain
input
about the efficacy of the 1992 guidelines. As a result of the 1993
conference, the revised guidelines for performing CD4+ T-cell
determinations in HIV-infected persons were published in 1994 (34).
Since 1994, the field of CD4+ T-cell testing has rapidly
expanded.
Flow cytometric analyses of T-cell subsets using three- and
four-color
approaches (in contrast to the two-color approach addressed in
previous
reports {35,36}), flow cytometric analyses for measuring both the
proportion and the absolute numbers of CD4+ T-lymphocytes, and
other
methods for deriving an absolute CD4+ T-cell count in a blood
sample are
now commercially available. (Some of these other methods do not
depend on
the multi-stage process and are collectively referred to in this
report
as single-platform methods.) Moreover, data evaluating some of the
parameters of two-color flow cytometric testing and the routine
testing
practices of laboratories that provide these testing services have
been
collected. A second national conference on CD4+ T-lymphocyte
immunophenotyping was held in Atlanta, Georgia, on December 12-13,
1995,
to discuss these changes. Information shared at the conference and
new
data collected about laboratory testing practices serve as the
basis for
the revisions and additions that have been made to the 1994
guidelines.
These changes include a) quality assurance (namely, revision of the
recommended monoclonal panel to provide a cost-effective solution
for
laboratories using three-color and four-color approaches), b) the
importance of following manufacturers' instructions when using
tests and
testing devices approved by the FDA, c) recommendations for
laboratories
performing three- and four-color T-lymphocyte immunophenotyping
(TLI),
and d) recommendations about the validation and verification
procedures
that laboratories should conduct before implementing new tests.
RECOMMENDATIONS
Laboratory Safety
Use universal precautions with all specimens (37).
Establish the following safety practices (38-44):
Wear laboratory coats and gloves when processing and
analyzing
specimens, including reading specimens on the flow
cytometer.
Never pipette by mouth. Use safety pipetting devices.
Never recap needles. Dispose of needles and syringes in
puncture-proof containers designed for this purpose.
Handle and manipulate specimens (e.g., aliquoting,
adding
reagents, vortexing, and aspirating) in a class I or II
biological safety cabinet.
Centrifuge specimens in safety carriers.
After working with specimens, remove gloves and wash
hands with
soap and water.
For stream-in-air flow cytometers, follow the
manufacturer's
recommended procedures to eliminate the operator's
exposure to
any aerosols or droplets of sample material.
Disinfect flow cytometer wastes. Add a volume of
undiluted
household bleach (5% sodium hypochlorite) to the waste
container
before adding waste materials so that the final
concentration of
bleach will be 10% (0.5% sodium hypochlorite) when the
container
is full (e.g., add 100 mL of undiluted bleach to an
empty
1,000-mL container).
Disinfect the flow cytometer as recommended by the
manufacturer.
One method is to flush the flow cytometer fluidics with
a 10%
bleach solution for 5-10 minutes at the end of the day,
then
flush with water or saline for at least 10 minutes to
remove
excess bleach, which is corrosive.
Disinfect spills with household bleach or an appropriate
dilution
of mycobactericidal disinfectant. Note: Organic matter
will reduce
the ability of bleach to disinfect infectious agents.
For specific
procedures about how areas should be disinfected, see
reference
44. For use on smooth, hard surfaces, a 1% solution of
bleach is
usually adequate for disinfection; for porous surfaces,
a 10%
solution is needed (44).
Assure that all samples have been properly fixed after
staining
and lysing, but before analysis. Note: Some commercial
lysing/fixing reagents will reduce the infectious
activity of
cell-associated HIV by 3-5 logs (45); however, these
reagents
have not been evaluated for their effectiveness against
other
agents (e.g., hepatitis virus). Buffered (pH 7.0-7.4)
1%-2%
paraformaldehyde or formaldehyde can inactivate
cell-associated
HIV to approximately the same extent (45-48). Cell-free
HIV can be
inactivated with 1% paraformaldehyde within 30 minutes
(49).
Because the commercial lysing/fixing reagents do not
completely
inactivate cell-associated HIV and the time frame for
complete
inactivation is not firmly established, stained and
lysed samples
should be resuspended and retained in fresh 1%-2%
paraformaldehyde
or formaldehyde through flow cytometric analysis.
Specimen Collection
Select the appropriate anticoagulant for hematologic
testing and
flow cytometric immunophenotyping.
Anticoagulant for hematologic testing:
Use tripotassium ethylenediamine tetra-acetate
(K3EDTA, 1.5
plus or minus 0.15 mg/mL blood) (50,51), and perform
the test
within the time frame allowed by the manufacturer of
the
hematology analyzer, not to exceed 30 hours.
Reject a specimen that cannot be processed within
this time
frame unless the hematology instrumentation is
suitable for
analyzing such specimens. Note: Some hematology
instruments are
capable of generating accurate results 12-30 hours
after
specimen collection (52). To ensure accurate results
for
specimens from HIV-infected persons, laboratories
must validate
their hematology instrument's ability to give the
same result
at time 0 and at the maximum time claimed by the
manufacturer
when using specimens from both persons infected with
HIV and
those not infected.
Anticoagulant for flow cytometric immunophenotyping,
depending on
the delay anticipated before sample processing:
Use K3EDTA, acid citrate dextrose (ACD), or heparin
if specimens
will be processed within 30 hours after collection.
Note: K3EDTA
should not be used for specimens held for greater
than 30 hours
before testing because the proportion of some
lymphocyte
populations changes after this period (53).
Use either ACD or heparin, not K3EDTA, if specimens
will be
processed within 48 hours after specimen collection.
Reject a specimen that cannot be processed within 48
hours
after specimen collection and request another.
Collect blood specimens by venipuncture (54) into evacuated
tubes
containing an appropriate anticoagulant, completely
expending the
vacuum in the tubes.
Draw specimens from children in pediatric tubes to avoid
underdrawing.
Mix the blood well with the anticoagulant to prevent
clotting.
Draw the appropriate number of tubes:
Use one tube containing K3EDTA when a) hematology and
flow
cytometric immunophenotyping will be performed in the
same
laboratory on the same specimen or b) a single
measurement is
performed on the flow cytometer that results in an
absolute
number. Note: For single-platform methods that do not
use
determinations from a hematology analyzer or from
conventional
flow cytometers to derive absolute CD4+ T-cell numbers,
follow
the manufacturer's recommendations for anticoagulant and
maximum times between specimen collection and testing.
In all other circumstances, draw two separate tubes
(K3EDTA for
hematologic determinations and K3EDTA, ACD, or heparin
for flow
cytometric immunophenotyping).
Label all specimens with the date, time of collection, and
a unique
patient identifier.
Assure that patient information and test results are
accorded
confidentiality.
Provide on the submission form pertinent medications and
disease
conditions that may affect the immunophenotyping test
(Appendix).
Specimen Transport
Maintain and transport specimens at room temperature (64-72
F {18-22
C}) (52,55-57). Avoid extremes in temperature so that
specimens do
not freeze or become too hot. Temperatures greater than 99
F (37 C)
may cause cellular destruction and affect both hematology
and flow
cytometry measurements (52). In hot weather, packing the
specimen in
an insulated container and placing this container inside
another
containing an ice pack and absorbent material may be
necessary. This
method helps retain the specimen at ambient temperature.
The effect
of cool temperatures (i.e., 39 F {4 C}) on
immunophenotyping results
is not clear (52,57).
Transport specimens to the immunophenotyping laboratory as
soon as
possible.
For transport to locations outside the collection facility
but within
the state, follow state or local guidelines. One method for
packaging
such specimens is to place the tube containing the specimen
in a
leak-proof container (e.g., a sealed plastic bag) and to
pack this
container inside a cardboard canister containing sufficient
material
to absorb all the blood should the tube break or leak. Cap
the
canister tightly. Fasten the request slip securely to the
outside of
this canister with a rubber band. For mailing, this
canister should
be placed inside another canister containing the mailing
label.
For interstate shipment, follow federal guidelines * for
transporting
diagnostic specimens. Note: Use overnight carriers with an
established record of consistent overnight delivery to
ensure arrival
the following day. Check with these carriers for their
specific
packaging requirements.
Obtain specific protocols and arrange appropriate times of
collection
and transport from the facility collecting the specimen.
Specimen Integrity
Inspect the tube and its contents immediately upon arrival.
Take corrective actions if the following occur:
If the specimen is hot or cold to the touch but not
obviously
hemolyzed or frozen, process it but note the temperature
condition on the worksheet and report form. Do not
rapidly warm or
chill specimens to bring them to room temperature
because this may
adversely affect the immunophenotyping results (52).
Abnormalities
in light-scattering patterns will reveal a compromised
specimen.
If blood is hemolyzed or frozen, reject the specimen and
request
another.
If clots are visible, reject the specimen and request
another.
If the specimen is greater than 48 hours old (from the
time of
draw), reject it and request another.
Specimen Processing
Hematologic testing
Perform the hematologic tests within the time frame
specified by
the manufacturer of the specific hematology instrument
used (time
from blood specimen draw to hematologic test). (See Note
under
II.A.1.b.)
Perform an automated WBC count and differential,
counting
10,000-30,000 cells (58). If the specimen is rejected or
"flagged"
by the instrument, a manual differential of at least 400
cells can
be performed. If the flag is not on the lymphocyte
population and
the lymphocyte differential is reported by the
instrument, the
automated lymphocyte differential should be used.
If absolute counts are determined by using a
single-platform
method, hematology results are not needed for this
determination.
Immunophenotyping
For optimal results, perform the test within 30 hours,
but no
later than 48 hours, after drawing the blood specimen
(59,60).
When centrifuging, maintain centrifugation forces of no
greater
than 400 g for 3-5 minutes for wash steps.
Vortex sample tubes to mix the blood and reagents and
break up
cell aggregates. Vortex samples immediately before
analysis to
optimally disperse cells.
Include a source of protein (e.g., fetal bovine serum or
bovine
serum albumin) in the wash buffer to reduce cell clumps
and
non-specific fluorescence.
Incubate all tubes in the dark during the
immunophenotyping
procedure.
Before analysis on the flow cytometer, be sure all
samples have
been adequately fixed. Although some of the commercial
lysing/fixing reagents can inactivate cell-associated
HIV, all
tubes should be fixed after staining and lysing with
1%-2%
buffered paraformaldehyde or formaldehyde. Note: The
characteristics of paraformaldehyde and formaldehyde may
vary
between lots. They may also lose their effectiveness
over time.
Therefore, these fixatives should be made fresh weekly
from
electron-microscopy-grade aqueous stock.
Immediately after processing the specimens, store all
stained
samples in the dark and at refrigerator temperatures
(39-50 F
{4-10 C}) until flow cytometric analysis. These
specimens should
be stored for no longer than 24 hours unless the
laboratory can
demonstrate that scatter and fluorescence patterns do
not change
for specimens stored longer.
If absolute counts are determined on the flow cytometer,
follow
the manufacturer's recommended protocols.
Monoclonal Antibody Panels
Monoclonal antibody panels must contain appropriate
monoclonal
anti-body combinations to enumerate CD4+ and CD8+ T-cells
and to
ensure the quality of the results (61).
CD4 T-cells must be identified as being positive for
both CD3 and
CD4.
CD8 T-cells must be identified as being positive for
both CD3 and
CD8.
Two-color monoclonal antibody panels
The recommended two-color immunophenotyping antibody
panel
(Table_1), delineated by CD nomenclature (62) and
fluorochrome, provides data useful for defining the
T-cell
population and subpopulations; determining the recovery
and purity
of the lymphocytes in the gate; setting cursors for
positivity;
accounting for all lymphocytes in the sample; monitoring
tube-to-tube variability; and monitoring T-cell, B-cell,
and
natural killer (NK)-cell levels. The following internal
controls
are included in the panel:
CD3 Monoclonal antibody in tubes 3-6 serves as a
control for
tube-to-tube variability and is also used to
determine T-cell
populations. Note: All CD3 values in this six-tube
panel should
be within 3% of each other. If the CD3 value of a
tube is
greater than 3% of any of the others, that tube
should be
repeated (i.e., new aliquot of blood labeled, lysed,
and
fixed).
Monoclonal antibodies that label T-cells, B-cells,
and NK-cells
are used to account for all lymphocytes in the
specimen (61).
An abbreviated two-color panel should only be used for
testing
specimens from patients for whom CD4+ T-cell levels are
being
requested as part of sequential follow-up, and then only
after
consulting with the requesting clinician. Because some
of the
internal controls are no longer included, when using an
abbreviated panel, the immunophenotyping results should
be
reviewed carefully to ensure that CD3+ T-cell levels are
similar
to those determined previously with the full recommended
panel.
When discrepancies occur, the specimens must be
reprocessed by
using the full recommended two-color monoclonal antibody
panel.
Three-color monoclonal antibody panels
Three-color monoclonal antibody panels should fulfill
the
following basic requirements: enumerate CD4+ and CD8+
T-cells,
validate the lymphocyte gate used, and provide some
assessment of
tube-to-tube variability.
For determining T-cell subset percentages, the third
color should
be used to identify lymphocytes by following one of two
procedures
(Table_2):
Use CD45 as the third color to identify lymphocytes
as those
cells that are bright CD45+ but have low side
scattering
properties. In this case, the panel would consist of
the
following monoclonal antibodies: CD3/CD4/CD45;
CD3/CD8/CD45;
and CD3/CD19/CD45 ((Table_2), Panel A).
Use lineage markers (T-cell, B-cell, and NK-cell) to
identify
lymphocytes (63). The panel would consist of the
following
monoclonal antibodies: CD3/CD19/CD16 and/or CD56;
CD3/CD4/CD8;
and an isotype control ((Table_2), Panel B).
Note: Software
on the flow cytometer must be capable of using the
information
obtained from these monoclonal antibody combinations
to
correctly identify lymphocytes and to extrapolate
that
information to determine the percentage of
lymphocytes that are
CD4+ and CD8+ T-cells (63). Note: A single tube
containing CD3,
CD4, and CD8 monoclonal antibodies is not appropriate
for
determining the percentage of lymphocytes that are
CD4+ or CD8+
T-cells because there is no method to validate the
lymphocyte
gate in this tube without the addition of another
tube for that
purpose. Lymphocyte gate purity and recovery cannot
be
determined. Internal quality control measures may be
obtained
by adding another tube containing CD3 (e.g., CD3,
CD19, and
CD16 and/or CD56).
A three-color monoclonal antibody panel must consist of
at least
two tubes, each with the same lineage marker. For the
examples
above, CD3 is the common lineage marker in each tube.
Differences
between replicate CD3 results should be less than or
equal to 2%.
Note: The variability of a CD3 result between two tubes
is
approximately half that of four tubes.
Four-color monoclonal antibody panels
Addition of CD45 to a single tube containing CD3, CD4,
and CD8
allows the identification of lymphocytes based on CD45
and side
scatter and the enumeration of CD4+ and CD8+
T-lymphocytes.
A four-color monoclonal antibody panel must consist of
at least
two tubes, each with the same lineage marker. A second
tube
containing CD45, CD3, CD19, and CD16 and/or CD56 is
recommended.
Negative and Positive Controls for Immunophenotyping
Negative (isotype) reagent control
Use this control to determine nonspecific binding of the
mouse
monoclonal antibody to the cells and to set markers for
distinguishing fluorescence-negative and
fluorescence-positive
cell populations.
Use a monoclonal antibody with no specificity for human
blood
cells but of the same isotype(s) as the test reagents.
Note:
In many cases, the isotype control may not be optimal
for
controlling nonspecific fluorescence because of
differences in
F/P ratio, antibody concentration between the isotype
control
and the test reagents, and other characteristics of the
immunoglobulin in the isotype control. Additionally,
isotype
control reagents from one manufacturer are not
appropriate for
use with test reagents from another manufacturer.
The isotype control is not needed for use with CD45
because CD45
is used to identify leukocyte populations based on
fluorescence
intensity.
For monoclonal antibody panels containing antibodies to
CD3, CD4,
and CD8, the isotype control may not be needed because
labeling
with these antibodies results in fluorescence patterns
in which
the unlabeled cells are clearly separated from the
labeled cells.
In these instances, the negative cells in the histogram
are the
appropriate isotype control.
The isotype control must be used when a monoclonal
antibody panel
contains monoclonal antibodies that label populations
that do not
have a distinct negative population (e.g., some CD16 or
CD56
monoclonal antibodies).
Positive methodologic control
The methodologic control is used to determine whether
procedures
for preparing and processing the specimens are optimal.
This
control is prepared each time specimens from patients
are
prepared.
Use either a whole-blood specimen from a control donor
or
commercial materials validated for this purpose.
Ideally, this
control will match the population of patients tested in
the
laboratory. (See Section XII.D.)
If the methodologic control falls outside established
normal
ranges, determine the reason. Note: The purpose of the
methodologic control is to detect problems in preparing
and
processing the specimens. Biologic factors that cause
only the
whole-blood methodologic control to fall outside normal
ranges
do not invalidate the results from other specimens
processed
at the same time. Poor lysis or poor labeling in all
specimens,
including the methodologic control, invalidates results.
Positive control for testing reagents
Use this control to test the labeling efficiency of new
lots of
reagents or when the labeling efficiency of the current
lot is
questioned. Prepare this control only when needed (i.e.,
when
reagents are in question) in parallel with lots of
reagents of
known acceptable performance. Note: New reagents must
demonstrate
similar results to those of known acceptable
performance.
Use a whole-blood specimen or other human lymphocyte
preparation
(e.g., cryopreserved or commercially obtained
lyophilized
lymphocytes).
VIII. Flow Cytometer Quality Control (29)
Align optics daily. This ensures that the brightest and
tightest
peaks are produced in all parameters. Note: Some clinical
flow
cytometers can be aligned by laboratory personnel whereas
others can
be aligned only by qualified service personnel.
Align the flow cytometer by using stable calibration
material
(e.g., microbeads labeled with fluorochromes) that has
measurable
forward scatter, side scatter, and fluorescence peaks.
Align the calibration particles optimally in the path of
the
laser beam and in relation to the collection lens so the
brightest
and tightest peaks are obtained.
Align stream-in-air flow cytometers daily (at a minimum)
and
stream-in-cuvette flow cytometers (most clinical flow
cytometers
are this type) as recommended by the manufacturer.
Standardize daily. This ensures that the flow cytometer is
performing
optimally each day and that its performance is the same
from day to
day.
Select machine settings that are optimal for
fluorochrome-labeled,
whole-blood specimens.
Use microbeads or other stable standardization material
to place
the scatter and fluorescence peaks in the same scatter
and
fluorescence channels each day. Adjust the flow
cytometer as
needed.
Maintain records of all daily standardizations. Monitor
these to
identify any changes in flow cytometer performance.
Retain machine standardization settings for the
remaining quality
control procedures (sensitivity and color compensation)
and for
reading the specimens.
Determine fluorescence resolution daily. The flow cytometer
must
differentiate between the dim peak and autofluorescence in
each
fluorescence channel.
Evaluate standardization/calibration material or cells
that have
low-level fluorescence that can be separated from
autofluorescence (e.g., microbeads with low-level and
negative
fluorescence or CD56-labeled lymphocyte preparation).
Establish a minimal acceptable distance between peaks,
monitor
this difference, and correct any daily deviations.
Compensate for spectral overlap daily. This step corrects
the
spectral overlap of one fluorochrome into the fluorescence
spectrum
of another.
Use either microbead or cellular compensation material
containing
three populations for two-color immunofluorescence (no
fluorescence, PE fluorescence only, and FITC
fluorescence only),
four populations for three-color immunofluorescence (the
three
above plus a population that is positive for only the
third
color), or five populations for four-color (the four
above plus a
population that is positive for only the fourth color).
Analyze this material and adjust the electronic
compensation
circuits on the flow cytometer to place the fluorescent
populations in their respective fluorescence quadrants
with no
overlap into the double-positive quadrant
(Figure_1). If three
fluorochromes are used, compensation must be carried out
in an
appropriate sequence: FITC, PE, and the third color,
respectively
(64). For four-color monoclonal antibody panels, follow
the flow
cytometer manufacturer's instructions for four
fluorochromes.
Avoid over-compensation.
If standardization or calibration particles (microbeads)
have been
used to set compensation, confirm proper calibration by
using
lymphocytes labeled with FITC- and PE-labeled monoclonal
antibodies (and a third-color- or fourth-color-labeled
monoclonal
antibody for three-color or four-color panels) that
recognize
separate cell populations but do not overlap. These
populations
should have the brightest expected signals. Note: If a
dimmer-than-expected signal is used to set compensation,
suboptimal compensation for the brightest signal can
result.
Reset compensation when photomultiplier tube voltages or
optical
filters are changed.
Repeat all four instrument quality control procedures
whenever
instrument problems occur or if the instrument is serviced
during
the day.
Maintain instrument quality-control logs, and monitor them
continually for changes in any of the parameters. In the
logs,
record instrument settings, peak channels, and coefficient
of
variation (CV) values for optical alignment,
standardization,
fluorescence resolution, and spectral compensation.
Re-establish
fluorescence levels for each quality-control procedure when
lot
numbers of beads are changed.
Sample Analyses
For the two-color immunophenotyping panel using a
light-scatter
gate, analyze the sample tubes of each patient's specimen
in the
following order: 1) The tube containing CD45 and CD14
(gating
reagent): read this tube first so that gates can be set
around the
lymphocyte cluster; 2) Isotype control: set cursors for
differentiating positive and negative populations so that
less than
or equal to 2% of the cells are positive; and 3) Remaining
tubes in
the panel.
Count at least 2,500 gated lymphocytes in each sample.
This
number ensures with 95% confidence that the result is
less than
or equal to 2% standard deviation (SD) of the "true''
value
(binomial sampling). Note: This model assumes that
variability
determined from preparing and analyzing replicates is
less than
or equal to 2% SD. Each laboratory must determine the
level of
variability by preparing and analyzing at least eight
replicates
of the last four tubes in the recommended panel. Measure
variability when first validating the methodology used
and again
when methodologic changes are made.
Examine light-scattering patterns on each sample tube.
Determine
whether lysis or sample preparation, which can affect
light
scattering, is the same in each sample tube of a
patient's
specimen. Deviation in a particular tube usually
indicates sample
preparation error, and the tube should be repeated
(i.e., a new
aliquot of blood should be stained and lysed).
For three- or four-color monoclonal antibody panels using a
CD45/side
scatter gate, determine the lymphocyte population based on
bright
CD45 fluorescence and low side scattering properties. Draw
a gate on
this population and analyze the cell populations using this
gate
(65).
Data Analysis
Light-scatter gate (for two-color panels).
Reading from the sample tube containing CD45 and CD14,
draw
lymphocyte gates using forward and side light-scattering
patterns
and fluorescence staining.
When using CD45 and CD14 and light-scattering
patterns for
drawing lymphocyte gates, define populations on the
following
basis:
Lymphocytes stain brightly with CD45 and are
negative for
CD14.
Monocytes and granulocytes have greater forward
and side
light-scattering properties than lymphocytes.
Monocytes are positive for CD14 and have
intermediate to
high intensity for CD45.
Granulocytes are dimly positive for CD14 and show
less
intense staining with CD45.
Debris, red cells, and platelets show lower
forward
scattering than lymphocytes and do not stain
specifically
with CD45 or CD14.
Using the above characteristics, draw a
light-scattering gate
around the lymphocyte population (66). Note: Other
methods for
drawing a lymphocyte gate must accurately identify
lymphocytes
and account for non-lymphocyte contamination of the
gate.
Verify the lymphocyte gate by determining the recovery
of
lymphocytes within the gate and the lymphocyte purity of
the gate.
Definitions
The lymphocyte recovery (previously referred to as
the
proportion of lymphocytes within the gate) is the
percentage
of lymphocytes in the sample that are within the
gate.
The lymphocyte purity of the gate is the
percentage of cells
within the gate that are lymphocytes. The
remainder may be
monocytes, granulocytes, red cells, platelets, and
debris.
Optimally, the lymphocyte recovery should be greater
than or
equal to 95%.
Optimally, the lymphocyte purity of the gate should
be greater
than or equal to 90%.
Optimal gates include as many lymphocytes and as few
contaminants as possible.
Lymphocyte recovery within the gate using CD45 and
CD14 can be
determined by two different methods: light-scatter
gating and
fluorescence gating ((Figure_2) and
(Figure_3)). Note:
The number of lymphocytes identified will be the same
whether
determined by light-scatter gating or by fluorescence
gating.
Lymphocyte recovery determined by light-scatter
gating is
done as follows: first, identify the lymphocytes
by setting
a relatively large light-scatter gate
((Figure_2),
Panel A), then set an analysis region around CD45
and CD14
lymphocyte reactivity (bright CD45-positive,
negative for
CD14) ((Figure_2), Panel B). Determine the
number of cells
that meet both criteria (total number of
lymphocytes). Set
a smaller lymphocyte light-scatter gate that will
be used
for analyzing the remaining tubes ((Figure_2),
Panel C).
Determine the number of cells that fall within
this gate and
the CD45/ CD14 analysis region (bright
CD45-positive,
negative for CD14) ((Figure_2), Panel D). This
number
divided by the total number of lymphocytes times
100 is the
lymphocyte recovery. The advantage of this method
is that it
can easily be done on most software programs.
Lymphocyte recovery determined by fluorescence
gating is
done as follows. First, identify lymphocytes by
setting a
fluorescence gate around the bright CD45-positive,
CD14-negative cells ((Figure_3), Panel A),
then set an
analysis region around a large light-scatter
region that
includes lymphocytes ((Figure_3), Panel B).
The number
of cells that meet both criteria is the total
number of
lymphocytes. Set a smaller lymphocyte
light-scatter gate
that will be used for analyzing the remaining
tubes
((Figure_3), Panel C). Determine the number of
cells
that fall within this gate and the CD45/CD14
analysis
region (bright CD45+, negative for CD14)
((Figure_3),
Panel D). This number divided by the total number
of
lymphocytes times 100 is the lymphocyte recovery.
The
advantage of this method is that the light-scatter
pattern
of lymphocytes can be easily determined. Note:
Some
instrument software packages automatically
determine
lymphocyte recovery by fluorescence gating; others
do not.
The lymphocyte purity of the gate is determined from
the CD45
and CD14 tube by calculating the percentage of cells
in the
light-scattering gate that are bright CD45-positive
and
negative for CD14.
If the recommended recovery and purity of lymphocytes
within
the gate cannot be achieved, redraw the gate. If
minimum levels
still cannot be obtained, reprocess the specimen. If
this
fails, request another specimen.
CD45 gating (for three- and four-color monoclonal panels)
Identify lymphocytes as cells brightly labeled with CD45
and
having low side scattering properties.
Establish criteria for cluster identification based on a
clear
definition of lymphocytes that does not include
basophils (less
bright CD45, low side scatter) or monocytes (less bright
CD45,
moderate side scatter). Note: Care must be taken to
include all
lymphocytes. B-cells may have slightly less CD45
fluorescence
than the T-cells (the major cluster of lymphocytes).
NK-cells
have bright CD45 fluorescence but have slightly more
side
scattering properties than the majority of the
lymphocytes.
CD45/side scatter gates for lymphocytes are assumed to
contain
greater than 95% lymphocytes, and no further corrections
need be
made to the percentage subset results (65).
Lymphocyte recovery cannot be determined without using a
panel of
monoclonal antibodies that identify T-, B-, and
NK-cells. Note:
Validation of a CD45/side scatter gate is recommended
when
beginning to use CD45/ side scatter gates to help
determine the
CD45 and side scatter characteristics of T-, B-, and
NK-cells and
to ensure their inclusion in the gate.
Set cursors using the isotype control so that less than 2%
of cells
are positive. Note: If an isotype control is not used, set
cursors
based on the tube containing CD3 and CD4 so that the
negative and
positive cells in the histogram are clearly separated.
These cursors
may be used for the remaining tubes. If CD16 and/or CD56
are included
in a monoclonal antibody panel, an isotype control may be
needed to
help identify negative cells.
Analyze the remaining samples with the cursors set. Note:
In some
instances, the isotype-set cursors will not accurately
separate
positive and negative staining for another sample tube from
the same
specimen. In such cases, the cursors can be moved on that
sample to
more accurately separate these populations. The cursors
should not be
moved when fluorescence distributions are continuous with
no clear
demarcation between positively and negatively labeled
cells.
Analyze each patient or control specimen with lymphocyte
gates and
cursors for positivity set for that particular patient or
control.
When spectral compensation of a particular specimen appears
to be
inappropriate because FITC-labeled cells have been dragged
into the
PE-positive quadrant or vice-versa (when compensation on
all other
specimens is appropriate) (67), repeat the sample
preparation,
prewashing the specimen with phosphate-buffered saline
(PBS) (pH 7.2)
to remove plasma before monoclonal antibodies are added.
Include the following analytic reliability checks, when
available:
Optimally, at least 95% lymphocyte recovery (proportion
of
lymphocytes within the lymphocyte gate) should be
achieved.
Minimally, at least 90% lymphocyte recovery should be
achieved.
Note: These determinations can only be made when using
either CD14
and CD45 to validate the gate or when using T, B, and NK
reagents
to validate a gate.
Optimally, greater than or equal to 90% lymphocyte
purity should
be observed within the lymphocyte gate. Minimally,
greater than or
equal to 85% purity should be observed within the gate.
Optimally, the sum of the percentage of CD3+CD4+ and
CD3+CD8+
cells should equal the total percentage of CD3+ cells
within plus
or minus 5%, with a maximum variability of less than or
equal to
10%. Note: In specimens containing a considerable number
of T gd
cells (68,69), this reliability check may exceed the
maximum
variability.
Optimally, the sum of the percentage of CD3+ (T-cells),
CD19+
(B-cells), and CD3-(CD16 and/or CD56)+ (NK-cells) should
equal the
purity of lymphocytes in the gate plus or minus 5% (61),
with a
maximum variability of less than or equal to 10%. If the
data are
corrected for lymphocyte purity (see XII.B.), the sum
should
ideally equal 95%-105% (or at a minimum 90%-110%).
Data Storage
If possible, store list-mode data on all specimens
analyzed. This
allows for reanalysis of the raw data, including redrawing
of gates.
At a minimum, retain hard copies of the lymphocyte gate and
correlated dual histogram data of the fluorescence of each
sample.
Retain all primary files, worksheets, and report forms for
2 years or
as required by state or local regulation, whichever is
longer. Data
can be stored electronically. Disposal after the retention
period is
at the discretion of the laboratory director.
Data Reporting
Report all data in terms of CD designation, with a short
description
of what that designation means. Note: CD4+ T-cells are
T-helper
cells. The correct cells to report for this value are those
that are
positive for both CD3 and CD4. Similarly, CD8+ T-cells are
T-suppressor/cytotoxic cells and are positive for both CD3
and CD8.
Do not include other cell types (non-T-cells) in CD4 and
CD8 T-cell
determinations.
If using light-scatter gates, report data as a percentage
of the
total lymphocytes and correct for the lymphocyte purity of
the gate.
For example, if the lymphocyte purity is 94% and the CD3
value is
70%, correct the CD3 value by dividing 0.70 by 0.94 and
then multiply
the result by 100 to result in a T-lymphocyte value of 74%.
Report absolute lymphocyte subset values when an automated
complete
blood cell (CBC) count (WBC and differential) has been
performed
from blood drawn at the same time as that for
immunophenotyping.
Calculate the absolute values by multiplying the
lymphocyte subset
percentage (from flow cytometry data) by the absolute
number of
lymphocytes (from WBC and differential). Note: The
hematology
laboratory providing the CBC (WBC and differential) must
perform
satisfactorily in a hematology proficiency testing
program
approved by the Health Care Finance Administration
(HCFA) as
meeting the requirements of the Clinical Laboratory
Improvement
Amendments of 1988 (CLIA `88). *
Report both percentages and absolute counts when these
are
available. Note: If absolute counts are determined
directly on the
flow cytometer, report these results.
Report data from all relevant monoclonal antibody
combinations with
corresponding reference limits of expected normal values
(e.g., CD4+
T-cell percentage and absolute number of CD4+ T-cells).
Reference
limits for immunophenotyping test results must be
determined for each
laboratory (29). Separate reference ranges must be
established for
adults and children, and the appropriate ranges must be
used for
patient specimens.
XIII. Quality Assurance
Assure the overall quality of the laboratory's CD4+
T-cell testing
by monitoring and evaluating the effectiveness of the
laboratory
policies and procedures for the preanalytic, analytic,
and
postanalytic testing phases. The practices and processes
to be
monitored and evaluated include:
Methods for collecting, handling, transporting,
identifying,
processing, and storing specimens.
Information provided on test request and results
report forms.
Instrument performance, quality-control protocols,
and
maintenance.
Reagent quality-control protocols.
Process for reviewing and reporting results.
Employee training and education, which should consist
of:
Basic training by flow cytometer manufacturers and
additional training in hands-on workshops for flow
cytometer
operators and supervisors.
Education of laboratory directors in flow
cytometric
immunophenotyping through workshops and other
programs.
Continuing education in new developments for all
flow
cytometric immunophenotyping personnel through
attendance at
meetings and workshops.
Adherence to federal and state regulations for
training and
education.
Assurance of satisfactory performance. Laboratories
must
successfully participate in a performance evaluation
program.
When proficiency testing programs are approved by
HCFA as
meeting the requirements of CLIA '88 (none are
currently
approved for CD4+ T-cell testing), laboratories must
satisfactorily participate.
Review and revision (as necessary, or at established
intervals)
of the laboratory's policies and procedures to assure
adherence
to the quality assurance program. All staff involved
in the
testing should be informed of any problems identified
during
the quality assurance review, and the corrective
actions should
be taken to prevent recurrences.
Document all quality assurance activities.
LABORATORY VALIDATION OF SINGLE-PLATFORM CD4+ T-CELL METHODS
When performing method-validation studies on the new
single-platform
methods for enumerating CD4+ T-cell populations, laboratorians must
consider that these assays may determine the absolute CD4+ count
using
methodologies that are very different from multi-platform
techniques. In
most clinical settings, multi-platform methods do not perform at
the
level of a gold standard. Still, the single-platform methods must
be
compared with accepted methods or testing procedures. When no
optimal
standard exists and bias is present, the amount of error
contributed by
each method cannot be determined. Therefore, if results yielded
from a
single-platform method are significantly different from those
obtained
using a multi-platform method, the new method is not necessarily in
error. Conducting a large-scale study correlating results from
single-platform methods with clinical disease data to establish new
medical decision points may be the only surrogate for comparison
with a
gold standard. Laboratories should not adopt methods that yield
results
significantly different from multi-platform methods until these
studies
can be performed, published, and accepted by the scientific and
medical
communities.
Traditional method comparison tools may be used for validation
of
single-platform methods that compare favorably with multi-platform
methods. Single-platform methods, as the name implies, derive the
absolute CD4+ T-cell counts from a single measurement and therefore
have
the potential to yield a less variable (although not necessarily
more
accurate) analysis than multi-platform methods, which utilize a
combination of hematology and flow cytometry measurements.
Laboratorians
should utilize statistical tools that provide useful information
about
these new methodologies but that do not presume that either the
comparative or test method is definitive. Linear least squares
regression
analysis must be conducted based on the assumption that no error
exists
in the comparative method, and regression-type scatter plots
provide
inadequate resolution when the errors are small in comparison to
the
analytical range (70,71). The bias scatterplot may provide
laboratorians
with a more useful tool for determining bias (Figure_4). These
simple,
high resolution graphs plot the difference in the individual
measurements
of each method (X test method - X comparative method) against those
by
one of the methods (X comparative method) (70). Such graphs provide
an
easy means of determining if bias is present and distinguishing if
bias
is systematic, proportional, or random/non-constant. The
laboratorian may
visually determine the significance of these differences over the
entire
range of values, and when sufficient values are plotted, outliers
and/or
samples containing interfering substances can be identified. The
laboratorian may then divide the data into ranges relevant to
medical
decisions and calculate the systematic error (mean of the bias),
the
random error (standard deviation of the bias), and total error (the
greatest absolute 95% error limit of the systematic error twice the
random error) to gain insight into analytical performance at the
specified decision points (70,71). Several detailed guidelines and
texts
can provide laboratorians with additional information regarding
quality
goals, method evaluation, estimation of bias, and bias scatter
plots (70-76). On
continue to monitor the correlation between the results and the
patient's
clinical disease data to ensure that no problems have gone
undetected by
the relatively few samples typically tested during method
evaluations.
DISCUSSION
On the basis of the reported number of tests performed
annually by
laboratories participating in CDC's Model Performance Evaluation
Program
for T-lymphocyte immunophenotyping in 1995, more than 1.6 million
CD4+
T-cell measurements are performed yearly by the approximately 600
testing
laboratories in the United States (77). Most of these measurements
are
made by using multi-platform flow cytometric methods, although new
single-platform methods (both flow cytometric and others) are
available
(78-85). Recommendations concerning CD4+ T-lymphocyte
immunophenotyping
have focused on the more complex multi-platform process of
measuring CD4+
T-cells. The recommendations for testing have increasingly been
adopted
(86), and as a result, laboratorians have reported improved testing
practices (86,87). Testing outcomes associated with following the
recommendations include a) increased confidence in results, b) more
reproducible results, c) increased ability to resolve discrepant
problems, d) decreased proportion of unacceptable specimens
received for
testing, e) decreased proportion of specimens requiring reanalysis,
and
f) decreased incidents that could pose biohazard risks (86).
Although data suggest that guidelines for CD4+ T-cell
lymphocyte
immunophenotyping have improved many laboratory practices,
developing
guidelines that address every aspect of CD4+ T-cell testing
(including
some laboratory-specific practices) is not possible. Moreover,
measuring
the outcomes associated with the adoption of these guidelines is
inherently difficult. First, the guidelines lack evaluation
protocols
that can adequately account for the interactions among
recommendations.
No weight of importance has been assigned for the individual
recommendations that address unique steps in the testing process;
hence,
the consequences of incompletely following the entire set of
recommendations are uncertain. Second, because published data were
not
available as the basis for every guideline, some recommendations
are
based on experience and expert opinion. Recommendations made on
this
basis, in the absence of data, may be biased and inaccurate.
Finally,
variations in testing practices and interactions among the
practices
(e.g., how specimens are obtained and processed, laboratory
personnel
credentials and experience, testing methods used, test-result
reporting
practices, and compliance with other voluntary standards and
laboratory
regulations) complicate both development of guidelines that will
fit
every laboratory's unique circumstances and measurement of the
value of
guideline implementation.
When the first CDC recommendations for laboratory performance
of
CD4+ T-cell testing were developed, the guidelines were written so
as not
to impede development of new technology or investigations into
better
ways to assess the status of the immune system in HIV-infected
persons.
Presentations at the second national conference in Atlanta
indicated that
although CD4+ T-cell testing by multi-platform flow cytometry is
still
being performed by most laboratories, other single-platform methods
are
being implemented. In addition, alternative T-cell phenotypic
markers are
being investigated as prognostic indicators or markers of treatment
efficacy, alone and in combination with other markers (88).
Participants at the second national conference emphasized the
need
for monitoring the intralaboratory and interlaboratory accuracy,
precision, and reliability of current and new procedures. Decisions
about
implementing and modifying procedures should be based on
performance data
collected to assess the extent to which the quality goals
established by
providers and users of laboratory testing services are achieved
(76). In
testing areas where no absolute gold standards exist (e.g., CD4+
T-cell
enumeration), method validation and verification processes are even
more
critical. Laboratorians should continue to rely on as many sources
of
information and data as possible to help in their decision
processes.
Factors that have contributed to improved testing practices and
that are
important resources for laboratorians include regulatory * and
voluntary
laboratory standards (29,31,32,34,89); manufacturer's
recommendations;
proficiency testing and performance evaluation program data;
information
shared at scientific conferences, meetings, and training sessions;
and
publications in scientific literature.
References
Turner BJ, Hecht FM, Ismail RB. CD4+ T-lymphocyte measures in
the
treatment of individuals infected with human immunodeficiency
virus type
1: a review for clinical practitioners. Arch Intern Med
1994;154(14):1561-73.
Fei DT, Paxton H, Chen AB. Difficulties in precise quantitation
of
CD4+ T-lymphocytes for clinical trials: a review. Biologicals
1993;21:221-31.
Hoover DR, Graham NM, Chen B, et al. Effect of CD4+ cell count
measurement variability on staging HIV-1 infection. J Acquir
Immune Defic
Syndr 1992;5:794-802.
DeWolf F, Roos M, Lange JMA, et al. Decline in CD4+ cell
numbers
reflects increase in HIV-1 replication. AIDS Res Hum
Retroviruses
1988;4:433-40.
Giorgi J, Nishanian P, Schmid I, Hultin L, Cheng H, Detels R.
Selective alterations in immunoregulatory lymphocyte subsets in
early HIV
(human T-lymphotropic virus type III/lymphadenopathy-associated
virus)
infection. J Clin Immunol 1987;7:140-50.
Lang W, Perkins H, Anderson RE, Royce R, Jewell N, Winkelstein
W Jr.
Patterns of T-lymphocyte changes with human immunodeficiency
virus
infection: from seroconversion to the development of AIDS. J
Acquir
Immune Defic Syndr 1989;2:63-9.
Masur H, Ognibene FP, Yarchoan R, et al. CD4 counts as
predictors of
opportunistic pneumonias in human immunodeficiency virus (HIV)
infection.
Ann Intern Med 1989;111:223-31.
Smith RD. The pathobiology of HIV infection. Arch Pathol Lab
Med
1990;114:235-9.
Hanson DL, Chu SY, Farizo KM, Ward JW. Distribution of CD4+
T-lymphocytes at diagnosis of acquired immunodeficiency
syndrome-defining
and other human immunodeficiency virus-related illnesses. The
Adult and
Adolescent Spectrum of HIV Disease Project Group. Arch Intern
Med
1995;155:1537-42.
Stein DS, Korvick JA, Vermund SH. CD4+ lymphocyte cell
enumeration
for prediction of clinical course of human immunodeficiency
virus
disease: a review. J Infect Dis 1992;165:352-63.
CDC. Recommendations for prophylaxis against Pneumocystis
carinii
pneumonia for adults and adolescents infected with human
immunodeficiency
virus. MMWR 1992;41(No. RR-4).
CDC. 1995 revised guidelines for prophylaxis against
Pneumocytis
carinii pneumonia for children infected with or perinatally
exposed to
human immunodeficiency virus. MMWR 1995;44(No. RR-4):1-11.
National Institutes of Health. Recommendations for Zidovudine:
early
infection. JAMA 1990;263(12):1606,1609.
Goldman AI, Carlin BP, Crane LR, et al. Response of CD4
lymphocytes
and clinical consequences of treatment using ddI or ddC in
patients with
advanced HIV infection. J Acquir Immune Defic Syndr Hum
Retrovirol
1996;11:161-9.
Graham NMH, Piantadosi S, Park LP, Phair JP, Rinaldo CR, Fahey
JL.
CD4+ lymphocyte response to Zidovudine as a predictor of
AIDS-free time
and survival time. J Acquir Immune Defic Syndr 1993;6:1258-66.
De Gruttola V, Gelman R, Lagakos S. Uses of CD4-lymphocyte
count in
AIDS treatment decisions. Infect Agents Dis 1994;2:304-13.
Fahey JL, Taylor JMG, Detels R, et al. The prognostic value of
cellular and serologic markers in infection with human
immunodeficiency
virus type 1. N Engl J Med 1990;322:166-72.
CDC. 1994 revised classification system for human
immunodeficiency
virus infection in children less than 13 years of age. Official
authorized addenda: human immunodeficiency virus infection
codes and
official guidelines for coding and reporting ICD-9-CM. MMWR
1994;43(No.
RR-12):1-19.
CDC. USPHS/IDSA guidelines for the prevention of opportunistic
infections in persons infected with human immunodeficiency
virus: a
summary. MMWR 1995;44(No. RR-8):1-34.
CDC. Recommendations for counseling persons infected with human
T-lymphotrophic virus, types I and II. Recommendations on
prophylaxis and
therapy for disseminated Mycobacterium avium complex for adults
and
adolescents infected with HIV. MMWR 1993;42(No. RR-9):17-20.
CDC. 1993 Revised classification system for HIV infection and
expanded surveillance case definition for AIDS among
adolescents and
adults. MMWR 1992;41(No. RR-17):1-35.
Nicholson JKA, Landay AL. Use of flow cytometry to enumerate
lymphocyte populations in HIV disease. In: Schochetman G,
George JR, eds.
AIDS testing: a comprehensive guide to technical, medical,
social, legal,
and management issues. 2nd ed. New York, NY: Springer-Verlag,
1994:170-95.
Keren DF, ed. Flow cytometry in clinical diagnosis. 1st ed.
Chicago:
American Society of Clinical Pathologists, 1989.
Hoffman RA, Kung PC, Hansen WP, Goldstein G. Simple and rapid
measurement of human T-lymphocytes and their subclasses in
peripheral
blood. Proc Natl Acad Sci USA 1980;77:4914-7.
Landay A, Ohlsson-Wilhelm B, Giorgi JV. Application of flow
cytometry
to the study of HIV infection. AIDS 1990;4:479-97.
Loken MR, Stall AM. Flow cytometry as an analytical and
preparative
tool in immunology. J Immunol Methods 1982;50:R85-112.
Lovett EJ, Schnitzer B, Keren DF, Flint A, Hudson JL,
McClatchey KD.
Application of flow cytometry to diagnostic pathology. Lab
Invest
1984;50:115-40.
Parks DR, Herzenberg LA. Fluorescence-activated cell sorting:
theory,
experimental optimization, and applications in lymphoid cell
biology.
Methods Enzymol 1984;108:197-241.
National Committee for Clinical Laboratory Standards. Clinical
applications of flow cytometry. Quality assurance and
immunophenotyping
of peripheral blood lymphocytes. Wayne, PA: National Committee
for
Clinical Laboratory Standards, 1992. NCCLS document no. H42-T.
Association of State and Territorial Public Health Laboratory
Directors. Report and recommendations: flow cytometry -- Sixth
Annual
Conference on Human Retrovirus Testing. Kansas City,
MO:1991;17-9.
Calvelli T, Denny TN, Paxton H, Gelman R, Kagan J. Guidelines
for
flow cytometric immunophenotyping: a report from the National
Institutes
of Allergy and Infectious Diseases, Division of AIDS. Cytometry
1993;14:702-15.
Nicholson J, Kidd P, Mandy F, Livnat D, Kagan J. Three-color
supplement to the NIAID DAIDS guideline for flow cytometric
immunophenotyping. Cytometry 1996;26:227-30.
CDC. Guidelines for the performance of CD4+ T-cell
determinations in
persons with human immunodeficiency virus infection. MMWR
1992;41(No.
RR-8):1-17.
CDC. 1994 Revised guidelines for the performance of CD4+ T-cell
determinations in persons with human immunodeficiency virus
(HIV)
infection. MMWR 1994;43(No. RR-3):1-21.
McCoy JP Jr, Blumstein L, Donaldson MH, et al. Accuracy and
cost-effectiveness of a one-tube, three-color method for
obtaining
absolute CD4+ counts and CD4:CD8 ratios. Am J Clin Pathol
1994;101:279-82.
Nicholson JK, Jones BM, Hubbard M. CD4+ T-lymphocyte
determinations
on whole blood specimens using a single-tube, three-color
assay.
Cytometry 1993;14:685-9.
CDC. Update: universal precautions for prevention of
transmission of
human immunodeficiency virus, hepatitis B virus, and other
bloodborne
pathogens in health-care settings. MMWR 1988;37:377-82,387-8.
CDC. 1988 Agent summary statement for human immunodeficiency
virus
and report on laboratory-acquired infection with human
immunodeficiency
virus. MMWR 1988;37(No. SS-4):1-22.
CDC. Recommendations for prevention of HIV transmission in
health-care settings. MMWR 1987;36(2S):S1-S18.
CDC. Acquired immunodeficiency syndrome (AIDS): precautions for
clinical and laboratory staffs. MMWR 1982;31:577-80.
CDC. Acquired immunodeficiency syndrome (AIDS): precautions for
health-care workers and allied professionals. MMWR
1983;32:450-2.
CDC. Recommendations for preventing transmission of infection
with
human T-lymphotropic virus type III/lymphadenopathy-associated
virus in
the workplace. MMWR 1985;34:681-95.
CDC and NIH. Biosafety in microbiological and biomedical
laboratories. 3rd ed. US Department of Health and Human
Services, 1993.
National Committee for Clinical Laboratory Standards.
Protection of
laboratory workers from infectious disease transmitted by
blood, body
fluids, and tissue. Wayne, PA: National Committee for Clinical
Laboratory
Standards, 1991. NCCLS document no. M29-T2.
Nicholson JKA, Browning SW, Orloff SL, McDougal JS.
Inactivation of
HIV-infected H9 cells in whole blood preparations by
lysing/fixing
reagents used in flow cytometry. J Immunol Methods
1993;160:215-8.
Cory JM, Rapp R, Ohlsson-Wilhelm BM. Effects of cellular
fixatives on
human immunodeficiency virus production. Cytometry
1990;11:647-51.
Aloisio CH, Nicholson JKA. Recovery of infectious human
immunodeficiency virus from cells treated with 1%
paraformaldehyde. J
Immunol Methods 1990;128:281-5.
Lifson JD, Sasaki DT, Engleman EG. Utility of formaldehyde
fixation
for flow cytometry and inactivation of the AIDS-associated
retrovirus. J
Immunol Methods 1986;86:143-9.
Martin LS, Loskoski SL, McDougal JS. Inactivation of human
T-lymphotropic virus type III/ lymphadenopathy-associated virus
by
formaldehyde-based reagents. Appl Environ Microbiol
1987;53:708-9.
National Committee for Clinical Laboratory Standards. Additives
to
blood collection devices: EDTA. Wayne, PA: National Committee
for
Clinical Laboratory Standards, 1989. NCCLS document no. H35-P.
National Committee for Clinical Laboratory Standards. Reference
leukocyte differential count (proportional) and evaluation of
instrumental methods. Wayne, PA: National Committee for
Clinical
Laboratory Standards, 1992. NCCLS document no. H20-A.
Paxton H, Bendele T. Effect of time, temperature, and
anticoagulant
on flow cytometry and hematological values. Ann NY Acad Sci
1993;677:440-3.
Nicholson JK, Green TA, Collaborating Laboratories. Selection
of
anticoagulants for lymphocyte immunophenotyping: effect of
specimen age
on results. J Immunol Methods 1993;165:31-5.
National Committee for Clinical Laboratory Standards.
Procedures for
the collection of diagnostic blood specimens by venipuncture.
2nd ed.
Approved Standard. Wayne, PA: National Committee for Clinical
Laboratory
Standards, 1984. NCCLS publication no. H3-A2
Shield CF III, Manlett P, Smith A, Gunter L, Goldstein G.
Stability
of human leukocyte differentiation antigens when stored at room
temperature. J Immunol Methods 1983;62:347-52.
McCoy JP, Jr, Carey JL, Krause JR. Quality control in flow
cytometry
for diagnostic pathology: 1. Cell surface phenotyping and
general
laboratory procedures. Am J Clin Pathol 1990;93 (suppl
1):S27-S37.
Ekong T, Kupek E, Hill A, Clark C, Davies A, Pinching A.
Technical
influences on immunphenotyping by flow cytometry: the effect of
time and
temperature of storage on the viability of lymphocyte subsets.
J Immunol
Methods 1993;164:263-73.
Koepke JA, Landay AL. Precision and accuracy of absolute
lymphocyte
counts. Clin Immunol Immunopathol 1989;52:19-27.
Nicholson JKA, Jones BM, Cross D, McDougal S. Comparison of T
and B
cell analysis on fresh and aged blood. J Immunol Methods
1984;73:29-40.
Weiblen BJ, Debell K, Giorgio A, Valeri CR. Monoclonal antibody
testing of lymphocytes after overnight storage. J Immunol
Methods
1984;70:179-83.
Schenker EL, Hultin LE, Bauer KD, Ferbas J, Margolick JB,
Giorgi JV.
Evaluation of a dual-color flow cytometry immunophenotyping
panel in a
multicenter quality assurance program. Cytometry
1993;14:307-17.
Knapp W, Dorken K, Gilks WR, et al., eds. Leukocyte typing IV:
white
cell differentiation antigens. Oxford: Oxford University Press,
1989.
Mercolino TJ, Connelly MC, Meyer EJ, et al. Immunologic
differentiation of absolute lymphocyte count with an integrated
flow
cytometric system: a new concept for absolute T-cell subset
determinations. Cytometry 1995;22:48-59.
Mandy FF, Bergeron M, Recktenwald D, Izaguirre CA. A
simultaneous
three-color T-cell subsets analysis with single laser flow
cytometers
using T-cell gating protocol. Comparison with conventional
two-color
immunophenotyping method. J Immunol Methods 1992;156:151-62.
Nicholson JKA, Hubbard M, Jones BM. Use of CD45 fluorescence
and
side-scatter characteristics for gating lymphocytes when using
the whole
blood lysis procedure and flow cytometry. Cytometry
1996;26:16-21.
Loken MR, Brosnan JM, Bach BA, Ault KA. Establishing optimal
lymphocyte gates for immunophenotyping by flow cytometry.
Cytometry
1990;11:453-9.
Ekong T, Gompels M, Clark C, Parkin J, Pinching A.
Double-staining
artifact observed in certain individuals during dual-colour
immunophenotyping of lymphocytes by flow cytometry. Cytometry
1993;14:679-84.
Margolick JB, Scott ER, Odaka N, Saah AJ. Flow cytometric
analysis of
gamma delta T-cells and natural killer cells in HIV-1
infection. Clin
Immunol Immunopathol 1991;58:126-38.
DePaoli P, Gennari D, Martelli P, et al. A subset of
lymphocytes is
increased during HIV-1 infection. Clin Exp Immunol
1991;83:187-91.
Kringle RO, Johnson GF. Statistical procedures. In: Tietz N,
ed.
Textbook of clinical chemistry. Philadelphia, PA: WB Saunders
Company,
1986:287-355.
Steindel SJ. Method comparison -- a new look. American Society
of
Clinical Pathologist Generalist Clinical Chemistry Tech Sample
No. G-8.
Chicago, IL, 1984.
National Committee for Clinical Laboratory Standards. Method
comparison and bias estimation using patient samples. Wayne,
PA: National
Committee for Clinical Laboratory Standards, 1995. NCCLS
publication no.
EP9-A.
National Committee for Clinical Laboratory Standards.
Preliminary
evaluation of quantitative clinical laboratory methods. 2nd ed.
Wayne,
PA: National Committee for Clinical Laboratory Standards, 1993.
NCCLS
publication no. EP10-T2.
Galen RS, Peters T, Jr. Analytical goals and clinical relevance
of
laboratory procedures. In: Tietz N, ed. Textbook of Clinical
Chemistry.
Philadelphia, PA: WB Saunders Company, 1986:387-409.
Peters Jr T, Westgard JO. Evaluation of methods. In: Tietz N,
ed.
Textbook of clinical chemistry. Philadelphia, PA:W.B. Saunders
Company,
1986:410-23.
Westgard JO, de Vos DJ, Hunt MR, et al. Concepts and practices
in the
selection and evaluation of methods. Am J Med
Technol;1978;44:290-300,420-30,552-71,727-42,803-13.
CDC. Results of the 1995 T-lymphocyte immunophenotyping
questionnaire
survey mailed to laboratories participating in the Model
Performance
Evaluation Program. Model Performance Evaluation Program
publication,
1996;16.
Nicholson JKA, Velleca WM, Jubert S, Green TA, Bryan L.
Evaluation of
alternative CD4 technologies for the enumeration of CD4
lymphocytes. J
Immunol Methods 1994;177:43-54.
Paxton H, Pins M, Denton G, McGonigle AD, Meisner PS, Phair JP.
Comparison of CD4 cell count by a simple enzyme-linked
immunosorbent
assay using the TRAx CD4 test kit and by flow cytometry and
hematology.
Clin Diag Lab Immunol 1995;2:104-14.
Denny TN, Jensen BD, Gavin EI, et al. Determination of CD4 and
CD8
lymphocyte subsets by a new alternative fluorescence
immunoassay. Clin
Diag Lab Immunol 1995;2:330-6.
Robinson JE, Blum S, Koch T. Performance of the Imagn 2000 as
compared to four color flow cytometry. Cytometry 1996;1:85(P5).
Bergeron M, Mandy F, Chabot C, et al. Spatial cytometry is an
option
available for reporting absolute CD4+ T-cell numbers. Cytometry
1996;1:85(P6).
Gertis K, Jenkins A, Folds JD. Whole blood sample stability
when
assaying CD4+ and CD8+ cells on the Imagn 2000. Cytometry
(Communications in Clinical Cytometry) 1996;1:85(P7).
Coley T, Landay A. Internal and external quality control on the
Imagn 2000. Cytometry (Communications in Clinical Cytometry)
1996;1:85(P8).
Johnson D, Hirschkorn D, Busch MP. Evaluation of four
alternative
methodologies for determination of absolute CD4+ lymphocyte
counts. The
National Heart, Lung, and Blood Institute Retrovirus
Epidemiology Donor
Study. J Acquir Immune Defic Syndr Human Retrovirol
1995;10:522-30.
Rosner E, Siragusa MT. Laboratory standardization in CD4
testing:
results of a nationwide impact evaluation study. Cytometry
(Communications in Clinical Cytometry) 1996;1:78(A1).
Harwell, TS. Are there differences between laboratories that
use or
fail to use CDC's guidelines to measure CD4+ and CD8+ T-cells?
Cytometry
1995;21:256-7.
Giorgi JV, Ho HN, Hirji K, et al. CD8+ lymphocyte activation at
human
immunodeficiency virus type 1 seroconversion: development of
HLA-DR+
CD38- CD8+ cells is associated with subsequent stable CD4+ cell
levels.
J Infect Dis 1994;170:775-81.
College of American Pathologists, Commission on Laboratory
Accreditation. Inspection checklist (Flow Cytometry, Section
11).
Northfield, Illinois: College of American Pathologists, 1996.
49 CFR parts 100-171 (56 FR 47158).
42 CFR part 493 *** 493.801-493.865.
42 CFR part 493 *** 493.801-493.865.
APPENDIX. Effects of medications and other biologic factors on
immunophenotyping results (Table_A1)
Table_1 Note:
To print large tables and graphs users may have to change their printer settings to landscape and use a small font size.
Table_2 Note:
To print large tables and graphs users may have to change their printer settings to landscape and use a small font size.
TABLE 2. Three-color monoclonal antibody panels *
=======================================================================================================================
Panel           Monoclonal antibodies                   Notes
-----------------------------------------------------------------------------------------------------------------------
A               CD3/CD4/CD45                            Gate on CD45 and side scatter; measure CD3+CD4+ T-cells

                CD3/CD8/CD45                            Gate on CD45 and side scatter; measure CD3+CD8+ T-cells

                CD3/CD19/CD45 +                         Gate on CD45 and side scatter; measure CD3+ and CD19+ T-cells


B &             CD3/CD19/CD16 and/or CD56               For absolute counts of T-, B-, and NK-cells

                CD3/CD4/CD8                             To determine CD3+, CD3+CD4+, and CD3+CD8+ cells

                Isotype control                         For nonspecific fluorescence
-----------------------------------------------------------------------------------------------------------------------
* Suggested three-color panels. (See Section VI.C.)
+ Recommended for specimens obtained from children (32).
& This panel may be used for systems determining absolute cell numbers directly from the flow cytometer.
  Percentage determinations are calculated from the absolute numbers. (See Section VI.C.2.b.)
=======================================================================================================================
Disclaimer
All MMWR HTML versions of articles are electronic conversions from ASCII text into HTML. This conversion may have resulted in character translation or format errors in the HTML version. Users should not rely on this HTML document, but are referred to the electronic PDF version and/or the original MMWR paper copy for the official text, figures, and tables. An original paper copy of this issue can be obtained from the Superintendent of Documents, U.S. Government Printing Office (GPO), Washington, DC 20402-9371; telephone: (202) 512-1800. Contact GPO for current prices.
**Questions or messages regarding errors in formatting should be addressed to mmwrq@cdc.gov.

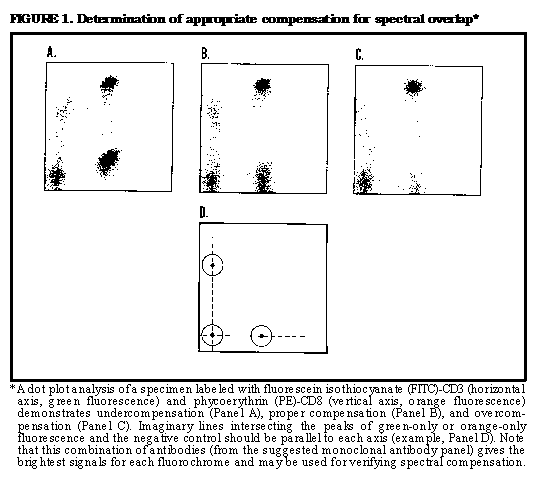