|
|
|
|
|
|
|
|
|
|
|
|
|
|
|
|
|
||||
| ||||||||||
|
|
|
|
|
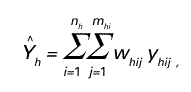
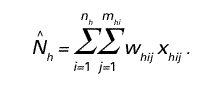
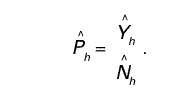
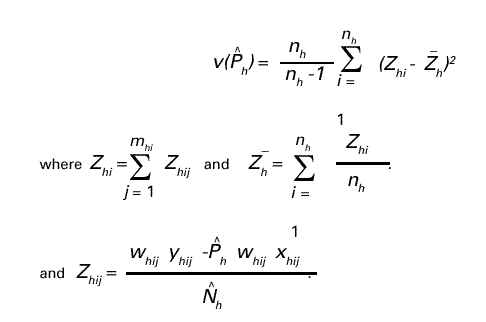
Persons using assistive technology might not be able to fully access information in this file. For assistance, please send e-mail to: mmwrq@cdc.gov. Type 508 Accommodation and the title of the report in the subject line of e-mail. National, State, and Urban Area Vaccination Coverage Levels Among Children Aged 19--35 Months --- United States, 1998Guillermo A. Herrera, M.D.1 1Assessment Branch, Division of Data Management, National Immunization Program AbstractProblem/Condition: High vaccination levels in the population are necessary to decrease disease transmission and prevent disease; therefore, an important component of the U.S. vaccination program is the assessment of vaccination coverage. Current goals are for >90% coverage with recommended vaccines during the first 2 years of life. Reporting Period: January--December 1998. Description of Systems: The National Immunization Survey (NIS) is an ongoing, random-digit--dialed telephone survey that gathers vaccination coverage data for children aged 19--35 months in all 50 states and 28 urban areas. Vaccination coverage rates derived from NIS data are adjusted statistically for households with multiple telephone lines, household nonresponse, the proportion of households without telephones, and vaccination provider nonresponse. The results were also adjusted to match the known total population of children in each survey area. Results: On the basis of NIS data, national coverage was >90% for three doses of poliovirus vaccine (Polio), three doses of Haemophilus influenzae type b vaccine (Hib), and one dose of measles-containing vaccine (MCV). Coverage was the highest ever reported for four doses of any diphtheria and tetanus toxoids and pertussis vaccine (DTP) (i.e., diphtheria and tetanus toxoids and pertussis vaccine, diphtheria and tetanus toxoids [DT], or diphtheria and tetanus toxoids and acellular pertussis vaccine [DTaP]) (83.9%), three doses of hepatitis B vaccine (Hep B, 87.0%), and one dose of varicella vaccine (43.2%). The number of states achieving the >90% goal was 47 for three doses of Hib, 40 for three doses of Polio, 40 for one dose of MCV, nine for three doses of Hep B, and seven for four doses of DTP. Proportionally fewer urban areas achieved the >90% goal: 23 of 28 for three doses of Hib, 13 for three doses of Polio, 16 for one dose of MCV, five for three doses of Hep B, and one for four doses of DTP. No state or urban area has yet achieved the >90% goal for varicella. Interpretation: Findings from the 1998 NIS indicate that national vaccination coverage levels for routinely recommended childhood vaccines are at the highest levels ever reported. However, substantial variation in coverage remains at the state and urban area levels. Public Health Actions: The public health community and vaccination providers in areas with low coverage should intensify their efforts to implement recommended strategies for increasing vaccination coverage to ensure that children are equally well protected throughout the United States. INTRODUCTIONSustained high vaccination levels in the population are necessary to decrease transmission and prevent occurrence of childhood diseases. Therefore, an important component of the U.S. vaccination program is the assessment of vaccination coverage (1). In 1993, the Childhood Immunization Initiative (CII) was launched, setting >90% coverage goals by 1996 for the following vaccinations: three doses of diphtheria and tetanus toxoids and pertussis vaccine/diphtheria and tetanus toxoids, three doses of polio vaccine (Polio), three doses of Haemophilus influenzae type b vaccine (Hib), one dose of measles/mumps/rubella vaccine (MMR), and three doses of hepatitis B vaccine (Hep B) --- the Hep B >90% goal was set for 1998 (2). Vaccination objectives were also included in the Healthy People 2000 initiative, which is a national effort to improve the health of U.S. residents during the decade preceding the year 2000 (3). With the exception of three doses of HepB, the >90% coverage goals have been achieved and maintained since 1996 through the widespread implementation of the strategies of the CII by public- and private-sector organizations and health-care providers at the national, state, and local levels (4). Healthy People 2010 objectives also propose >90% coverage goals for new vaccines (e.g., varicella) within 5 years of universal recommendations. In the United States, the National Immunization Survey (NIS) is the primary source of vaccination coverage data. In 1998, the NIS assessed vaccination coverage among children born during February 1995--May 1997 (i.e., aged 19--35 months; median age: 27 months). This report presents national trends in coverage for each of the routinely recommended childhood vaccines for 4 consecutive years, 1995--1998. For the first time, data presented include coverage among children living below poverty level by state and selected urban area. Vaccination coverage data for each antigen by race/ethnicity are also presented. METHODSThe NIS is an ongoing random-digit--dialed (RDD) telephone survey that gathers data about children aged 19--35 months for each of the 50 states and 28 urban areas. The NIS collects data in two stages. During the first stage, an RDD sample of telephone numbers is selected and called. When a household with age-eligible children is contacted, the interviewer collects information about the vaccinations received by all age-eligible children in that household. In 1998, 1,027,866 households were contacted by phone; of these, 34,480 had children that met the age-eligibility criteria. Among households contacted with eligible children, 31,664 (91.8%) completed the telephone survey, providing demographic, vaccination, and other information about 32,511 children. During the second stage, all vaccination providers of sample children for whom consent was obtained during the telephone interview were contacted by mail. In 1998, vaccination information from providers' records was obtained for 21,649 (68.4%) households, providing adequate information about 21,827 children (67.1%). A two-stage estimation procedure --- reflecting the two stages of data collection (i.e., household telephone interview and vaccination provider mail survey) --- has been used to estimate vaccination coverage in the NIS since its inception in 1994. Specifically, the first stage of the NIS estimation method uses data collected from the households and weighting adjustments to account for households with multiple telephone lines, household nonresponse, and the exclusion of households without telephones. The second stage uses the number and type of vaccines reported by the vaccination provider and adjustment for provider nonresponse. The second stage concludes by adjusting the demographic distribution of participant children to match the known total population of children in each survey area (5). In the 1994--1997 survey years, the use of the child's vaccination record (sometimes referred to as the "shot card") and the child's up-to-date status for the 4:3:1:3 combined series (receipt of four doses of any diphtheria and tetanus toxoids and pertussis vaccine [DTP] [i.e., diphtheria and tetanus toxoids and pertussis vaccine, diphtheria and tetanus toxoids (DT), or diphtheria and tetanus toxoids and acellular pertussis vaccine (DTaP)], DTP, three doses of Polio, one dose of MCV, and three doses of Hib) and three doses of Hep B were used to group children into categories predictive of up-to-date status for the weighting adjustments. Next, the proportion of children up to date within each of these categories was calculated based on provider reports. The adjustment factors were applied to the entire NIS sample to estimate vaccination coverage representative of all children surveyed --- not only those with provider data. Over time, the percentage of children with provider data increased from 51% in 1995 to 67% in 1998. This increase enabled modification of the original NIS adjustment for provider nonresponse. Beginning with the 1998 survey year, the method for estimating vaccination coverage was modified. The new method used to obtain vaccination coverage rates from the 1998 NIS is based on identifying groups of sampled children who are similar in their propensity to have provider data. Then the survey weights of children with provider data within each group are adjusted by dividing them by the group-specific weighted response rate (6). Using the propensity score methodology, 46 of the 50 state estimates for the 4:3:1:3 combined series were within 1.5 percentage points of the estimates obtained using the original methodology (5,6). The vaccination coverage estimates and estimates of standard errors were calculated using SUDAAN statistical software and the Taylor series expansion (see Appendix for specific estimation formula) (7,8). Guidelines from CDC's National Center for Health Statistics (NCHS) regarding minimum standards for sample size and precision were applied to this analysis. The standard of reliability is RSE <0.3 (where RSE = the ratio of the standard error and the prevalence). Estimates that do not meet this standard or with a numerator <30 are not presented. RESULTSIn 1998, vaccination coverage with three doses of Polio, three doses of Hib, and one dose of MCV was >90% each; coverage with four doses of DTP and three doses of Hep B was the highest ever reported (83.9% and 87.0%, respectively). Coverage with varicella vaccine (which was first recommended in 1996) also was the highest ever reported (43.2%) (Table 1). During 1995--1998, coverage with four doses of DTP increased from 78.5% to 83.9%. Coverage with three doses of Polio increased from 87.9% in 1995 to 91.1% in 1996 and has remained at high levels (>90%) through 1998. Similarly, coverage with three doses of Hib was 91.7% in 1995 and has remained at high levels through 1998. Coverage with one dose of MCV has been high since 1995 (89.9%), increasing by 2.2 percentage points to 92.1% in 1998. Since their addition to the recommended childhood vaccination schedule, large increases in coverage were observed for three doses of Hep B and varicella vaccine; coverage with three doses of Hep B increased 19 percentage points during 1995--1998 (from 68.0% in 1995 to 87.0% in 1998), and coverage with varicella increased 17.3 percentage points in 1 year (from 25.9% in 1997 to 43.2% in 1998). During 1995--1998, coverage with the 4:3:1 (receipt of four doses of DTP, three doses of Polio, and one dose of MCV) and the 4:3:1:3 combined series increased 4.4 and 5.0 percentage points, respectively; at least half of this increase occurred during the 1997 and 1998 survey years. In 1998, the vaccine-specific differences in coverage between the states with the highest and lowest coverage were 19 percentage points for four doses of DTP, 12 percentage points for three doses of Polio, 11 percentage points for one dose of MCV, 10 percentage points for three doses of Hib, 16 percentage points for three doses of Hep B, and 47 percentage points for varicella vaccine (Figure 1, Table 2). Similar patterns in vaccine-specific differences were observed among urban areas (Figure 2, Table 3). The number of states that achieved the >90% CII coverage goal was highest for three doses of Hib (47 of 50), three doses of Polio (40), and one dose of MCV (40); in contrast, only nine states achieved >90% coverage for three doses of Hep B and seven states for four doses of DTP. No state achieved the >90% goal for varicella. In general, the relative proportion of urban areas that achieved these two goals was lower: 23 of 28 for three doses of Hib, 13 for three doses of Polio, 16 for one dose of MCV, five for three doses of Hep B, one for four doses of DTP and none for varicella. For the combined series, only one state achieved the >90% goal for the 4:3:1 and 4:3:1:3 combined series; one urban area achieved the goal for 4:3:1, and none achieved the goal for 4:3:1:3. At the national level, the differences in coverage among children in different racial/ethnic groups varied by vaccine, from 4.4 percentage points (MCV) to 24.6 percentage points (varicella vaccine) (Table 4). In general, coverage levels among non-Hispanic black, Hispanic, and American Indian/Alaskan Native children were lower than levels among children in other racial/ethnic groups. At the national level, differences in coverage between the approximately 22% of children living below poverty level (who participated in NIS in 1998) and all children also varied by vaccine, from 0.9 percentage points (three doses of Polio) to 4.4 percentage points (four doses of DTP). At the state and urban area levels, vaccination coverage and the proportion of children living below poverty level also varied (Tables 5 and 6). DISCUSSIONFindings from the 1998 NIS indicate that national coverage levels for routinely recommended childhood vaccines are at the highest levels ever reported. However, substantial variation in coverage remains at the state and urban area levels. Of the 50 states, the number that did not achieve the >90% coverage goals for four doses of DTP, three doses of Hep B, three doses of Polio, and one dose of MCV is 43, 41, 10, and 10, respectively. Of the 28 urban areas monitored by NIS, the number that did not achieve the >90% coverage goals for four doses of DTP, three doses of Hep B, three doses of Polio, and one dose of MCV is 27, 23, 15, and 12, respectively. Together, the public health community and vaccination providers in areas with low coverage should intensify their efforts to implement recommended strategies for increasing vaccination coverage to ensure that children throughout the United States are equally well protected. Increases in coverage were documented for three doses of Hep B since 1995 and for varicella vaccine since 1997. Substantial increases in Hep B coverage were observed during 1994--1995 (from 37% to 68%) (3); after varicella vaccine was recommended in 1997, coverage increased from 26% in 1997 to 43% in 1998. In 1998, only children born after mid-1996 were eligible for varicella vaccine; these data were not adjusted for history of varicella illness. Continued monitoring of vaccination coverage levels will help to identify areas of the United States that need increased vaccination efforts. In areas where coverage continues to be low, communities should implement recommended strategies to increase coverage, such as reminder/recall systems, reduction of out-of-pocket costs for vaccines, and assessment and feedback of provider-based coverage levels (AFIX) (9). The findings in this report are subject to at least four limitations. First, the survey was designed to produce vaccination coverage estimates for the nation, the 50 states, and 28 selected urban areas. As a result, small differences between estimated yearly vaccination coverage levels for the states or urban areas cannot be detected. Second, the sample size of the NIS is not sufficiently large to provide precise coverage estimates for subgroups (e.g., children living in poverty for each state or urban area). Third, because the NIS is a telephone survey and vaccination coverage is lower among children in nontelephone households, data are adjusted based on the National Health Interview Survey (NHIS) to account for the exclusion of nontelephone households (10). Fourth, vaccination coverage in this report might be overestimated because estimates from the NIS are calculated using only the data from children with provider-validated vaccination histories. These children might be better vaccinated than children without provider data. However, estimates are adjusted for provider nonresponse (6). Consequently, this bias should not have a large impact on coverage estimates. Although the 1998 CII goal of >90% coverage with three doses of Hep B was not achieved, coverage with three doses of Hep B increased steadily during 1996--1998, probably as a result of efforts to increase the availability of Hep B during the mid-1990s. In addition to the previously mentioned strategies, coverage with three doses of Hep B might be increased by increasing provider and parental awareness regarding the reasons for vaccinating infants, by passing state laws requiring vaccination for day care and school entry, and by linking vaccine assessment and referral with the Special Supplemental Nutrition Program for Women, Infants, and Children (WIC) (11). The findings in this report highlight the overall increases in coverage with routinely recommended vaccines during 1995--1998 among children aged 19--35 months. In addition, the disparities in coverage between white and black children aged 19--35 months have also changed over time. (Note: The 1993 NHIS results identified only "White", "Black", and "Other" racial/ethnic groups and did not include varicella vaccine.) In 1993, the gap in coverage by race was greatest for three doses of Hib (57.0% among whites versus 44.8% among blacks) and smallest for four doses of DTP (73.0% among whites versus 69.2% among blacks) (12). However, comparing 1998 data for non-Hispanics whites and non-Hispanics blacks, the coverage gap for four doses of DTP (86.6% versus 77.3%) was substantially greater than those for all the other vaccines. Coverage data for the other vaccines analyzed in 1998 indicate that the differences in coverage levels were similar (for three doses of Hib, 4.9 percentage points, for three doses of Hep B, 4.6 percentage points; for one dose of MCV, 4.4 percentage points; and for three doses of Polio, 4.4 percentage points). Socioeconomic status might account for some of the race/ethnicity-specific differences in vaccination coverage in this report because poverty is a risk factor for undervaccination and the distribution of poverty varies among racial/ethnic groups (13,14). In addition, the varying proportions of children living below poverty level might be associated with the state- and urban area-specific variation in vaccination coverage. Each community, urban area, and state should assess the possible role of poverty in accounting for their respective vaccination coverage levels. For areas with coverage levels still below the >90% target levels, strategies that eliminate out-of-pocket costs (9) and address organizational, personal, and attitudinal barriers confronted by families living below poverty level might be most effective (15). References
Table 1 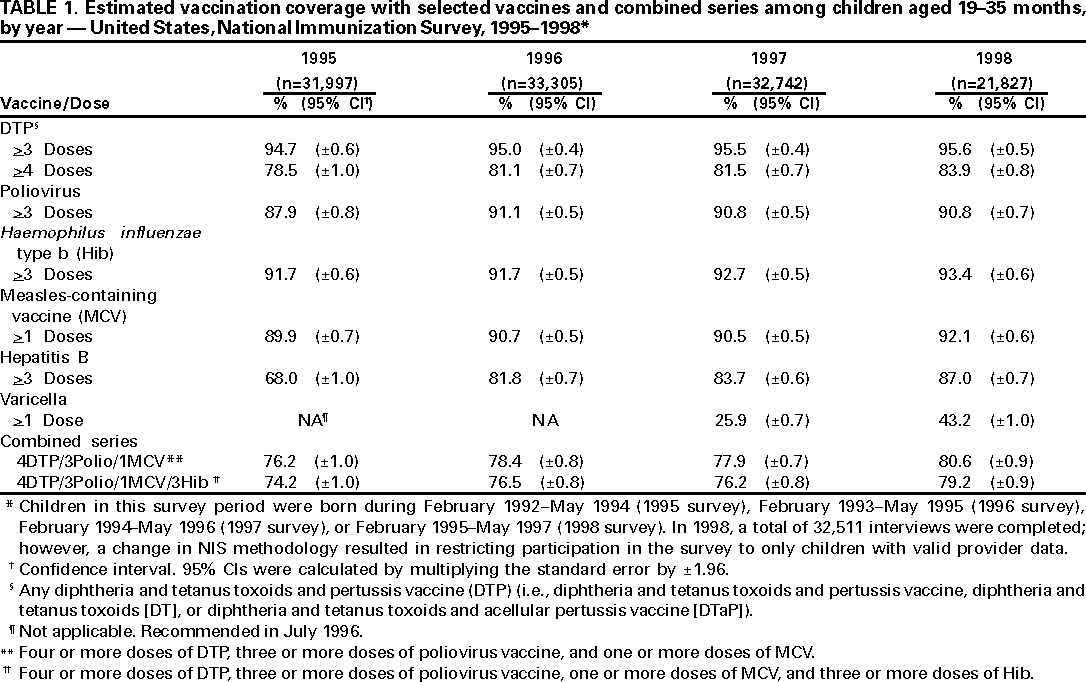 Return to top. Table 2 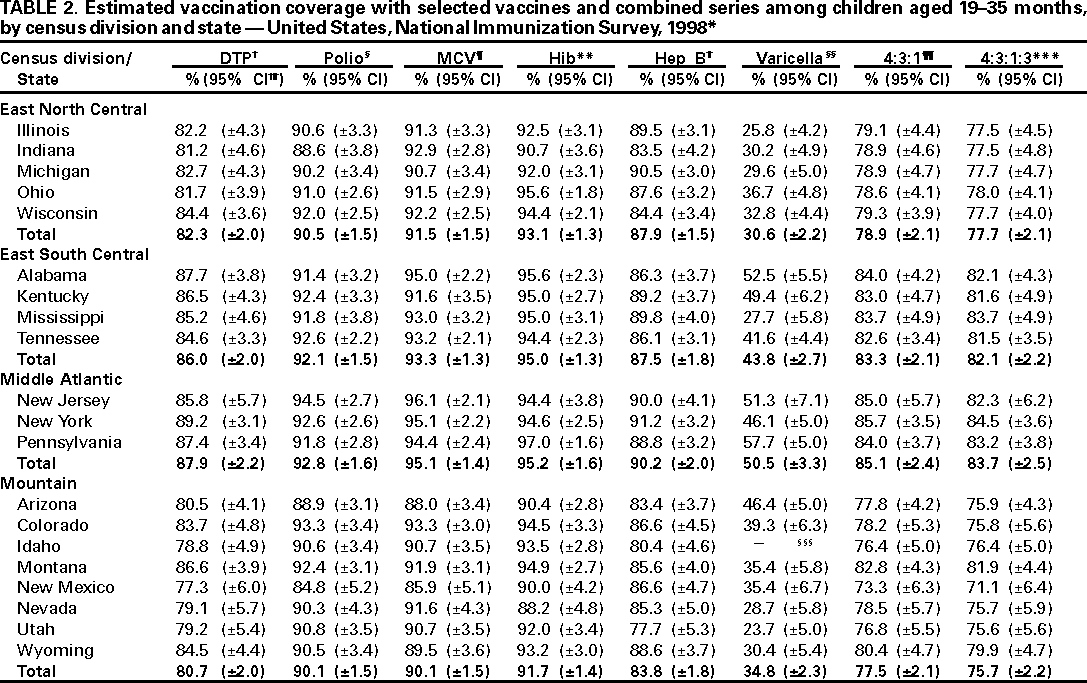 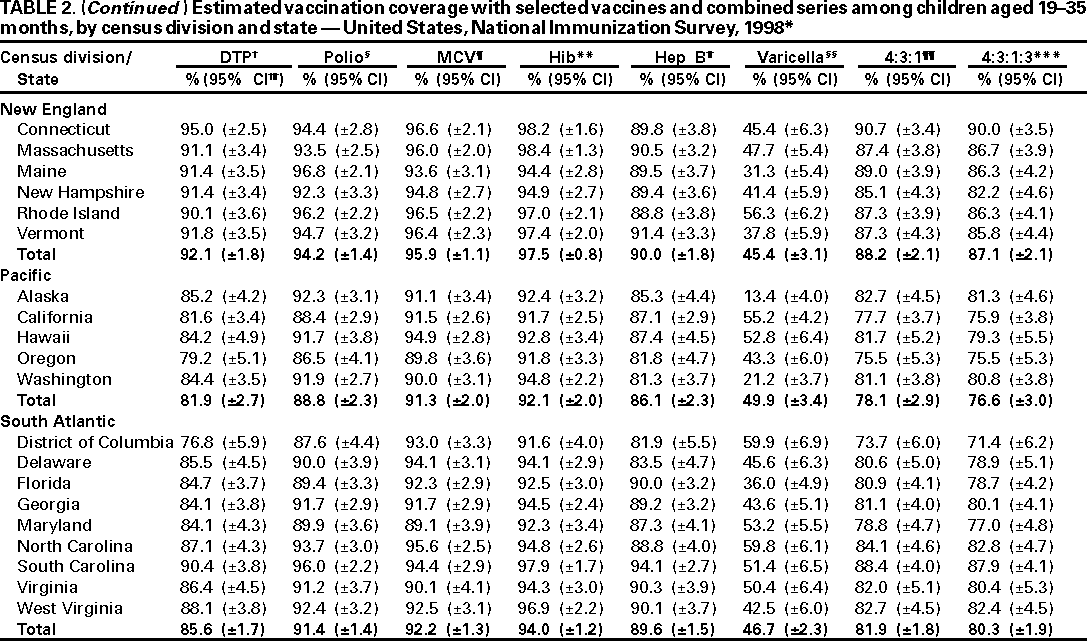 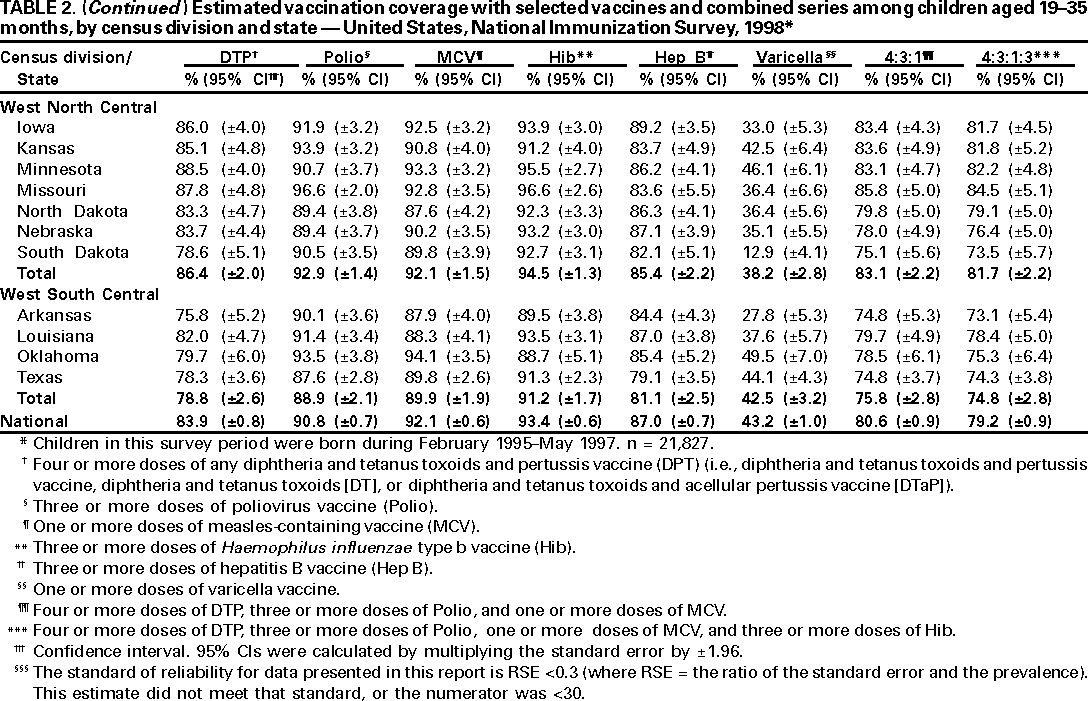 Return to top. Table 3 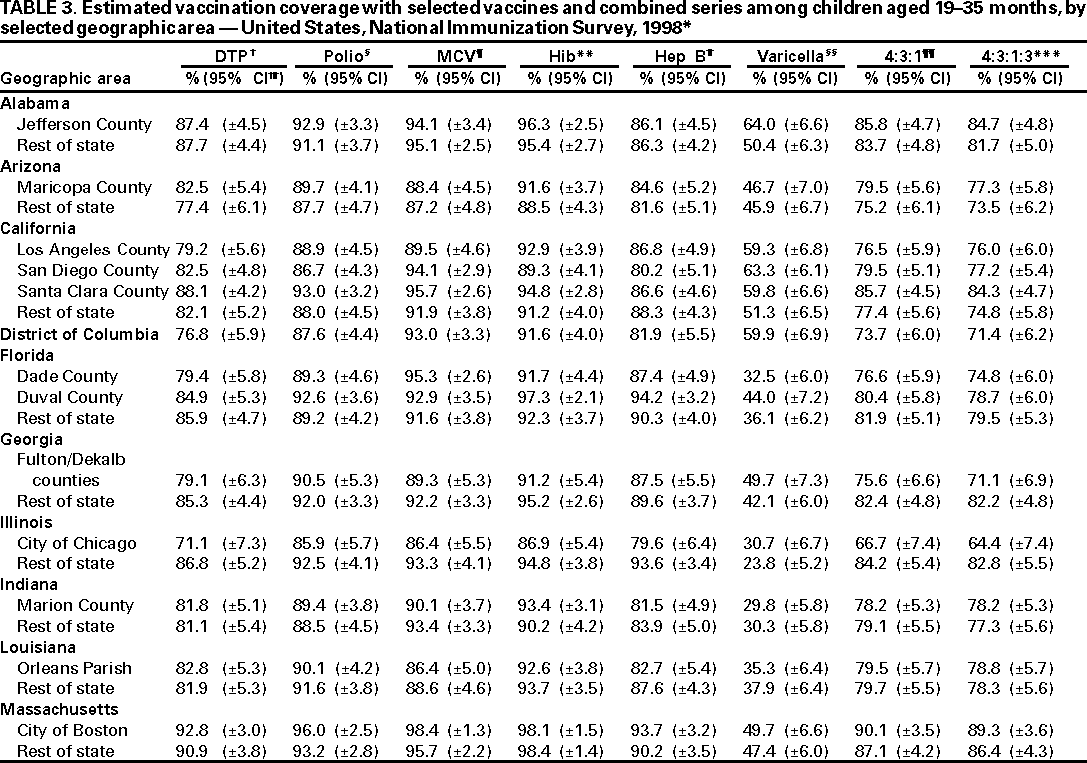 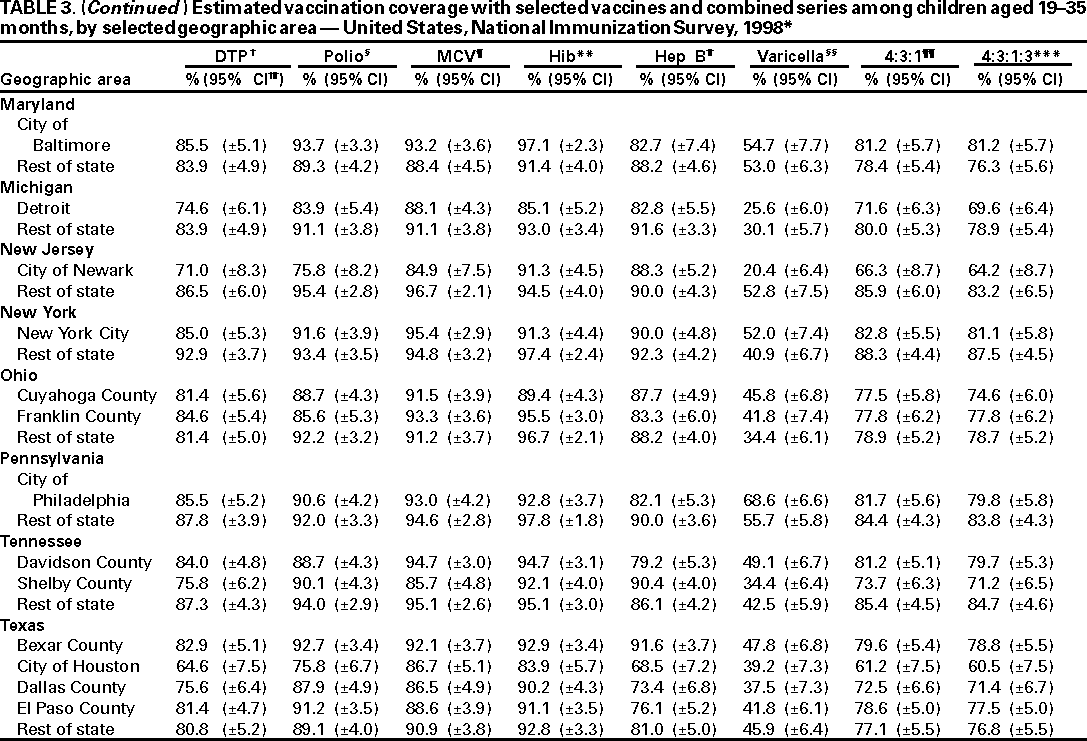 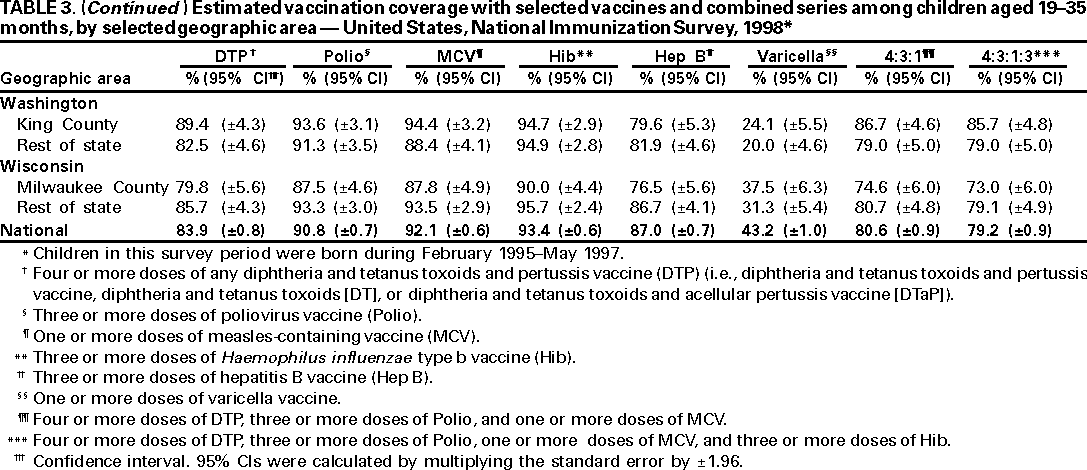 Return to top. Table 4 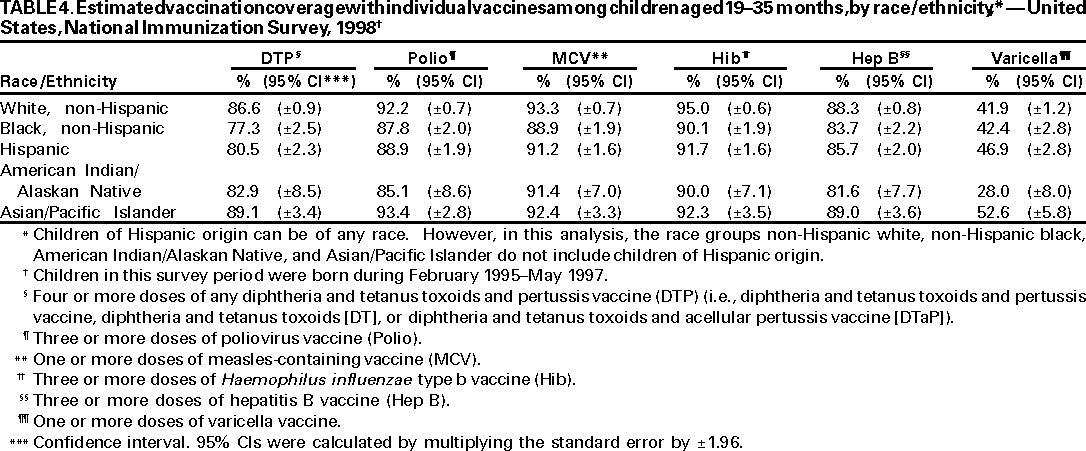 Return to top. Table 5 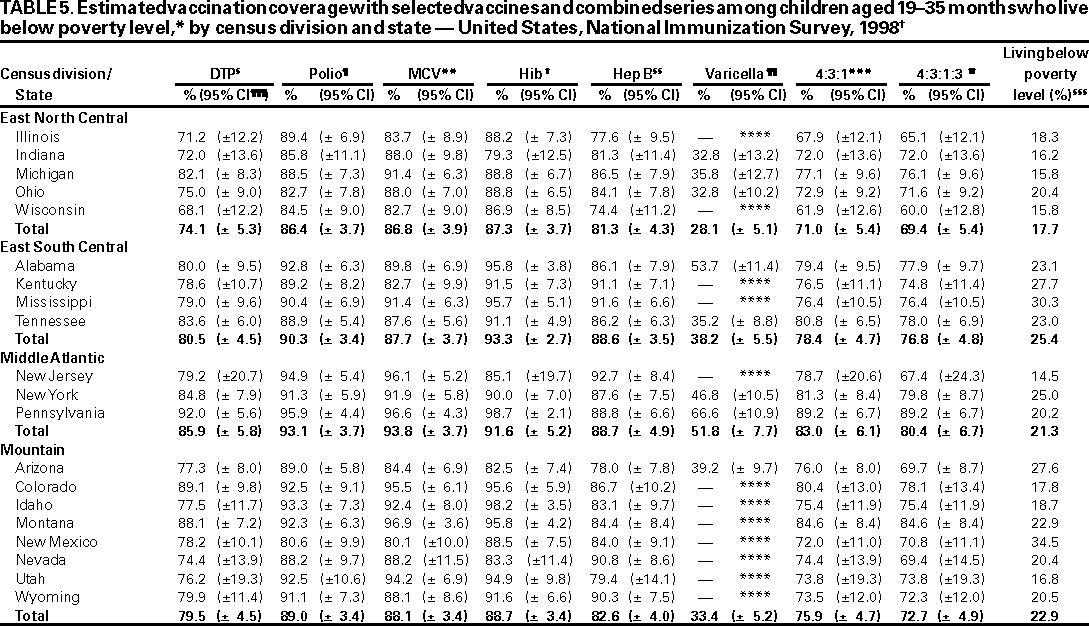 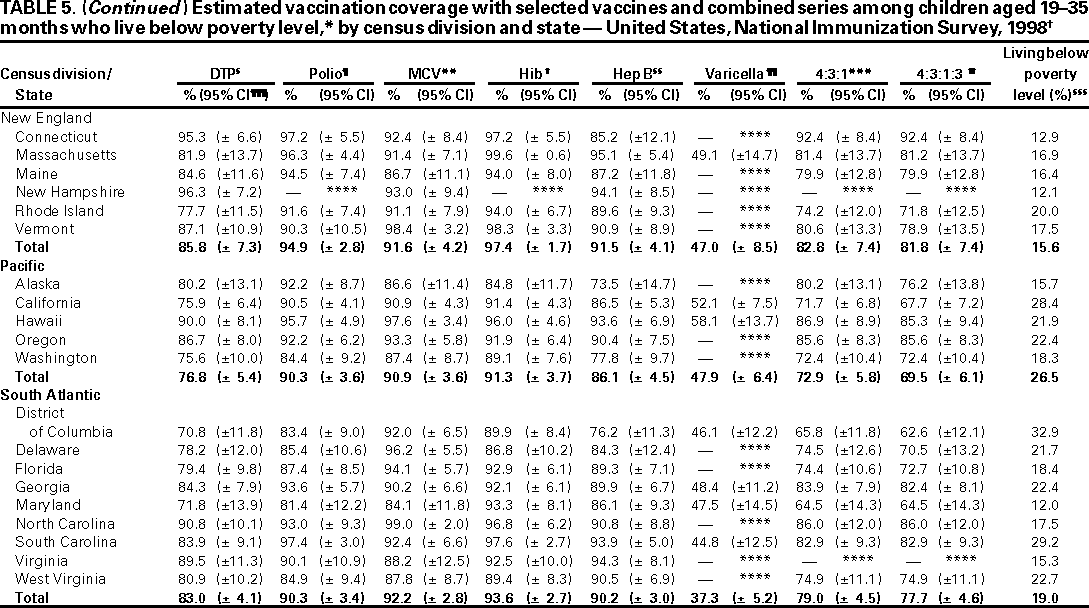 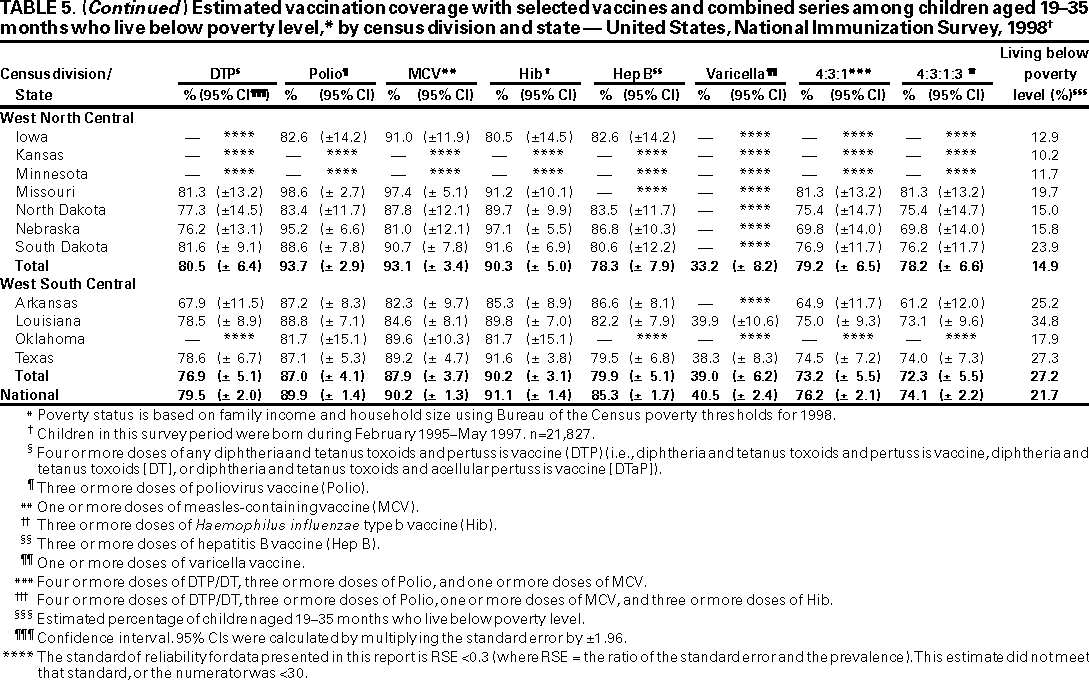 Return to top. Table 6 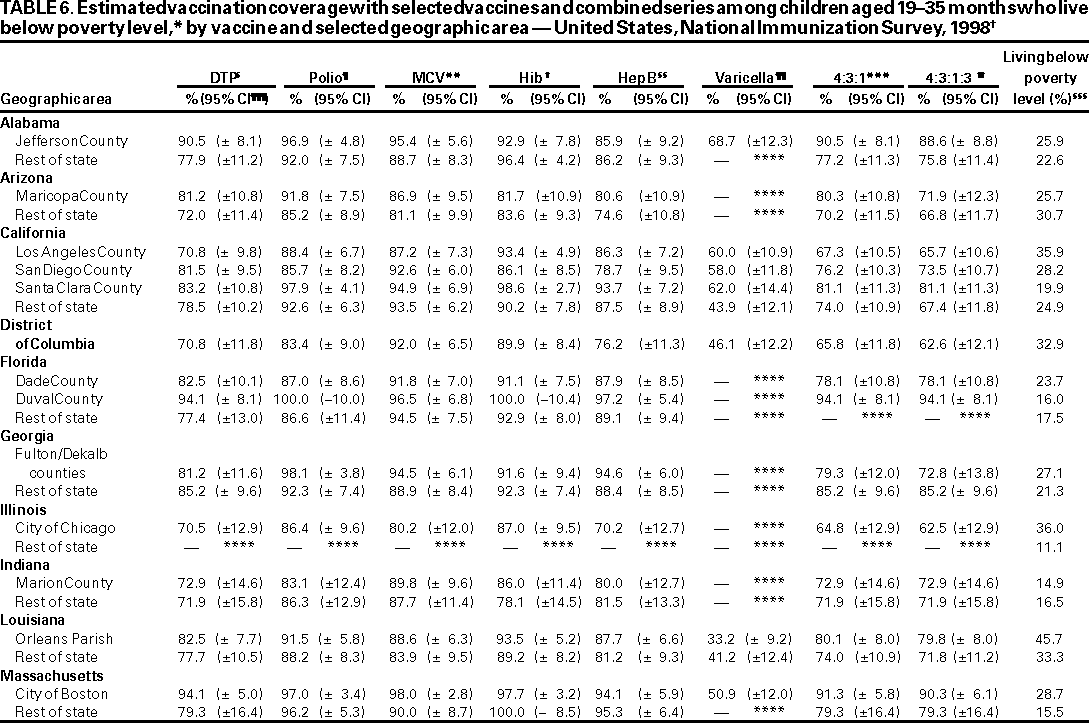 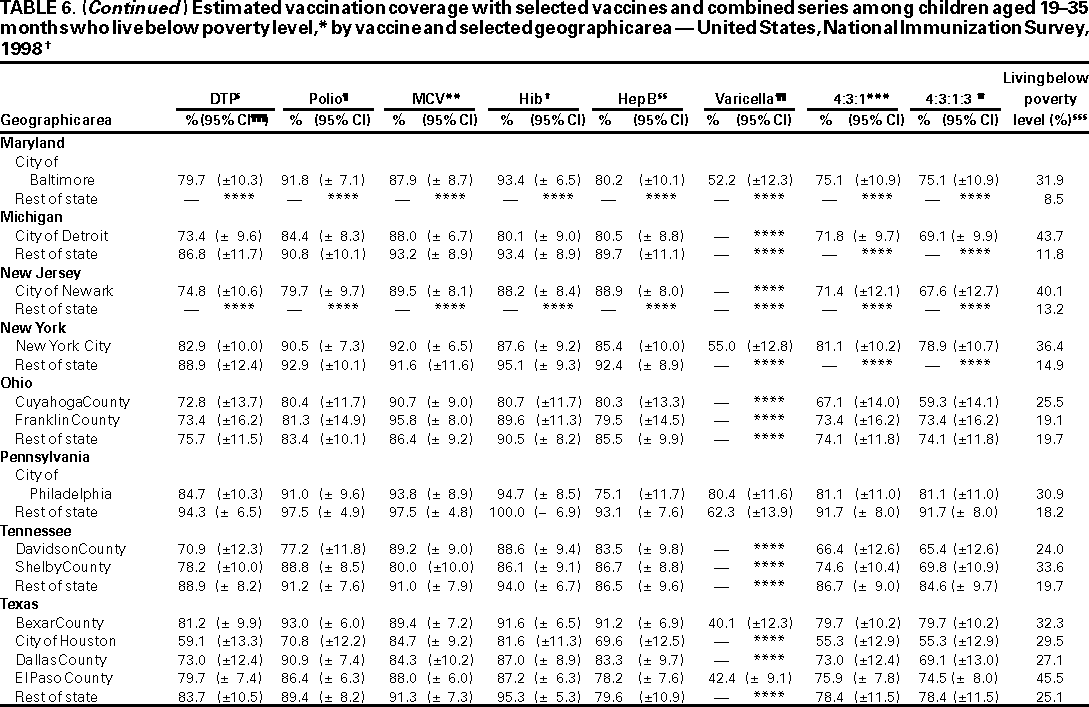 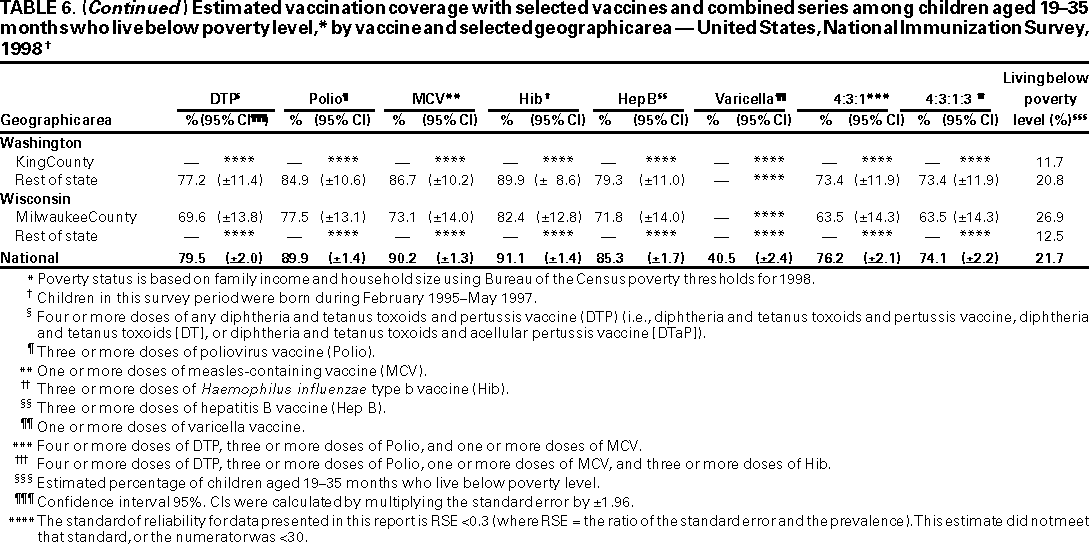 Return to top. Figure 1 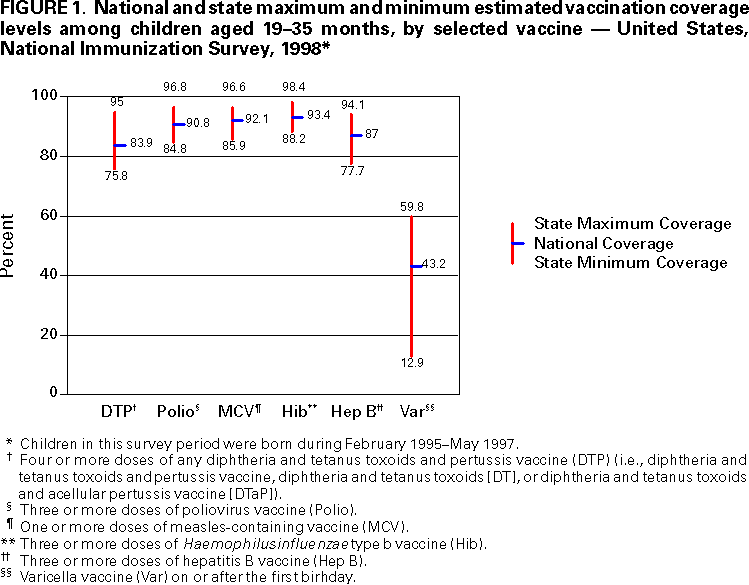 Return to top. Figure 2 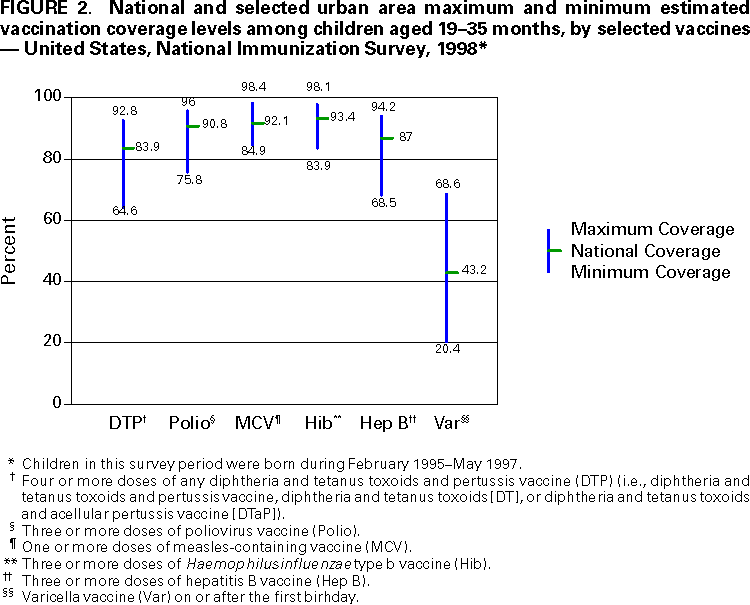 Return to top. AppendixVariance Estimation Using SUDAANThe design option assumed sampling with replacement within a geographic area; sampling probabilities were constant within a geographic area but varied among geographic areas. The household was the primary sampling unit. The procedure described below was used to estimate the variance of the proportion of children up to date with a specific vaccine or combined series (e.g., the 4:3:1:3 combined series, which comprises four doses of any diphtheria and tetanus toxoids and pertussis vaccine [i.e, diphtheria and tetanus toxoids and pertussis vaccine, diphtheria and tetanus toxoids, or diphtheria and tetanus toxoids and acellular pertussis vaccine]; three doses of poliovirus vaccine; one dose of measles-containing vaccine; and three doses of Haemophilus influenzae type b vaccine). Let whij be the final weight attached to child j with vaccination provider data in household i in geographic area h. Let yhij take the value 1 if the jth child in the ith household in the hth area is up to date with the 4:3:1:3 combined series; otherwise let yhij take the value 0. Let xhij take the value 1 for every eligible child with provider data. Let mhi represent the number of eligible children with provider data in household i in area h. The estimated number of children up to date with the 4:3:1:3 combined series in area h is given by
where nh is the number of households with eligible children and with provider data. The estimated total number of eligible children in area h is given by
The estimated proportion of children up to date with the 4:3:1:3 combined series in area h is given by
The variance of
The linearized variable Zhij is defined on page 5 in the technical manual. All MMWR HTML versions of articles are electronic conversions from ASCII text into HTML. This conversion may have resulted in character translation or format errors in the HTML version. Users should not rely on this HTML document, but are referred to the electronic PDF version and/or the original MMWR paper copy for the official text, figures, and tables. An original paper copy of this issue can be obtained from the Superintendent of Documents, U.S. Government Printing Office (GPO), Washington, DC 20402-9371; telephone: (202) 512-1800. Contact GPO for current prices. **Questions or messages regarding errors in formatting should be addressed to mmwrq@cdc.gov.Page converted: 9/12/2000 |
|||||||||
This page last reviewed 5/2/01
|