Volume
7: No. 4, July 2010
Diana G. Redwood, MS, MPH; Anne P. Lanier, MD, MPH; Janet M. Johnston, PhD; Elvin D. Asay, MS; Martha L. Slattery, PhD
Suggested citation for this article: Redwood DG, Lanier AP, Johnston JM, Asay ED, Slattery ML. Chronic disease risk factors among Alaska Native
and American Indian people, Alaska, 2004-2006. Prev Chronic Dis 2010;7(4):A85. http://www.cdc.gov/pcd/issues/2010/jul/09_0168.htm. Accessed [date].
PEER REVIEWED
Abstract
Introduction
The Alaska Education and Research Towards Health (EARTH) Study is being conducted to determine the prevalence of clinically measured chronic disease risk factors in a large population of American Indian/Alaska Native
people (AI/AN). We report these estimates and compare them with those for the overall US population, as assessed by the National Health and Nutrition Examination Survey (NHANES).
Methods
We measured blood pressure, height, weight, and fasting serum lipids and glucose in a prospective cohort of 3,822 AI/AN participants who resided in Alaska during 2004 through 2006. We categorized participants as having chronic disease risk factors if their measurements exceeded cutoffs that were determined on the basis of national recommendations. We analyzed the prevalence of risk factors by sex and age and compared the age-adjusted prevalence with 1999-2004 NHANES measurements.
Results
EARTH participants were significantly more likely than NHANES participants to be overweight or obese and to have impaired fasting glucose, low high-density lipoprotein cholesterol, high low-density lipoprotein cholesterol, and hypertension. The prevalence of high total cholesterol and triglycerides was not significantly different between the 2 study populations.
Conclusion
We provide baseline clinical measurements for chronic disease risk factors for a larger study sample than any previous study of AI/AN living in Alaska. The prevalence of most risk factors measured exceeded national rates. These data can be used to tailor health interventions and reduce health disparities.
Back to top
Introduction
Alaska Native people are a heterogeneous population; more than 200 federally recognized tribes are widely dispersed in rural and urban areas across the state. The prevalence of chronic diseases is higher among tribal communities than among other US racial/ethnic minority populations, and the
associated mortality is higher than among US non-Hispanic whites (1,2). Alaska Native people experience lower mortality from diabetes and heart disease than do other US racial/ethnic minority populations but higher
mortality from cerebrovascular diseases and malignant neoplasms (2). Heart disease, cerebrovascular disease, chronic obstructive pulmonary disease, chronic liver disease, and diabetes are 5 of the 10 leading causes of death among Alaska Native people (1). Additionally, the prevalence of risk factors such as tobacco use and obesity is higher among Alaska Native than non-Native Alaska residents (3).
American Indian and Alaska Native people (AI/AN) are generally not included in national surveys that monitor health status, or the numbers are too small to draw meaningful conclusions. Data, when available, are typically from telephone surveys and are self-reported. Few studies have collected data for AI/AN from clinical measurements, and those that have focused largely on a specific disease, age group, or geographic area (4-6). No data are available to indicate the prevalence of measured
clinical risk factors from a large population of AI/AN. Thus, it is unclear whether the prevalence of selected clinical risk factors is the same for AI/AN as for other populations.
The Alaska Education and Research Towards Health (EARTH) Study is a prospective cohort study of predominately Alaska Native people (95% AN, 5% AI) who reside in the state. It is designed to examine the effects of lifestyle and clinical risk factors on the development of chronic diseases. The objective of our analysis was to report measured clinical data for blood pressure, height, weight, and fasting serum lipids and glucose among EARTH participants and to compare the prevalence of elevated
risk in this population with that of all US racial/ethnic populations assessed by the National Health and Nutrition Examination Survey (NHANES).
Back to top
Methods
Study population
We have described the methods of the EARTH Study in detail elsewhere (7). We recruited participants from southwest (Yukon-Kuskokwim Delta), southeast (Panhandle), and southcentral (Anchorage area) Alaska. Eligibility criteria included being aged 18 years or older, being AI/AN and eligible for health care through the Indian Health Service, residing in the study area, and being able to provide informed consent. Methods of recruitment included presentations to tribal groups and health care
providers, informational tables staffed by study personnel at community events, house-to-house recruiting, brochures and flyers in public locations, and public service announcements on local radio and in newspapers. The Alaska Area Institutional Review Board, the Indian Health Service
Institutional Review Board, the regional tribal health organizations, and the tribal councils of participating study communities approved the study.
We summarize data collected from 3,822 participants in 26 Alaska communities from March 2004 through August 2006. We asked pregnant women and chemotherapy patients to participate at a later date. On the basis of 2000 AI/AN census data for each community, participation ranged from 2% to 49% of eligible adults; the median participation rate was 29%.
Measurement and outcomes
EARTH participants completed self-administered and interviewer-administered questionnaires on demographics, diet, physical activity, lifestyle and cultural practices, environmental exposures, cancer-screening practices, medical and reproductive history, and family history of chronic diseases. Computer-assisted questionnaires on touch-screen panels were used with an audio version of the questionnaires in English or Yupik (8). In the questionnaires, we asked participants if a health care
provider had ever told them that they had specific chronic diseases. All participants were included in the analysis even if they had a self-reported medical history of hypertension, diabetes, or dyslipidemia.
We measured serum lipids and glucose, seated blood pressure, and standing height, weight,
and waist circumference. We report the measurement methods in detail elsewhere (7,9,10). We asked study participants to fast for 9 hours before their study visit to meet requirements for triglyceride and glucose measurements. Only participants who reported fasting for 9 hours or more were measured for serum lipids and glucose. We gave participants who enrolled but had not fasted the option of completing the
visit except for the blood test and returning at a later date to complete the blood test.
We based the clinical risk factor categories on recommendations from the National Cholesterol Education Program, the American Diabetes Association,
and the Joint National Committee on Prevention, Detection, Evaluation, and
Treatment of High Blood Pressure (11-13). Specifically, we used the following definitions: hypertension (≥140 mm Hg systolic or ≥90 mm Hg diastolic), prehypertension (120-139 mm Hg systolic or 80-89 mm Hg diastolic), high serum cholesterol
(≥200 mg/dL), high low-density lipoprotein (LDL) cholesterol (≥130 mg/dL), low high-density lipoprotein
(HDL) cholesterol (<40 mg/dL), high triglycerides (≥150 mg/dL), overweight (body mass index [BMI] 25.0-29.9 kg/m2), obesity (BMI ≥30.0 kg/m2), extreme obesity (BMI ≥40.0 kg/m2), abdominal obesity (waist circumference >102 cm for men and >88 cm for women), and high fasting plasma glucose (3 risk
categories: 100-109 mg/dL, 110-125 mg/dL, and >125 mg/dL).
Statistical analysis
We computed basic summary statistics to provide an overview of the study sample compared with all AI/AN in Alaska (2000 US census data) (14,15). To determine the prevalence of the selected clinical risk factors in the study population, we transformed continuous data into risk categories and calculated 95% confidence intervals (CIs). We determined the percentage of participants who exceeded cutoff levels separately for men and women aged 18 to 39 years, 40 to 59 years, and 60
years or older. Age and sex differences for all risk factors were calculated using logistic regression, and all analyses were conducted using SPSS
version 16 for Windows (IBM, Chicago, Illinois). Significance was set at P < .05.
For comparison with NHANES, only data for EARTH participants aged 20 years or older were included (n = 3,568). EARTH data were age-adjusted by the direct method to 2000 census data estimates using 5 age groups: 20 to 34, 35 to 44, 45 to 54, 55 to 64, and 65 years or older (16). We obtained 1999-2004 NHANES data for all US racial/ethnic groups from published sources for comparison (16-20). In addition to testing for nonoverlapping 95% CIs, we used the methods described by Dever (18) for
calculating critical values to test for difference in rates between the observed rate (EARTH) and a standard rate (NHANES). All differences that had nonoverlapping CIs were significantly different according to the Dever method.
Back to top
Results
Most participants were women (61%), had at least a high school education (77%), were unmarried (57%), were unemployed (55%), and rated their health status as good or better (75%)
(Table 1). More than
33% of participants reported speaking either their native language
only or both their native language and English in the home. The most common ethnicities reported were Yupik, Cupik, or Inupiaq Eskimo (62%), followed by Southeast Alaska Indian (Haida, Tlingit, Tsimshian) (29%), Athabaskan
(10%), Aleut (9%), and American Indian (5%) (participants could report more than 1 ethnicity). Eight percent of participants reported that they were of native descent, tribe unknown. Demographic characteristics were similar to those of census-generated estimates for AI/AN residing in Alaska, but EARTH participants reported lower income, higher unemployment, and lower health status.
The most common risk factor overall among men was prehypertension (49%)
(Table 2). For men aged 40 to 59 years, high serum cholesterol was the most common risk factor (49%), and for men aged 60 years or older, abdominal obesity was the most common risk factor (57%). The most common risk factor among women was abdominal obesity (70%); this was true across all age groups but was highest among women aged 60 years or older.
The age-adjusted odds of hypertension, prehypertension, high LDL cholesterol, overweight, and the 100
to 109 mg/dL glucose risk category were significantly higher among men than women
(Table 3). The higher risk categories for blood glucose (≥110 mg/dL) were not significantly associated with sex after adjusting for age. The odds of
obesity and extreme obesity were significantly higher among women than men. For most risk factors, sex-adjusted prevalence increased significantly with age. The rates of
overweight and extreme obesity were not significantly associated with age after adjusting for sex.
The prevalence of low HDL and high LDL cholesterol was higher among EARTH participants than among NHANES participants but did not differ significantly for high total cholesterol or triglycerides (Figure 1). Additionally, the prevalence of overweight, obesity, impaired fasting glucose, and hypertension were significantly higher among EARTH participants than among NHANES participants (Figure 2). The prevalence of overweight and obesity among AI/AN women in the EARTH Study was particularly high (78%)
compared with all races/ethnicities from NHANES (66%).
Figure 1. Age-adjusted prevalence of dyslipidemia for Alaska EARTH Study participants, 2004-2006, compared with Alaska NHANES participants, 1999-2004. Error bars represent
95% confidence intervals. Direct age standardization is based on the 2000 census standard population for adults aged 20 years or older using age groups 20 to 34 years, 35 to 44 years, 45 to 54 years, 55 to 64 years, and 65 years or older. Clinical risk factor categories for EARTH Study participants
are based on
recommendations from the National Cholesterol Education Program (11). Clinical risk factor categories for NHANES participants
are based on Health, United States, 2007 (16), Hyre et al (19), and Kuklina et al (20). Abbreviations: EARTH, Education and Research Towards Health; NHANES, National Health and Nutrition Examination Survey; LDL, low-density lipoprotein; HDL, high-density lipoprotein.
[A tabular version of this figure is also
available.]
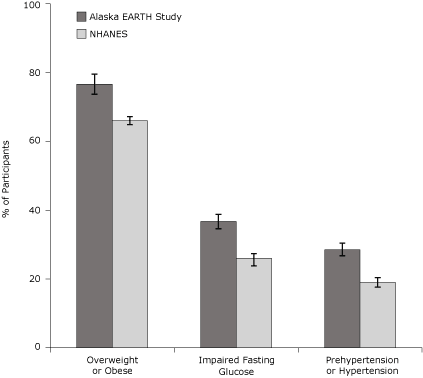
Figure 2. Age-adjusted prevalence of clinical risk factors for Alaska EARTH Study participants, 2004-2006, compared with Alaska NHANES participants, 1999-2004. Error bars represent
95% confidence intervals. Direct age standardization is based on the 2000 census standard population for adults aged 20 years or older using age groups 20 to 34 years, 35 to 44 years, 45 to 54 years, 55 to 64 years, and 65 years or older. Clinical risk factor categories for EARTH Study participants
are based on
recommendations from the American Diabetes Association and the Joint National Committee on Prevention, Detection, Evaluation, and Treatment of High Blood Pressure (12,13). Clinical risk factor categories for NHANES participants
are based on Health, United States, 2007 (16) and Cowie et al (17). Abbreviations: EARTH, Education and Research Towards Health; NHANES, National Health and Nutrition Examination Survey.
[A tabular version of this figure is also
available.]
Back to top
Discussion
This study provides detailed results of selected clinical risk measurements
from almost 4,000 AI/AN adults living in both rural and urban areas of Alaska.
We document high prevalence of chronic disease risk factors in this population and differences between this population and the US overall population on the basis of NHANES data. The prevalence of most risk factors in the Alaska study group increased with age and was more common among men than women, except for overweight and
obesity.
The overall prevalence of hypertension (men, 13%; women, 11%) was the lowest among the risk factors measured in this study. However, 28% to 49% of participants had prehypertension. The prevalence of hypertension among EARTH participants was significantly higher than among NHANES participants for all races/ethnicities. The Strong Heart Study reported that in nondiabetic American Indian participants aged 45
to 74 years, prehypertension increased the likelihood of cardiovascular events
by 80%
compared with their normotensive counterparts (21). Similar results were reported by the Framingham Heart Study (22).
The overall prevalence of high cholesterol among EARTH participants was 40%. The prevalence of low HDL and high LDL
cholesterol among EARTH participants was higher than among NHANES participants. Historically, Alaska Natives subsisted on wild foods such as fish and marine mammals, which provided healthful fats. However, most Alaska Natives are now more sedentary and have transitioned to a mixed traditional and Western diet, and the high prevalence of dyslipidemia is likely to continue (23,24).
The prevalence of overweight and obesity also was high among EARTH participants (women, 78%; men, 68%). A similar trend held for abdominal obesity. Although obesity was virtually nonexistent in Alaska before European explorations (25), studies of Alaska Natives in remote villages in the 1960s through 1980s documented a steady increase in the percentage of the population aged 40 years or older who weighed 14 kg (30 lb) above the average for
whites of the same age, height, and sex (26).
These trends are similar to other AI/AN populations living in the contiguous United States. A review of data from the Indian Health Service Diabetes Care and Outcomes Audit found that BMI was consistently higher among women than men in all age groups and among younger AI/AN adults and that the prevalence of extreme obesity was increasing (27). Among EARTH participants, the prevalence of extreme obesity was also higher in women than men, particularly younger women.
Short-term studies indicate that approximately 25% of people with impaired fasting glucose (IFG) progress to diabetes (28), and with longer observation, up to 70% appear to develop diabetes (29). NHANES age-adjusted data indicate the prevalence of IFG to be approximately 26% nationally (17), whereas EARTH age-adjusted IFG prevalence was 37%. As found in other studies, the prevalence of IFG increased with age among study participants and was higher among men than women.
This study has several limitations. First, analysis was based on a convenience sample that included more women than men. However, when possible, we report sex-specific data. The age, education, and marital status of participants were similar to those reported in the 2000 census for AI/AN living in Alaska. Second, lipids and glucose were measured with a fingerstick blood sample using the Cholestech LDX (Cholestech, Hayward, California), a method that may not be directly comparable with the
NHANES laboratory method. However, studies have shown good correlation of lipid values measured
by the Cholestech LDX and those from serum obtained from venous blood samples (10,30). In addition, the EARTH Study adhered to quality control standards, including staff training, procedure manuals, logs, and site visits, to assure consistent data collection. Finally, the EARTH Study did not assess the use of medications for hypertension and dyslipidemia, which may have influenced lipid and blood
pressure values.
We have documented the high prevalence of chronic disease risk factors among AI/AN living in Alaska and noted differences compared with the general US population. Measurements for a substantial proportion of study participants were outside of normal ranges but below the cutoff for clinical diagnosis. Studies are needed to determine the effect of these risk factors on chronic disease incidence in AI/AN populations. These data can be used to prioritize health promotion and disease prevention
activities at the local and regional levels to reduce health disparities among Alaska Native populations.
Back to top
Acknowledgments
This study was funded by grants CA88958 and CA96095 from the National Cancer Institute. We acknowledge the contributions and support of the Indian Health Service, the Alaska Native Tribal Health Consortium
board of directors, the Southcentral Foundation, the Southeast Alaska Regional Health Consortium, and the Yukon-Kuskokwim Health Corporation.
Back to top
Author Information
Corresponding Author: Diana G. Redwood, MS, MPH, Alaska Native Tribal Health Consortium Community Health Services, 4000 Ambassador Dr, Anchorage, AK 99508. Telephone: 907-729-3959; E-mail:
dredwood@anthc.org.
Author Affiliations: Anne P. Lanier, Janet M. Johnston, Elvin D. Asay, Alaska Native Tribal Health Consortium, Anchorage, Alaska; Martha
L. Slattery, University of Utah, Salt Lake City, Utah.
Back to top
References
- Day G, Provost E, Lanier A. Alaska Native mortality update: 1999-2003. Anchorage (AK): Office of Alaska Native Health Research and Alaska Native Epidemiology Center; 2006.
- Regional differences in Indian health: 2002-2003. Bethesda (MD): US Department of Health and Human Services, Indian Health Service; 2008.
- Alaska Native health status report. Anchorage (AK): Alaska Native Tribal Health Consortium; 2009.
- Welty TK, Lee ET, Yeh J, Cowan LD, Go O, Fabsitz RR, et al.
Cardiovascular disease risk factors among American Indians. The Strong Heart Study. Am J Epidemiol 1995;142(3):269-87.
- Howard BV, Devereux RB, Cole SA, Davidson M, Dyke B, Ebbesson SO, et al.
A genetic and epidemiologic study of cardiovascular disease in Alaska natives (GOCADAN): design and methods. Int J Circumpolar Health 2005;64(3):206-21.
- Mohatt GV, Plaetke R, Klejka J, Luick B, Lardon C, Bersamin A, et al.
The Center for Alaska Native Health Research Study: a community-based participatory research study of obesity and chronic disease-related protective and risk factors. Int J Circumpolar Health 2007;66(1):8-18.
- Slattery ML, Schumacher MC, Lanier AP, Edwards S, Edwards R, Murtaugh M, et al.
A prospective cohort of American Indian and Alaska Native people: study design, methods, and implementation. Am J Epidemiol 2007;166(5):606-15.
- Edwards SL, Slattery ML, Murtaugh MA, Edwards RL, Bryner J, Pearson M, et al.
Development and use of touch-screen audio computer-assisted self-interviewing in a study of American Indians. Am J Epidemiol 2007;165(11):1336-42.
- White WB, Anwar YA.
Evaluation of the overall efficacy of the Omron office digital blood pressure HEM-907 monitor in adults. Blood Press Monit 2001;6(2):107-10.
- Cobbaert CBG, Lindemans J.
Evaluation of the Cholestech L.D.X. desktop analyser for cholesterol, HDL-cholesterol, and triacylglycerols in heparinized venous blood. Eur J Clin Chem Clin Biochem 1994;32(5):391-4.
- Executive
summary of the third report of the National Cholesterol Education Program (NCEP) Expert Panel on Detection, Evaluation, and Treatment of High Blood Cholesterol in Adults (Adult Treatment Panel III). JAMA 2001;285(19):2486-97.
- American Diabetes Association:
clinical practice recommendations 2002. Diabetes Care 2002;25 Suppl 1:S1-147.
- Chobanian AV, Bakris GL, Black HR, Cushman WC, Green LA, Izzo JL Jr, et al.
The seventh report of the Joint National Committee on Prevention, Detection, Evaluation, and Treatment of High Blood Pressure: the JNC 7 report. JAMA 2003;289(19):2560-72.
- Census 2000 data for 539 tribes. http://factfinder.census.gov/home/aian/sf_aian.html. Accessed March 22, 2010.
- Behavioral Risk Factor Surveillance System, 2005. Centers for Disease Control and Prevention. http://apps.nccd.cdc.gov/brfss/.
Accessed April 1, 2010.
- Health, United States, 2007 with chartbook on trends in the health of Americans. Hyattsville (MD): National Center for Health Statistics, US Department of Health and Human Services; 2007.
- Cowie CC, Rust KF, Byrd-Holt DD, Eberhardt MS, Flegal KM, Engelgau MM, et al.
Prevalence of diabetes and impaired fasting glucose in adults in the U.S. population: National Health And Nutrition Examination Survey 1999-2002. Diabetes Care 2006;29(6):1263-8.
- Dever GEA. Managerial epidemiology: practice, methods and concepts. Sudbury (MA): Jones and Barlett Publishers, Inc; 2006.
- Hyre AD, Muntner P, Menke A, Raggi P, He J.
Trends in ATP-III-defined high blood cholesterol prevalence, awareness, treatment and control among US adults. Ann Epidemiol 2007;17(7):548-55.
- Kuklina EV, Yoon PW, Keenan NL.
Trends in high levels of low-density lipoprotein cholesterol in the United States, 1999-2006. JAMA 2009;302(19):2104-10.
- Zhang Y, Lee ET, Devereux RB, Yeh J, Best LG, Fabsitz RR, et al.
Prehypertension, diabetes, and cardiovascular disease risk in a population-based sample: the Strong Heart Study. Hypertension 2006;47(3):410-4.
- Qureshi AI, Suri MF, Kirmani JF, Divani AA, Mohammad Y.
Is prehypertension a risk factor for cardiovascular diseases? Stroke 2005;36(9):1859-63.
- Murphy NJ, Schraer CD, Theile MC, Boyko EJ, Bulkow LR, Doty BJ, et al.
Hypertension in Alaska Natives: association with overweight, glucose intolerance, diet and mechanized activity. Ethn Health 1997;2(4):267-75.
- Redwood DG, Ferucci ED, Schumacher MC, Johnson JS, Lanier AP, Helzer LJ, et al.
Traditional foods and physical activity patterns and associations with cultural factors in a diverse Alaska Native population. Int J Circumpolar Health 2008;67(4):335-48.
- Michael HN, editor. Lieutenant Zagoskin’s travels in Russian America, 1842-1844. Translation from Russian sources, No. 7. Toronto, Ontario (CA): University of Toronto Press; 1967.
- Murphy NJ, Schraer CD, Bulkow LR, Boyko EJ, Lanier AP.
Diabetes mellitus in Alaskan Yup'ik Eskimos and Athabascan Indians after 25 yr. Diabetes Care 1992;15(10):1390-2.
- Wilson C, Gilliland S, Moore K, Acton K. The epidemic of extreme obesity among American Indian and Alaska Native adults with diabetes. Prev Chronic Dis 2007;4(1).
http://www.cdc.gov/pcd/issues/2007/jan/06_0025.htm. Accessed March 17, 2010.
- Stern MP, Williams K, Haffner SM.
Identification of persons at high risk for type 2 diabetes mellitus: do we need the oral glucose tolerance test? Ann Intern Med 2002;136(8):575-81.
- Nathan DM, Davidson MB, DeFronzo RA, Heine RJ, Henry RR, Pratley R, et al.
Impaired fasting glucose and impaired glucose tolerance: implications for care. Diabetes Care 2007;30(3):753-9.
- Shemesh T, Rowley KG, Shephard M, Piers LS, O’Dea K.
Agreement between laboratory results and on-site pathology testing using Bayer DCA2000+ and Cholestech LDX point-of-care methods in remote Australian Aboriginal communities. Clin Chim Acta 2006;367(1-2):69-76.
Back to top
