
|
|
Volume 4: No.
4, October 2007
ORIGINAL RESEARCH
Physical Activity Patterns Among Latinos in the United States: Putting the Pieces Together
Sandra A. Ham, MS, Michelle M. Yore, MPH, Judy Kruger, PhD, Gregory W. Heath, DHSc, MPH, Refilwe Moeti, MA
Suggested citation for this article: Ham SA, Yore MM, Kruger J, Heath GW, Moeti
R. Physical activity patterns among Latinos in the United States: putting
the pieces together. Prev Chronic Dis 2007;4(4).
http://www.cdc.gov/pcd/issues/2007/
oct/06_0187.htm. Accessed [date].
PEER REVIEWED
Abstract
Introduction
Estimates of participation in physical activity among Latinos are inconsistent
across studies. To obtain better estimates and examine possible reasons for
inconsistencies, we assessed 1) patterns of participation in various categories of physical activity among Latino adults, 2) changes in their activity patterns with acculturation, and 3) variations in their activity patterns by region of origin.
Methods
Using data from four national surveillance systems (the National Health and Nutrition Examination Survey, 1999–2002; the Behavioral Risk Factor Surveillance System, 2003; the National Household Travel Survey, 2001; and the National Health Interview Survey Cancer Supplement, 2000), we estimated the percentage of Latinos who participated at least once per week in leisure-time, household,
occupational, or transportation-related physical activity, as well as in an active pattern of usual daily activity.
We reported prevalences by acculturation measures and region of origin.
Results
The percentage of Latinos who participated in the various types of physical
activity ranged from 28.7% for having an active level of usual daily activity
(usually walking most of the day and usually carrying or lifting objects) to
42.8% for participating in leisure-time physical activity at least once per
week. The percentage who participated in leisure-time and household activities
increased with acculturation, whereas the percentage who participated in
occupational and transportation-related activities decreased with acculturation.
Participation in an active level of usual daily activity did not change
significantly. The prevalence of participation in transportation-related
physical activity and of an active level of usual daily activity among Latino immigrants varied by region of origin.
Conclusion
Physical activity patterns among Latinos vary with acculturation and region of origin. To assess physical activity levels in Latino communities, researchers
should measure all types of physical activity and the effects of acculturation on each
type of activity.
Back to top
Introduction
Although Latinos living in the United States generally have a lower socioeconomic profile than
do non-Latino whites, their health status is generally better, a discrepancy often referred to as the “Hispanic paradox” (1,2). Furthermore, the prevalence of chronic conditions (e.g., cardiovascular diseases, diabetes, hypertension, obesity) and risky health behaviors (e.g., smoking,
substance abuse, poor diet) among Latino immigrants tends to increase as they become acculturated into U.S. society, even as their access to health care services (e.g., cancer screenings) tends to improve (1-3). Most reports show acculturation to be associated with increased rates of participation in physical activity (PA)
(2,4-6), although at least one shows it to be associated with a decrease (3). In
addition, study results show that rates of death, the prevalence of chronic conditions, and PA patterns among Latinos may vary by ethnic subgroup (which in the studies cited were defined as Mexican, Puerto Rican, Cuban, and “other Latino origin”) (5,7).
Regular PA is important for preventing chronic diseases (e.g., coronary heart disease, stroke, type 2 diabetes, breast cancer, colon cancer), disabling conditions (e.g., arthritis, osteoporosis), and risk factors for chronic diseases (e.g., obesity, hypertension, high cholesterol) (8). Latinos are the most physically inactive racial/ethnic group in the United States despite an increase in
their level of leisure-time PA during the past decade (9-11). Given that they are also the fastest growing group in the United States (12), their low rate of participation in PA is a public health concern. According to the Centers for Disease Control and Prevention (CDC) and the American College of Sports Medicine, adults should engage in a total of at least 30 minutes per day of
moderate-intensity PA (in increments of at least 10 minutes) on most or all days of the week for overall health benefits (13). PA includes leisure-time activities such as sports and other exercise, as well as occupational activities, transportation-related activities such as walking or bicycling to work, and household activities such as yard work and heavy cleaning. Lifestyle PA refers to the
total amount of activity in all four domains (leisure, occupational, transportation-related, household).
Most reports that use national health survey data to describe activity patterns among Latinos are inadequate in scope.
For example, two focus solely on Mexican Americans (4,5), many have limited detail about
the subjects’ country of origin (2,3,6,9-11), and others describe activity in only one PA domain (2,4,7,9,11) or describe PA levels for a combination of domains without specifying
levels of participation in individual domains (5). We found only one study that measured mean hours per week of participation in multiple PA domains by Latinos and that provides separate assessments by domain (6). We found no studies that determine Latino participation rates for each PA domain or whether acculturation-related changes in Latinos’ participation rates in some domains (e.g.,
leisure time) are associated with acculturation-related changes in their rate of participation in other PA domains.
For our analyses, we used national survey data collected by the National Health and Nutrition Examination Survey (NHANES) (14), the Behavioral Risk Factor Surveillance System (BRFSS) (15), the National Household Transportation Survey (NHTS)
(16), and the National Health Interview Survey (NHIS) Cancer Supplement (17).
Because each of the surveys collected data on a
different PA domain or set of domains, we were able to provide a more complete view of PA among Latinos than we could have by using data from any single survey.
In this paper, we describe patterns of PA among Latino adults who reside in the United States,
by demographic and acculturation measures and by country of origin. We report
the prevalence of PA in four domains among Latinos: leisure-time PA
and household PA from the NHANES, occupational PA from the BRFSS, and
transportation-related PA from the NHTS, as well as a usual daily activity
pattern from the NHIS, which included both walking and strengthening PA. Survey data included participants’ birthplace, country of origin
or ancestry, and proxy acculturation measures such as age at immigration, length of time in the United States, and language ability and preference. We report results by various demographic factors, proxy acculturation
measures, and country of origin.
Back to top
Methods
Although the PA survey questions in the four surveillance systems that we used as our data sources were different from one another, whenever possible we used demographic, socioeconomic, geographic, and acculturation measures that were common to multiple systems. We selected measures to provide the maximum detail that was available for each PA domain and
for acculturation from existing survey data
from 1999 through 2003. Measures of combined domains and less detailed measures
from these data sources were not used.
Data sources and PA measures
NHANES is a household interview and examination survey of the health and
nutrition status of civilian, noninstitutionalized U.S. residents of all ages
(14). From 1999 through 2002, data were collected for 11,441 adults aged 18
years or older. Response rates for the survey interview were 81.9% for 1999–2000
and 83.9% for 2001–2002. For our analysis, 1999–2002 NHANES data for 2854 Mexican
American adults were used to estimate rates of participation in
leisure-time PA and household PA. We excluded from our analyses three respondents who did not answer the
leisure-time PA questions and six who did not answer the household PA questions. Although NHANES data for 595 Latinos of other national origins were available, we excluded these
because the NHANES sample was designed to represent all Mexican Americans rather than all Latinos living in the United States. Participants reported any
leisure-time PA or household PA that they had engaged in for at least 10 minutes during the previous 30 days. The NHANES defined
leisure-time PA as any moderate or vigorous leisure-time activity (e.g., sports, exercise, recreation, gardening, yard work) and
household PA as
any task in or around the home or yard requiring moderate or greater physical effort (e.g., raking leaves, mowing the lawn, heavy cleaning). For this study, we defined
leisure-time PA and household PA as participation in an activity on at least four occasions during the previous 30 days. We included gardening and yard work that was reported as
leisure-time PA in the leisure-time measure because leisure-time questions in the NHIS and the BRFSS
have typically included gardening and yard work (15,17).
BRFSS collects data through annual random-digit–dialed, state-based telephone surveys of health risk behaviors among the U.S. civilian, noninstitutionalized population aged 18 years or older (15). In 2003, data were collected for 264,684 adults in the 50 states, the District of Columbia, Puerto Rico, Guam, and the U.S. Virgin Islands. The
median state response rate was 53.2%. We analyzed BRFSS occupational PA data on 14,798 Latino participants in the 50 states and the District of Columbia after excluding 56 participants with unknown employment status and 303 who did not respond to the
occupational PA survey question. BRFSS respondents were asked whether their activities at work involved mostly sitting or standing, mostly walking, or mostly heavy labor or
physically demanding work. Those who reported working in an occupation that involved mostly walking or mostly heavy labor or physically demanding work were classified as participating in
occupational PA. Those who reported either that they currently were not working (e.g., students, the unemployed, those who were retired or unable to work) or that they mostly sat or stood at work were classified as not
participating in occupational PA.
NHTS collects data on daily and
long-distance travel by the U.S. civilian, noninstitutionalized population (16).
We used data from March 2001 through May 2002 from 160,758 NHTS participants in 69,817 households who recorded their travel trips using 24-hour travel diaries. Survey respondents, who were randomly selected with the use of a multistage
random-digit–dial sampling frame, completed an initial household interview and a second interview to report their diary data. The response rate was computed for the households in which at least 50% of adults completed both interviews; only data from this sample were released for public use and were analyzed for our study. The overall response rate for completing the two interviews and
reporting the diary data was 29.4% for people in these households; 91.4% of
people in these households provided complete diaries. For our study, we analyzed travel data for survey participants aged 18 years or older who were living in households in which a Latino adult was the primary survey respondent or that included an adult
who was born in Latin America (N = 7437). We excluded respondents who did not provide sufficient data to determine whether they engaged in
transportation-related PA (n = 861). We defined participation in
transportation-related PA as either using public transportation at least once per week or walking or bicycling for transportation for at least 10 minutes on a randomly selected day. We included use of public transportation as
transportation-related PA because
such use is shown to require a substantial amount of walking that is not reported as walking trips (18). A survey question was used to ascertain the frequency of respondents’ public transit use over the previous 2 months, and diary entries were used to ascertain their mode of transportation, when their trips started and ended, and the purpose of every trip that was made on a randomly
selected travel day. Trip data were then aggregated to determine each person’s total trip time for each travel mode.
NHIS is a nationwide household survey of health conditions and risk factors among civilian, noninstitutionalized children and adults (17). Respondents
are randomly selected for in-person interviews using a multistage cluster design from address listings of 40,000 households containing about 100,000
people. Within these households, a subsample of adults
is selected for an interview. In 2000, data were collected for 32,374 adults aged 18 years or older in the 50 states and the District of Columbia. The response rate
was 72.1%. We used data for 5133 Latino adults who responded to both PA questions in the NHIS Cancer Supplement to ascertain
usual daily activity. An active level of usual daily activity was defined as “usually walking around most of the day” and
“usually lifting or carrying moderate or heavy loads” and included all activities except those performed during leisure time.
Other measures
The type of data reported varied by source. All sources reported data on respondents’ age, sex, education level, household income, and number of
people in the household. All sources except the NHTS reported data on respondents’ marital status and body mass index (BMI). BMI, computed by dividing a person’s weight in kilograms by the square of the person’s height in meters, was
based on objective height and weight measurements in the NHANES and on
respondents’ self-reported height and weight in the other surveys. We
categorized BMI levels as normal or underweight (BMI <25.0), overweight (BMI = 25.0 to <30.0), or obese (BMI ≥30.0) (19). All surveys except NHANES reported results by region of the United States.
We created proxy measures similar to those used in previous studies for
country of birth, age at immigration, time lived in the United States, and language preference (2,3,5,7,20). The proxy measures used to assess acculturation varied among the surveys. The NHANES and NHTS asked for country of birth, and we classified those survey respondents as having been born in the
United States, Mexico, Central America, South America, or the Caribbean/Atlantic
islands. The NHIS asked for origin or ancestry, and we classified NHIS respondents as having Mexican, Central or South American, Puerto Rican or Dominican, or Cuban origin or ancestry. The NHTS
asked all respondents for the year they immigrated to the United States and for
their current age, from which we computed the number of years they had been in
the country and their age at arrival. We classified their age at immigration as
either younger than 25 years or 25 years or older. The NHIS divided respondents into four categories for time lived in the United States (<5 years, 5 to <10 years, 10 to <15 years, and ≥15 years), and we used these four categories for both NHIS and NHTS data.
All surveys recorded the interview language (English or Spanish); however, to reduce the risk of breaching respondents’ confidentiality, the NHANES did not release this information. The NHANES and the NHIS assessed language spoken at home
according to three categories: Spanish only, English and Spanish, and English
only. For our analysis, we classified respondents as speaking Spanish only or
speaking at least some English at home. Language acculturation was assessed through four questions
in the NHANES and seven questions in the NHIS that asked respondents about their language preference for speaking and reading (asked by both surveys but combined as speaking/reading in
the NHANES), thinking, talking with family, talking with friends, listening to the radio, and watching television (asked by NHIS only). Survey participants were asked to indicate their degree of language preference for
each activity according to a 5-point scale in which 1 indicated Spanish only and 5 indicated English only. We summed the responses to obtain a language acculturation score that ranged from 4 (Spanish only) to 20 (English only) for NHANES participants and from 7 (Spanish only) to 35 (English only) for NHIS participants. We then used medians of the weighted scores (4 for NHANES
and 12 for NHIS) to divide immigrant respondents into two groups (at or below median, above median). We excluded respondents
for whom data on preferred language were missing (3 from NHANES and 99 from NHIS).
Statistical analysis
We calculated participation rates (with confidence intervals) of Latinos in the various types of PA and
in an active
level of usual daily activity by sex, age, education level, income, marital status, number of
people in the household, children living at home, employment status, BMI, and region of residence. We developed descriptive statistics for five types of PA by the available
proxy measures of country of birth, immigration, and acculturation.
Because the various survey samples were derived from different populations, we adjusted all data sets by age, sex, education level, and marital status to the appropriate standard population as defined by the 2003 American Community Survey (ACS) (21). We adjusted data to the ACS Mexican American population for the NHANES data set and to the ACS Latino population for the BRFSS, NHTS, and NHIS
data sets. We also weighted all data to account for nonresponses and sampling errors. SUDAAN 9.1 (RTI International, Research Triangle Park, NC, 2003) was used to account for the complex sample designs of each survey.
Back to top
Results
The unadjusted percentage of male Latino or Mexican American respondents aged 18 to 29 ranged from 26.1% in the NHTS
to 35.1% in the NHANES
(Table 1). The percentage of respondents with less than a high school education ranged from 22.9% in the NHTS to 62.3% in the NHANES.
Twenty percent of the NHTS sample and 56.2% of the NHANES sample were born in Mexico; 61.3% of the NHIS sample was of
Mexican origin or ancestry.
The prevalence of participation by PA domain was 42.8% for leisure-time PA and 34.4% for
household PA (among Mexican Americans only) and 32.6% for occupational PA and 30.6% for
transportation-related PA (among all Latinos)
(Table 2). Mexican American men and women had similar rates of participation in
leisure-time PA and household PA, whereas Latino men had a higher rate of participation in
occupational PA, and Latina women had a higher rate of participation in
transportation-related PA. The
prevalence of participation in leisure-time PA declined with age and increased with education and income.
Transportation-related PA participation was more common among Latinos with low education and income; approximately one in three Latino adults in the NHIS
were classified as having an active level of usual daily activity.
Among U.S.-born Mexican Americans, 49.7% participated in leisure-time PA and 42.5% participated in
household PA, and among all U.S.-born Latinos, 20.7% participated in
transportation-related PA
(Table 3). The prevalence of
transportation-related PA declined with increased time spent in the United States. The prevalences of
leisure-time PA and household PA increased nonsignificantly with acculturation
(as measured by acquisition of the English language): 40.1% of Latinos who were
interviewed in Spanish participated in occupational PA, whereas 27.5% of those
who were interviewed in English did. The prevalence of an active level of usual
daily activity among Latinos in the NHIS did not appear to be associated with their acculturation.
NHTS data showed that Latinos who were born in the Caribbean/Atlantic islands had the highest prevalence of
transportation-related PA participation and that those born in Central America had the lowest (Figure). The amount of time lived in the United States was associated with a lower prevalence of
transportation-related PA among Latinos born in Central America and the Caribbean/Atlantic
islands but not among those born in South
America.
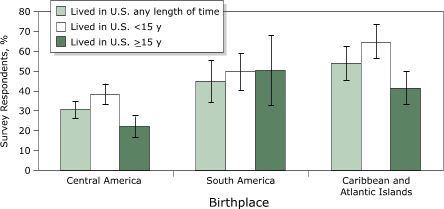
Figure. Percentage of survey respondents reporting transportation-related physical activity, by birthplace and
time lived in the United States. Source: National Household Travel Survey,
2001–2002. Error bars indicate 95% confidence intervals. [A tabular version of this graph is also available.]
NHIS data suggested that overall activity levels among Latinos varied by their region of origin or ancestry (data not shown): among those of Mexican origin or ancestry, approximately 31% had an active
level of usual daily activity, compared with only about one-fifth of those with an origin or ancestry in other parts of Latin America.
Back to top
Discussion
Previous studies show that U.S. Latinos have a higher prevalence of inactivity than
do other racial/ethnic groups (9-11). Our findings suggest that acculturation among Latinos is associated with an increase in the prevalence of
leisure-time PA, confirming the results of previous research (2,4,6,7). We hypothesize that the flat national trend in the prevalence of leisure-time inactivity among Latinos (9) may
be because the increase in the prevalence of leisure-time PA associated with acculturation is offset by the influx of new Latino immigrants with lower
leisure-time PA participation rates (12). Future research should explore this hypothesis.
U.S. Latinos are less likely to participate in recommended levels of PA than
are other racial/ethnic groups (10,11). Our results suggest that the prevalence of an active
level of usual daily activity among U.S. Latinos is relatively unaffected by acculturation because a decrease in their rate of participation in occupational and transportation-related activities is compensated for by an increase in their rate of
participation in activities around the home and their rate of planned exercise and other leisure-time activities.
The lack of relationship between the prevalence of an active
level of usual daily activity and acculturation may be because survey questions about overall
usual daily activity may capture incidental PA, whereas questions about participation in specific domains or specific activities may not.
The Spanish translation and validity of the survey questions, neither of which have been
evaluated among Latinos, may also influence our findings.
Previous studies of Latinos suggest that lifestyle PA levels increase with acculturation. Among Latino women living in the southwestern United States, the number of hours per week spent doing moderate-intensity sports and exercise or stretching and the total metabolic-equivalent hours per week of lifestyle PA both increased (6). In another study, researchers found that among first-generation
Latino women living in North Carolina, the likelihood of meeting PA recommendations was associated with higher English acculturation and arriving in the United States before age 25 but not with time lived in the United States (5).
The findings of this paper are subject to several limitations. First, the
surveys varied in their sampling and weighting methods. We controlled for
this variability by adjusting all data to a standard population (i.e., 2003
American Community Survey) by age, sex, education level, and marital status.
Nevertheless, interpretation of the results could be affected by the
heterogeneity of the Latino population by country of
origin and socioeconomic status during the acculturation process (7). Second, most of the data in the surveys we used were based on self-reports, which are subject to recall and social desirability biases. Third, because we presented
some statistics for Mexican Americans only and some for all Latinos, all results were not applicable to the
entire Latino population. Thus, we made general observations about patterns of PA participation among Latinos and changes in PA participation associated with acculturation. Fourth, the surveys differed in assessment of demographics and proxy acculturation measures. Fifth, gardening and yard work that were reported as
leisure-time PA were included in the leisure-time PA measure rather than in the
household PA measure; reporting
them in the household PA measure would have resulted in a lower rate of participation in
leisure-time PA and a higher rate of participation in household PA. Finally, we reported transportation-related activity for all adults in households in which the respondent reported being of Hispanic descent, potentially including non-Latinos in our NHTS sample. In 77% of households classified as Hispanic in the 2003 American Community
Survey, all adults in the household were Hispanic (21).
Our study found that PA patterns and levels of usual daily activity among
Latinos may differ both by their country or region of origin and by their level
of acculturation. These findings suggest that people designing or evaluating
culturally appropriate PA interventions or conducting epidemiologic research
into PA among Latinos should not only measure their participation in all domains
of PA but also determine their subjects’ country of origin and the extent of
their acculturation.
Back to top
Author Information
Corresponding Author: Sandra A. Ham, MS, Physical Activity and Health Branch, Division of Nutrition and Physical Activity, Centers for Disease Control and Prevention, 4770 Buford Hwy, Mailstop K-46, Atlanta, GA 30341. Telephone: 770-488-5434. E-mail:
SHam@cdc.gov.
Author Affiliations: Michelle M. Yore, Judy Kruger, Refilwe Moeti, Centers for Disease Control and Prevention, Atlanta, Georgia; Gregory W. Heath, The University of Tennessee at Chattanooga, Chattanooga, Tennessee.
Back to top
References
- Dey AN, Lucas JW.
Physical and mental health characteristics of U.S.- and foreign-born adults: United States, 1998-2003. Adv Data 2006;369:1-19.
- Abraído-Lanza AF, Chao MT, Flórez KR.
Do healthy behaviors decline with greater acculturation? Implications for
the Latino mortality paradox. Soc Sci Med 2005;61(6):1243-55.
- Lara M, Gamboa C, Kahramanian MI, Morales LS, Bautista DE.
Acculturation and Latino health in the United States: a review of the literature and its sociopolitical context. Annu Rev Public Health 2005;26:367-97.
- Crespo CJ, Smit E, Carter-Pokras O, Andersen R.
Acculturation and leisure-time physical inactivity in Mexican American adults: results from NHANES III, 1988–1994. Am J Public Health 2001;91(8):1254-57.
- Evenson KR, Sarmiento OL, Ayala GX.
Acculturation and physical activity among North Carolina Latina immigrants. Soc Sci Med 2004;59(12):2509-22.
- Slattery ML, Sweeney C, Edwards S, Herrick J, Murtaugh M, Baumgartner K, et al.
Physical activity patterns and obesity in Hispanic and non-Hispanic white
women. Med Sci Sports Exerc 2006;38(1):33-41.
- Zsembik BA, Fennell D.
Ethnic variation in health and the determinants of health among Latinos. Soc Sci Med 2005;61(1):53-63.
- Physical activity and health: a report of the Surgeon General. Atlanta (GA): U.S. Department of Health and Human Services, Centers for Disease Control and Prevention, National Center for Chronic Disease Prevention and Health Promotion; 1996.
- Centers for Disease Control and Prevention.
Trends in leisure-time physical inactivity by age, sex, and race/ethnicity — United States, 1994–2004. MMWR Morb Mortal Wkly Rep 2005;54(39):991–4.
- Macera CA, Ham SA, Yore MM, Jones DA, Ainsworth BE, Kimsey CD, et al. Prevalence of physical activity in the United States: Behavioral Risk Factor Surveillance System, 2001. Prev Chronic Dis 2005;2(2).
http://www.cdc.gov/pcd/issues/2005/apr/04_0114.htm
- Data2010: the Healthy People 2010 database. Atlanta (GA): U.S. Department
of Health and Human Services, Centers for Disease control and Prevention. http://wonder.cdc.gov/data2010.
Updated May 11, 2007. Accessed Dec 18, 2006.
- Current population reports: population projections of the United States by
age, race, and Latino origin: 1995-2050. Washington (DC): U.S. Department of Commerce,
U.S. Census Bureau; 1998.
- Pate RR, Pratt M, Blair SN, Haskell WL, Macera CA, Bouchard C, et al.
Physical activity and public health. A recommendation from the Centers for
Disease Control and Prevention and the American College of Sports Medicine. JAMA 1995;273(5):402-7.
- National Health and Nutrition Examination Survey Data, 1999–2002.
Hyattsville (MD): Centers for Disease Control and Prevention, National
Center for Health Statistics. http://www.cdc.gov/nchs/nhanes.htm. Updated
January 11, 2007. Accessed Dec 18, 2006.
- Behavioral Risk Factor Surveillance System Survey Data, 2003. Atlanta
(GA): Centers for Disease Control and Prevention, National Center for
Chronic Disease Prevention and Health Promotion. http://www.cdc.gov/brfss/.
Updated May 1, 2007. Accessed Dec 18, 2006.
- National Household Travel Survey Data, 2001. Washington (DC): U.S.
Department of Transportation, Federal Highway Administration.
http://nhts.ornl.gov/download.shtml#2001. Accessed Dec 18, 2006.
- National Health Interview Survey Data, 2000. Hyattsville (MD): Centers for
Disease Control and Prevention, National Center for Health Statistics. http://www.cdc.gov/nchs/nhis.htm.
Updated May 16, 2007. Accessed Dec 18, 2006.
- Besser LM, Dannenberg AL.
Walking to public transit: steps to help meet physical activity recommendations. Am J Prev Med 2005;29(4):273-80.
-
Obesity: preventing and managing the global epidemic. Report of a WHO consultation. World Health Organ Tech Rep Ser 2000;894:i-xii, 1-253.
- Wilbur J, Chandler PJ, Dancy B, Lee H.
Correlates of physical activity in urban
Midwestern Latinas. Am J Prev Med 2003;25(3 Suppl 1):69-76.
- American Community Survey public use microdata. Washington (DC): U.S.
Census Bureau. http://www.census.gov/acs/www/index.html. Updated June 13,
2007. Accessed Dec 18, 2006.
Back to top
|
|
