
|
|
Volume
3:
No. 2, April 2006
ORIGINAL RESEARCH
Congruencies in Increased Mortality Rates, Years of
Potential Life Lost, and Causes of Death Among Public Mental Health Clients in Eight States
Craig W. Colton, PhD, Ronald W. Manderscheid, PhD
Suggested citation for this article: Colton CW, Manderscheid RW. Congruencies in
increased mortality rates, years of potential life lost, and causes of death among public mental
health clients in eight states. Prev Chronic Dis [serial online] 2006 Apr [date cited]. Available from: URL: http://www.cdc.gov/pcd/issues/2006/
apr/05_0180.htm.
PEER REVIEWED
Abstract
Introduction
Mortality rates are used as global measures of a population’s health status and as indicators for public health efforts and medical treatments. Elevated mortality rates among individuals with mental illness have been reported in various studies, but very little focus has been placed on interstate comparisons and congruency of mortality and causes of death among public mental health
clients.
Methods
Using age-adjusted death rates, standardized mortality ratios, and years of potential life lost,
we compared the mortality of public mental health clients in eight states with
the mortality of their state general populations. The data used in our study were submitted by public mental health agencies in eight states (Arizona, Missouri, Oklahoma, Rhode Island, Texas, Utah,
Vermont, and Virginia) for 1997
through 2000 during the Sixteen-State Study on Mental Health Performance Measures, a
multistate study federally funded by the Center for Mental Health Services in
collaboration with the National Association of State Mental Health Program Directors.
Results
In all eight states, we found that public mental health clients had a higher relative risk of death than the general populations of their states. Deceased public mental health clients
had died at much younger ages and lost decades of potential life when compared with their living cohorts nationwide. Clients with major mental illness diagnoses died at younger ages and lost more years of life
than people with non-major mental illness diagnoses. Most mental health clients died of natural causes similar to the leading causes of death found nationwide, including
heart disease, cancer, and cerebrovascular, respiratory, and lung diseases.
Conclusion
Mental health and physical health are intertwined; both types of care should be provided and linked together within health care delivery systems. Research to track mortality and primary care should be increased to provide information for additional action, treatment modification, diagnosis-specific risk, and evidence-based practices.
Back to top
Introduction
Elevated mortality rates among individuals with mental illness have been reported in various studies (1-4). Causes of death,
comorbidities, and medical problems of individuals with mental illness also have been assessed (5-7). Although research by McCarrick et al in 1986 highlighted high rates of chronic medical problems among individuals with chronic mental illness (8), very little focus has
been placed on interstate comparisons and congruency of mortality and causes of death among public mental health clients. Mortality rates are used as global measures of a population’s health status and as indicators for public health efforts and medical treatment. The federal Center for Mental Health Services (CMHS) and the National Association of State Mental Health Program Directors
(NASMHPD) have suggested using statewide mortality statistics as outcome measures for public mental health clients (9).
The purpose of this article is to expand on previous work by examining the mortality of public mental health clients in eight states during selected years compared with the overall mortality of the general population in each state during the same years.
Public mental health clients receive treatment and services through the public
mental health authorities and agencies in their states. As needed and available,
treatment and services are provided in outpatient settings, during inpatient
hospitalizations, or both. In addition, the leading causes of death for public mental health clients in six of the states are compared with causes of death for the
general populations of the states. Congruencies and differences among states’ mortality rates and causes of death are also examined.
Back to top
Methods
The data used in our study were submitted by public mental health agencies in eight states (Arizona, Missouri, Oklahoma, Rhode Island, Texas, Utah,
Vermont, and Virginia) for 1997 through 2000 during the Sixteen-State Study on Mental Health Performance Measures, (9) a
multistate project federally funded by the CMHS, Substance Abuse and Mental Health Services Administration (SAMHSA), Department of Health and
Human Services (HHS), to compare the mortality of clients served by these public mental health systems.
Only these eight of the 16 states were able to submit data on the deaths of
their clients. Seven states included data on deaths of both their outpatient
clients and their hospitalized inpatient clients. Virginia included data only on
the deaths of hospitalized inpatients. For each year that data were submitted, multiple standardized measures of mortality were calculated for public mental health clients and the general population of each state, including age-adjusted death rates (AADRs), standardized mortality ratios (SMRs), years of potential life lost (YPLL),
and mean age at time of death. All eight states did not submit data for all years. Six states (Missouri, Oklahoma, Rhode Island, Texas, Utah, and Virginia) provided data about causes of death,
and comparisons were made within and between these states.
Records of mental health clients were electronically linked and matched with death records from state vital statistics agencies by the public mental health agencies in six states: Arizona, Missouri, Oklahoma, Rhode Island, Texas, and Utah. The states used computer software developed by the Oklahoma State Mental Health Authority and statistical analysis software such as SPSS (SPSS Inc, Chicago,
Ill) or SAS (SAS Institute Inc, Cary, NC) to match death records with records of clients receiving services during the year of their deaths. Virginia used deaths reported for clients in state psychiatric hospitals. Individual records were used for each deceased client by the seven states. Vermont AADRs and SMRs were based on mental health
clients represented in the Vermont death records.
Probabilistic population estimation (10) was used to establish an unduplicated client count and
estimate the number of Vermont clients who died during the period or the overlap
between clients served and death files. Vermont AADRs and SMRs were based on
mental health clients represented in the Vermont death records. Vermont rates were calculated for a combination of 3 years to minimize the effects of annual fluctuations.
AADRs per 100,000 U.S. standard population were computed for each year in each state for deceased public mental health clients who had received public mental health system services during their year of death. These mental health client AADRs were compared with the yearly statewide AADRs published in the
National Vital Statistics Reports from the National Center for Health Statistics, Centers
for Disease Control and Prevention (CDC) (11-18). According to the reports, “Age-adjusted rates are used to compare relative mortality risks among groups and over time. However, they should be viewed as relative indexes rather than as actual measures of mortality risk” (15).
Because age is a major determinant of mortality, age adjustment, or standardization, is used to compare different populations and geographic areas. With this direct method of standardization, age-specific death rates from two populations — the state public mental health population and the statewide general population — with different age structures can be applied to a third
“standard” population. CDC uses the U.S. 1940 standard population for standardizing or adjusting 1997 and earlier years and the U.S. 2000 standard population for 1998 and later years
(11-18). This methodology was used for our analyses of public mental health clients so that comparisons could be made with CDC’s findings. Clients were divided into 11 age groups: younger than 1
year; 1 to 4 years, 5 to 14 years, 15 to 24 years, 25 to 34 years, 35 to 44 years, 45
to 54 years, 55 to 64 years, 65 to 74 years, 75 to 84 years, and 85 years and older. Age-specific death rates were calculated for each age group of public mental health clients by dividing the number of deaths in that age group by the total number of clients served in that age group. To adjust or standardize, the age-specific death rate
for each group was multiplied by the population percentage for that age group in the standard population used by CDC. These age-adjusted products for the age groups are added to create the AADRs for the served public mental health client population in the state each year. Similar procedures are used by CDC to calculate the AADRs published in
the
National
Vital Statistics Reports (11-18) and are
used in this article for the age-adjusted rates for each of the states.
The SMRs can be used to show the relative risk of death between mental health clients and state populations. SMRs were calculated for public mental health clients, who received at least one public mental health service in the year of their death, in each state and year for which data were submitted. The SMR is the ratio of the actual number of deaths in a population to the number of expected
deaths based on an overall population, controlling for age and sex, which are major determinants of mortality. In this indirect method of standardization, yearly age-specific death rates for
men and women in the general population of each state are applied to the public mental health population by age and sex of the state public mental health system to estimate the expected number of deaths
for the service population during that year. The number of male clients and the number of female clients are determined in each of the 11 age categories mentioned previously for AADRs. The number of clients in each sex–age category is multiplied by the sex–age-specific death rate in that category for each state general population during the same year and then divided by 100,000. The quotients from all
the sex–age categories are added to estimate the number of deaths expected per 100,000 public mental health clients during the year. The SMR is calculated by dividing the actual number of client deaths by the expected number of deaths for the year. An SMR of greater than 1.0 indicates that the relative risk of death for mental health clients is higher than that of the general population of
the state.
The mean number of years of potential life lost (YPLL) and mean age at time of death were calculated for public mental health clients. YPLL as a mortality measure provides information about the risk of premature death by using the difference between client age at death and the current life expectancy, or mean survival age for living cohorts of the same age and sex as each decedent during the
year of death. The average YPLL for clients in each state during each year was estimated using current life expectancy tables for the U.S. population, which are developed and published annually by CDC (11-18). First, the
number of YPLL per client was determined using the difference between the age at death and the current life expectancy age for living cohorts of the same age and sex found in the life
expectancy table for the year of death. Then, the YPLL for all clients who died
were added and divided by the number of deceased clients to calculate the mean YPLL for all public mental health clients who died each year in each
of the seven states able to submit data on client age at time of death (Arizona,
Missouri, Oklahoma, Rhode Island, Texas, Utah, and Virginia).
In addition, the YPLL and the mean age at time of death for public mental health clients with
major mental illness (MMI) diagnoses — schizophrenia, major depressive disorders, bipolar disorders, delusional and psychotic disorders, and attention deficit/hyperactivity disorders — are compared with clients with non-MMI diagnoses using data submitted by six states. MMI diagnoses in
this study include Diagnostic and Statistical Manual of Mental Disorders, Fourth Edition (DSM-IV) diagnosis codes 295
through 298 and 314 (19). The operational definition of MMI was developed and used during the previously mentioned
Sixteen-State Study on Mental Health Performance Measures (9). Likewise, in this study, MMI is operationally defined using the listed diagnoses. Clients with the listed
DSM-IV diagnoses are clients with MMI, and clients without these specific
diagnoses but who have other DSM-IV diagnoses are considered clients with other non-MMI diagnoses.
The term serious mental illness (SMI) is
used in other studies that are discussed later. By definition, SMI "generally
applies to mental disorders that interfere with some area of social functioning"
(20). SMI has also been defined as a diagnosable mental, behavioral, or
emotional disorder that meets criteria in the DSM-IV and results in
functional impairment that substantially interferes with major life activities
(19,21). MMI clients in this study have diagnoses that fall within the category
of SMI.
We compared leading causes of death for public mental health clients and the statewide population for the six states that provided data about causes of death. The leading causes of death for public mental health clients were compiled for each state during each year using categories from CDC publications so that comparisons with CDC could be made (11-18,22). Natural causes and external
causes, such as accidents and suicide, were included. Differences in accident and suicide rates between people with mental illness and general populations of states have been found in previous analyses (23).
Back to top
Results
Public mental health clients in all eight states studied have a greater risk of dying than the general populations of their states. They have higher AADRs during every year submitted than the general populations of their states during the same year as shown in
Table 1, which includes AADRs per 100,000 individuals for the public mental health client populations and the
statewide populations by year.
The relative risk of death for public mental health clients is higher in all eight states during all years than for state general populations, as shown by the SMRs (Table 1). The actual numbers of deaths among public mental health clients ranged from 4.9 to 1.2 times higher than the expected number of deaths. Oklahoma and Texas had the highest
SMRs, about
three to five times higher actual numbers of deaths than expected deaths during several years. Arizona, Missouri, and Utah had actual numbers of deaths that were twice as high as expected deaths. In Virginia and Rhode Island, the actual number of deaths ranged from 1.8 to 1.2 times higher than expected deaths. The SMR for Vermont was 3.2.
Deceased public mental health clients had lost decades of potential years of life; averages varied from 13 to more than 30 years depending on the state and year (Table
2). For the years studied, nationwide life expectancies or mean survival ages of living cohorts extended into the 70s and older (11-16,18). Public mental health clients died at younger ages than their cohorts. Clients’ average
death ages ranged from 49 to 60 in six of the seven states; Virginia public mental health clients who were in state psychiatric hospitals had higher mean ages
in the 70s at time of death than the clients in the six other states. Male public mental health clients died at younger mean ages than their female counterparts, except in Virginia during 2000 (Table 2). The longer average
life for female clients ranged from 4 to 16 years in all states but Virginia. Vermont data were not available.
Clients with MMI diagnoses died at younger ages than clients with non-MMI diagnoses in 14 out of 16 comparisons made for the six states providing data
(Table 3). Clients with MMI diagnoses died 1 to 10 years earlier on average (mean age at time of death) than clients with non-MMI diagnoses in the same state during the same year. In five states, clients with MMI
diagnoses had shorter lives on average during all years compared, whereas in
Missouri, they had shorter lives on average for 2 of 4 years.
The YPLL were generally higher for clients with MMI diagnoses than for clients with non-MMI diagnoses, with a median difference that was almost 2 years higher overall (Table 3). In four states, clients with MMI diagnoses had higher YPLL during all years compared. In Missouri during 2 of 4 years, clients with MMI diagnoses had higher YPLL. Utah clients with MMI
diagnoses lost slightly fewer years (0.3 years) during 1999. Even though clients with MMI diagnoses in Utah during 1999 died at a slightly younger mean age than clients with non-MMI diagnoses, the clients with MMI diagnoses still had slightly lower YPLL. Data were not available for Arizona and Vermont.
Comparisons of the leading causes of death for public mental health clients in the six states that submitted data are shown in Figures 1 through
6, as are the leading causes of death statewide for each state and year and for the United States in 1999. Most public mental health clients died of natural causes in all six states. The leading causes of death for mental health clients are similar to
those found nationwide and statewide; they include heart disease, cancer, and cerebrovascular, respiratory, and lung diseases. Heart disease was the leading cause of death among public mental health clients in all six states as well as in general state populations and the United States. Cancer was second in the general populations of the six states and the United States. For public mental health
clients, cancer was the second highest cause of death in three states for 2 of 3 years and in Rhode Island for the year shown. In Utah and Virginia, cancer was third as a cause of death among public mental health clients. Percentages of mental health clients who died of cancer were lower than for the general population in all six states for the years shown.
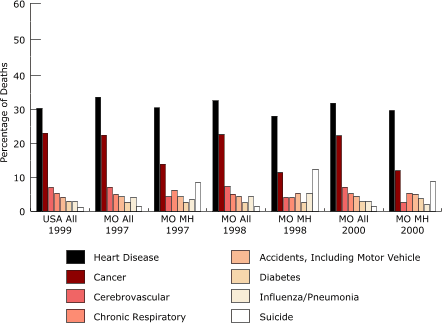
Figure 1. Leading causes of death in general populations
(All) and public mental health clients (MH) nationwide and statewide in Missouri, 1997 to 2000. [A tabular version of this chart is also available.]
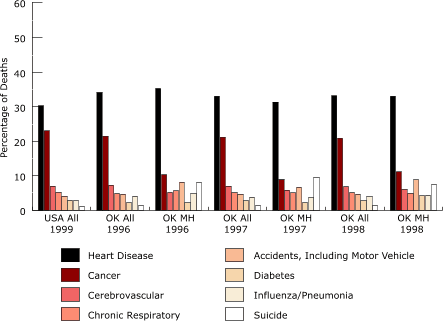
Figure 2. Leading causes of death in general populations
(All) and public mental health clients (MH) nationwide and statewide in Oklahoma, 1996 to 1998. [A tabular version of this chart is also available.]
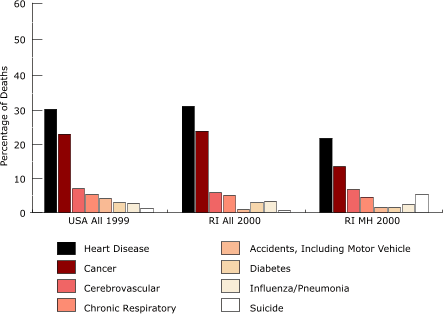
Figure 3. Leading causes of death in general populations
(All) and public mental health clients (MH) nationwide and statewide in Rhode Island, 1999 and 2000. [A tabular version of this chart is also available.]
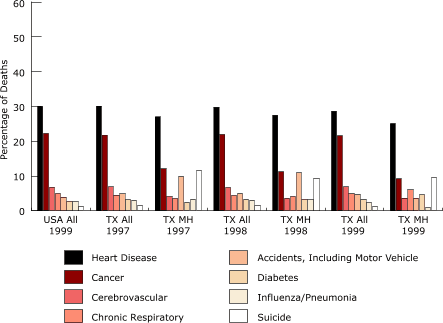
Figure 4. Leading causes of death in general populations
(All) and public mental health clients (MH) nationwide and statewide in Texas, 1997 to 1999. [A tabular version of this chart is also available.]
Figure 5. Leading causes of death in general populations
(All) and public mental health
clients (MH) nationwide and statewide in Utah, 1998 to 1999. [A tabular version of this chart is also available.]
Figure 6. Leading causes of death in general populations
(All) and public mental health
clients (MH) nationwide and statewide in Virginia, 1998 to 2000. [A tabular version of this chart is also available.]
Although most public mental health clients died of natural causes, the percentages of mental health clients who died from accidents, including automobile accidents and suicide, are higher than those of the general populations in all states but Virginia, which only supplied data about clients in state psychiatric hospitals. Consequently,
in five states the percentages of public mental health clients who die
from natural causes are lower than those of the general population.
In 1998, Utah had the highest percentage of public mental health clients who died from accidents and suicide of the six states. In
addition, percentages of deaths from accidents, including automobile accidents, were higher for Utah’s general population than the general populations of the other five states. The percentages of deaths by accidents are about twice as high as for the United States. In addition, the percentages of deaths from cancer were lower in Utah’s general population than in the overall population of any other state in this study. Utah’s public mental health clients also had lower percentages of death
from cancer.
Back to top
Discussion
High congruence was found among the mortality of public mental health clients in eight states as indicated by multiple standardized measures of mortality. The higher risk of death among these clients compared with the general populations of their states using the AADRs and SMRs are consistent with conclusions of other research. Most importantly, the findings in this study show that results are
similar in several states. In all eight states, public mental health clients have higher AADRs and higher relative risks of dying as shown by SMRs considering age and sex. Even though the magnitude of AADRs and SMRs
vary by state and year, the results show strong similarities. CDC’s National
Vital Statistics Reports (11-18) and work by other researchers show differences in mortality and
leading causes of death among state populations and years. Some interstate differences in mortality measures reported in this article might be attributed partially to differences among state populations. Therefore, in this study, mortality statistics were calculated and compared between mental health clients in each state and the general populations within the state during the same year.
In addition, parallels between the public mental health clients in all eight states were found in the YPLL and mean age at time of death. Public mental health clients lost decades of potential life and died at younger ages than their cohorts nationwide for the years studied. YPLL as a mortality measure provides insight into the risk of premature death for public mental health clients. Clients
with MMI diagnoses (schizophrenia, major depressive disorders, bipolar disorders, delusional and psychotic disorders, and attention deficit/hyperactivity disorders) died at younger ages on average than most clients with non-MMI diagnoses. The YPLL for clients with MMI diagnoses were higher than clients with non-MMI diagnoses in
more than 81% of the comparisons made.
All eight states did not submit data for all years, which may influence the generalizations of our study findings. Future similar analyses with additional data will increase the generalizability of our findings. Regardless, a review of the findings in this study raises the issue of determining what can be done to lower the mortality rates and risk of early death for people with mental
illness, especially people with the most serious diagnoses. Twenty years ago, McCarrick et al reported higher rates of chronic medical problems among people with chronic mental illness, and chronic illness is known to increase risk of death. They suggested in their conclusions that “psychiatrists need to be adept at caring for physical illness, and primary-care physicians need to acquire
skills in caring for the mentally ill” (8).
It was noted previously that clients in Virginia state psychiatric hospitals had a lower risk of death and longer lives than public mental health clients from the other seven states. These findings raise additional questions. Do differences
in treatment and care exist between clients in hospital residences and clients
residing and receiving treatment in communities? If so,
the differences could influence mortality rates, life span, age at time of death, and subsequently YPLL. Are medical and other types of care for improving physical health provided to public mental health clients living in a hospital setting but not to clients in less-controlled environments? Although answering these questions directly is beyond the scope of this study, causes of death for public mental
health clients and the health issues of people with mental illness suggest that treatment practices can be developed and used to help address the problem of premature death among people with mental illness.
Utah’s data highlight that differences exist among states. The general population of Utah is younger than
the population of most states in the United States; one third of Utah’s general population was aged 17 years or younger, and one fourth was aged 18 to 34 years during the study years.
According to
the
National Vital Statistics Reports, accidents are generally the leading cause of death among people younger than 34
years (11-18,22). The high proportion — almost 60% of Utah residents younger than 34 years — could have affected Utah’s data in this study. Age distribution and lifestyle among Utah residents may
also affect the lower incidence of cancer in the state. To explain the lower percentages of
cancer among deceased adults who had been served by the Massachusetts Department of Mental Health, Dembling et al (3) suggested that the development of cancer might be
preempted by early death. A similar explanation could be applied to this study’s data from multiple states, especially in view of the younger average ages at time of death for the public mental health clients.
Although the increased mortality rates found in this study are outcome results, health conditions and other factors related to people with mental illness have been described by other researchers and help explain these mortality findings;
examples are cited in the following paragraphs. Most public mental health clients in all of the states died of natural causes and at younger ages than the general populations of their states.
Leading causes of death for most public mental health clients were similar to those of individuals throughout the United States and in state general populations, especially
heart disease, cancer, and cerebrovascular, respiratory, and lung diseases. People with mental illness have medical problems that lead to death, especially if
they have inadequate medical treatment.
Researchers and clinicians continue to document comorbidity and medical treatment issues for individuals with mental illness. In 2004, researchers found that outpatient clients with serious mental illness were more likely to have comorbid medical conditions than the general population and have an increased risk for medical conditions, especially diabetes, lung disease, and liver conditions
(7). Researchers from Australia found that physical comorbidity in people with schizophrenia accounts for 60% of premature deaths not related to suicide in this population (6). The prevalence of chronic bronchitis and emphysema
was significantly higher among Maryland adult outpatients with serious mental illness than national comparison subjects (24). In addition, it was also found that the
prevalence of cardiovascular disease was higher among the Maryland adults with serious mental illness who had major depressive episodes, minor depression, and moderate mental health. Other researchers found that after a confirmed myocardial infarction, Medicare clients
“with comorbid mental disorders were substantially less likely to undergo coronary revascularization procedures then those
without mental disorders” (25). In western Australia, psychiatric clients were found to have a higher fatality rate from cancer, even though they did not have a higher incidence rate of cancer (26); the higher fatality rates were attributed to screening and treatment deficiencies. In Vermont, “the incidence of cancer for adults with serious mental illness is more than twice the
incidence for the general population” (27).
Researchers have studied the health risks of individuals with mental illness. Compared with other populations, people with mental illness have a higher prevalence of cardiovascular risk factors, including smoking, overweight and obesity, lack of moderate exercise, harmful levels of alcohol consumption, excessive salt intake, and poor diet (6,28). Lack of emotional support and social
networks, lower socioeconomic status, and substance abuse are described as risk factors that affect mortality in people with serious mental illness (29).
According to the Harvard Mental Health Letter, people with psychiatric disorders have higher rates of medical illnesses, but they often do not seek needed medical care (30).
Lifestyle, social consequences of mental illness, and difficulties in accessing health care
are factors related to managing physical illness in those with mental illness (31). Lifestyle factors include long-term use of antipsychotic medication and
sexual practices. Social consequences of mental illness include poverty, unemployment, poor housing, stigma, and low self-esteem. Difficulties accessing health care include doctors’ focus on mental illness and not physical health, erratic compliance with health screening and treatment, and poor communication.
Some mental health practitioners and heath care professionals are proposing ways to improve the physical health of individuals with mental illness, which could consequently help decrease mortality rates and rates of premature death. If primary care and mental health professionals pay attention to the physical ramifications of mental illness, the physical health of people with serious mental
illness can be improved (32). Improved intervention practices could include engaging clients in preventive care, diagnosis, and management of serious physical illnesses and additional training for mental and physical health professionals to encourage communication about patient care (33). In Australia and Great Britain, health promotion programs and treatment improvements are being proposed for
people with mental illness (33-35). In the United States, advance-practice nurses and consumer peer providers are being
added to Assertive Community Treatment Programs to address physical health problems among people with serious mental illness (36).
The 1999 Surgeon General’s report on mental health recognized “the inextricably intertwined relationship” between mental health and physical health (20). Research to track mortality and primary care among mental health clients should be increased to provide information for additional action and treatment modification. More research about diagnosis-specific risk and
evidence-based practices should be developed. Awareness among clients and providers of mental health services and primary care should be increased. Best evidence-based practices for the prevention and diagnosis of medical conditions among people with mental illness should be developed. Mental health clients should receive regular primary health care by a physician to monitor their physical
health. Finally, the recommendation from the World Health Organization to integrate mental health care and primary health care should be followed (37). At the least, mental health care and physical health care should be better linked within health care delivery systems.
Back to top
Acknowledgments
The data used in this analysis are from the Sixteen-State Pilot Project funded by the federal CMHS, SAMHSA, HHS. This manuscript was commissioned and funded by the CMHS and performed as a Mental Health Data Infrastructure Support task.
Back to top
Author Information
Corresponding Author: Craig W. Colton, PhD, Colton & Associates, 475 West 2400 South, Bountiful,
UT 84010. Telephone: 801-299-1921. E-mail: craigcolton@networld.com.
Author Affiliations: Ronald W. Manderscheid, PhD, Center for Mental Health Services, Substance Abuse and Mental Health Services Administration, Department of Health and Human Services, Rockville, Md.
Back to top
References
- Babigian HM, Odoroff CL.
The mortality experience of a population with psychiatric illness. Am
J Psychiatry 1969;126:470-80.
- Felker B, Yazel JJ, Short D.
Mortality and medical comorbidity among psychiatric patients: a review. Psychiatr Serv 1996;47(12):1356-63.
- Dembling BP, Chen DT, Vachon L.
Life expectancy and causes of death in a population treated for serious mental illness. Psychiatr Serv 1999;50(8):1036-42.
- Hwang S.
Mental illness and mortality among homeless people. Acta Psychiatr Scand 2001;103:81-2.
- Kamara SG, Peterson PD, Dennis JL.
Prevalence of physical illness among psychiatric inpatients who die of natural causes. Psychiatr Serv 1998;49(6):788-93.
- Lambert TJ, Velakoulis D, Pantelis C.
Medical comorbidity in schizophrenia. Med J
Aust 2003;178 Suppl:S67-70.
- Sokal J, Messias E, Dickerson FB, Kreyenbuhl J, Brown CH, Goldberg RW, et
al.
Comorbidity of medical illnesses among adults with serious mental illness who are receiving community psychiatric services. J
Nerv Ment Dis 2004;192(6):421-7.
- McCarrick AK, Manderscheid RW, Bertolucci DE, Goldman H, Tessler R.
Chronic medical problems in the chronic mentally ill. Hosp Community Psychiatry 1986;37(3):289-91.
- National Association of State Mental Health Program Directors. Sixteen-state study on mental health performance measures. Alexandria
(VA): National Association of State Mental Health Program Directors, NASMHPD Research Institute; 2002.
- Banks SM. Probabilistic population estimation [DVD]. Bristol (VT): The Bristol Observatory; 2005.
- Anderson RN, Kochanek KD, Murphy SL. Report of final mortality statistics,
1995. Monthly vital statistics report; vol 45 no 11, suppl 2. Hyattsville
(MD): U.S. Department of Health and Human Services, Centers for Disease
Control and Prevention, National Center for Health Statistics; 1997.
- Hoyert DL, Kochanek KD, Murphy SL. Deaths: final data for 1997. National vital statistics reports; vol 47 no 19. Hyattsville
(MD): U.S. Department of Health and Human Services, Centers for Disease
Control and Prevention, National Center for Health Statistics; 1999.
- Martin JA, Smith BL, Mathews TJ, Ventura SJ. Births and deaths: preliminary data for 1998. National vital statistics reports; vol 47 no 25. Hyattsville
(MD): U.S. Department of Health and Human Services, Centers for Disease
Control and Prevention, National Center for Health Statistics; 1999.
- Murphy SL. Deaths: final data for 1998. National vital statistics reports; vol 48 no 11. Hyattsville
(MD): U.S. Department of Health and Human Services, Centers for Disease
Control and Prevention, National Center for Health Statistics; 2000.
- Kochanek KD, Smith BL, Anderson RN. Deaths: preliminary data for 1999. National vital statistics reports; vol 49 no 3. Hyattsville
(MD): U.S. Department of Health and Human Services, Centers for Disease
Control and Prevention, National Center for Health Statistics; 2001.
- Hoyert DL, Arias E, Smith BL, Murphy SL, Kochanek KD. Deaths: final data for 1999. National vital statistics reports; vol 49 no 8. Hyattsville
(MD): U.S. Department of Health and Human Services, Centers for Disease
Control and Prevention, National Center for Health Statistics; 2001.
- Hoyert DL, Anderson RN. Age-adjusted death rates: trend data based on the year 2000 standard population. National vital statistics reports; vol 49 no 9. Hyattsville
(MD): U.S. Department of Health and Human Services, Centers for Disease
Control and Prevention, National Center for Health Statistics; 2001.
- Minino AM, Smith BL. Deaths: preliminary data for 2000. National vital statistics reports; vol
49 no 12. Hyattsville (MD): U.S. Department of Health and Human Services,
Centers for Disease Control and Prevention, National Center for Health Statistics; 2001.
- American Psychiatric Association. Diagnostic and statistical manual of mental
disorders, 4th ed. Washington (DC): American Psychiatric Association; 1994.
- U.S. Department of Health and Human Services. Mental health: a report of the Surgeon General. Rockville
(MD): U.S. Department of Health and Human Services, Substance Abuse and Mental Health Services Administration, Center for Mental Health Services, National Institutes of Mental Health; 1999.
- Office of Applied Studies. Results from the 2001 National Household
Survey on Drug Abuse; vol 1. Summary of national findings. Rockville (MD): U.S.
Department of Health and Human Services, Substance Abuse and Mental Health
Services Administration; 2002.
- Anderson RN. Deaths: leading causes for 1999. National vital statistics reports; vol 49 no 11. Hyattsville
(MD): U.S. Department of Health and Human Services, Centers for Disease
Control and Prevention, National Center for Health Statistics; 2001.
- Dickey B, Dembling B, Azeni H, Normand SL.
Externally caused deaths for adults with substance use and mental disorders. J Behav
Health Serv Res 2004;31(1):75-85.
- Keyes CL.
The nexus of cardiovascular disease and depression revisited: the complete mental health perspective and the moderating role of age and gender. Aging Ment Health 2004;8(3):266-74.
- Druss BG, Bradford DW, Rosenheck RA, Radford MJ, Krumholz HM.
Mental
disorders and use of cardiovascular procedures after myocardial infarction. JAMA 2000;283(4):506-11.
- Lawrence D, Holman CD, Jablensky AV, Threlfall TJ, Fuller SA.
Excess cancer mortality in
Western Australian psychiatric patients due to higher case fatality rates. Acta Psychiatr Scand 2000;101:382-8.
- Pandiani JA, Boyd MM, Banks SM. Cancer: elevated incidence for adults with
serious mental illness. Baltimore (MD): Fifteenth Annual Conference on State
Mental Health Agency Services Research, Program Evaluation, and Policy; 2005
Feb 6.
- Davidson S, Judd F, Jolley D, Hocking B, Thompson S, Hyland B.
Cardiovascular risk factors for people with mental illness. Aust N Z J Psychiatry 2001;35:196-202.
- Barreira P.
Reduced life expectancy and serious mental illness. Psychiatr Serv 1999;50(8):995.
- Harvard Mental Health Letter. Mental illness and medical care. Cambridge
(MA): Harvard University; 2003.
- Mirza I, Phelan M. Managing physical illness in people with serious mental illness. Hosp Med 2002;63(9):535-9.
- Phelan M, Stradins L, Morrison S.
Physical health of people with severe mental illness. BMJ 2001;322:443-4.
- Byng R.
Physical care for patients with mental illness. Practitioner 2004;248:440-5.
- Beecroft N, Becker T, Griffiths G, Leese M, Slade M, Thornicroft G.
Physical health care for people with severe mental illness: the role of the
general practitioner (GP). J Ment Health 2001;10(1):53-61.
- Lloyd C, Sullivan D. NEW solutions: an Australian health promotion programme for people with mental illness. Int J Therapy Rehab 2003;10(5):204-10.
- Kane CF, Blank MB.
NPACT: enhancing programs of assertive community treatment for the seriously mentally ill. Community Ment Health J 2004;40(6):549-59.
- National Association of Social Workers. National Association of Social
Workers news, May. Washington (DC): National Association of Social Workers; 2003.
Back to top
|
|
