Volume
8: No. 3, May 2011
Namvar Zohoori, MD, MPH, PhD; LeaVonne Pulley, PhD; Camille Jones, MD, MPH; John Senner, PhD; Hylan Shoob, PhD; Robert K. Merritt, MA
Suggested citation for this article: Zohoori N, Pulley L, Jones C, Senner J, Shoob H, Merritt RK. Conducting a statewide health examination survey: the Arkansas Cardiovascular Health Examination Survey (ARCHES). Prev Chronic Dis 2011;8(3):A67.
http://www.cdc.gov/pcd/issues/2011/may/10_0134.htm. Accessed [date].
PEER REVIEWED
Abstract
Introduction
The Arkansas Cardiovascular Health Examination Survey is a health and nutrition examination survey designed to serve as a demonstration project for collection of data on the prevalence of chronic diseases and their risk factors at the state level. The
survey was conducted from mid-2006 through early 2008.
Methods
We chose a cross-sectional representative sample of adult residents in Arkansas
by using a 3-stage, cluster sample design. Trained interviewers conducted interviews and examinations in respondents’ homes, collecting data on risk factors
and diseases, blood pressure and anthropometric measurements, and blood and urine samples for analysis and storage. Food frequency questionnaires provided dietary and nutrient intake data. We accomplished
the project using a collaborative model among several programs and partners within the state.
Results
A total of 4,894 eligible households were contacted by
telephone. Of these, refusals accounted for 2,748, and 2,146 gave initial consent to
participate, for an initial response rate of 44%. The final number of completed
household visits was 1,385, resulting in a final response rate of 28.3%.
Conclusion
The Arkansas Cardiovascular Health Examination Survey is among the first state-level health and nutrition examination surveys to be conducted in the United States. By using a collaborative model and leveraging federal funds,
we engaged several partners who provided additional resources to complete the project. The survey provides the state with valuable state-level data and information for program design and delivery.
Back to top
Introduction
States rely on the Behavioral Risk Factor Surveillance System (BRFSS) as the main source of state-level surveillance data. However, BRFSS is conducted via telephone interviews, collecting self-reported information. Self-reports do not present a complete picture of many chronic diseases, because self-report cannot provide information on undiagnosed disease or levels of control and respondent recall may be incomplete. Nationally, the National Health and Nutrition Examination Survey (NHANES)
provides information on measured risk factors and diseases. However, these findings may not be applicable to individual states, and they do not influence local policy makers as much as
do local data. There are no published reports of state-level health examination surveys, and to our knowledge the New York City Health and Nutrition Examination Survey is the only reported local example in the United States (1).
The Centers for Disease Control and Prevention (CDC) has provided funding to 4 states to conduct demonstration projects for the design, implementation, and completion of health examination surveys. Arkansas, Kansas, and Washington
were funded in 2005, and Oklahoma was funded in 2007. To assess different approaches, CDC gave each state considerable freedom in methods
by requiring only collection of data on blood pressure and cholesterol levels and adequate sampling of a designated
priority population.
We report on the methods used in the Arkansas Cardiovascular Health Examination Survey (ARCHES)
(Table 1). ARCHES collected data on a representative sample of noninstitutionalized adult Arkansans with oversampling of the black population, which was designated as our priority population because of its many health disparities in Arkansas. Interviews were conducted from mid-2006 through early 2008. ARCHES was a
1-time activity, with goals of 1) providing the Arkansas Department of Health
(ADH) with data to implement population-based programs and policies for prevention and control of major chronic diseases and 2) serving as a demonstration project for a state-level health examination survey
on the prevalence and risk factors for chronic diseases.
Back to top
Methods
Funding, collaboration, and scope
The CDC Division for Heart Disease and Stroke Prevention provided initial funding for ARCHES ($760,000 over 2 years), through the ADH
Heart Disease and Stroke Prevention program. To maximize the scope of ARCHES, we used this funding to encourage participation from several partners, which resulted in funding, donated materials,
volunteer assistance, and collaboration
from many programs within ADH and several external collaborators (Figure 1). Total cash available became $1.08 million. With
this additional funding, we expanded ARCHES beyond its initial CDC mandate and included several questionnaire domains, covering many risk factors and health conditions, and the collection of examination data, including anthropometric measures and biological samples. The Science Review Council of the ADH and its institutional review board approved all protocols, instruments, procedures, consent forms, and other documents used for recruitment and data collection.
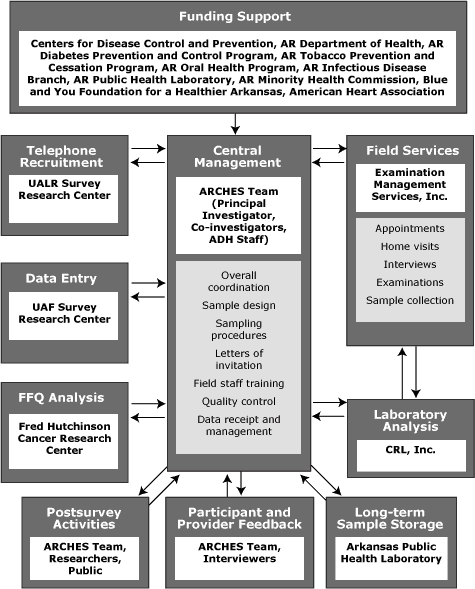
Figure 1. Arkansas Cardiovascular Health Examination Survey (ARCHES) collaboration model and flow of information. Abbreviations:
AR, Arkansas; UALR, University of Arkansas at Little Rock;
ADH, Arkansas Department of Health; UAF, University of Arkansas at Fayetteville; FFQ, food frequency questionnaire; CRL, Clinical Reference Laboratories. [A
text description of this figure is also
available.]
Sample
ARCHES was a population-based, cross-sectional survey of noninstitutionalized adult
(aged ≥18 y) residents in Arkansas, using a 3-stage clustered sample design (Table 1). In the first stage, we divided the 623 inhabited census tracts into 1) 188 tracts with a black population greater than 22.7% and 2) the remaining 435 tracts. We designated the first group, and the 5 largest tracts from the second group, as certainty clusters
(ie, they were included in the sampling frame). We selected an additional 182
clusters from the remaining 430 tracts by using
probability proportional to size, resulting in 375 sampled clusters. In the
second stage, letters were sent to a random sample of households within the
selected clusters, and then we randomly called households in each cluster until
we had 4 households in that cluster that agreed to participate. In the third
stage, in each selected household we determined the number of adults and
sampled 1 person by using a computerized algorithm based on Kish sampling
methods (2,3). If this person refused to participate, the next household on the
list was called, until 4 respondents had agreed in each sampled cluster.
Our goal was to recruit approximately 1,500 participants, based on available funding and sample size calculations indicating that a sample of 1,344 would yield statistical power adequate to compare blacks and whites for several key cardiovascular variables. We verified the adequacy of the sample size by simulating results using BRFSS household data, Census 2000 racial data, and NHANES prevalence data.
We weighted the data in 2 steps to represent the Arkansas population. First, to account for the complex sampling plan, we computed a structural weight as the product of the inverse of the cluster sample probability (1 for certainty sample tracts, otherwise as computed by PROC SURVEYSELECT of SAS [SAS Institute, Inc, Cary, North Carolina]), households per sampled tract represented by each sample household, and adults per sampled household represented by each sample adult. Second, we accounted
for nonresponse by using a postsampling weight that adjusted age, race, and sex categories to the
2007 Arkansas population estimates (4).
Study population
Exclusion criteria were not speaking English and having psychiatric, cognitive, or developmental disorders,
which were identified during the recruitment call. We excluded non-English speakers because, at the time of sampling, only 5% of the state’s population were estimated to be Hispanic — not enough to form a significant part of the sample — and funding limitations did not allow oversampling of this subgroup.
We recruited participants through a letter followed by a telephone call. We
first mailed letters and brochures (written at an average 7th-grade level) to
selected households, explaining the survey and informing them that a telephone
call would be made on behalf of ADH asking for participation of a person from the household. Within 2 weeks, we made calls to households
to explain the survey, answer questions about it, and ask for enough household information to allow random
selection of 1 person.
We briefly screened the selected person by telephone to ascertain eligibility, to answer the participant’s questions about the survey, and to obtain initial verbal consent for participation. We then made an appointment with the selected person for an in-person interview and examination, at a location of the participant’s choosing (in all cases, the home of the participant). We informed participants
that blood and urine samples would be taken and asked them to fast overnight
unless there were medical reasons not to. We also informed participants about benefits of participation, including the service that they would provide, provision of all laboratory test results (valued at approximately $260) to each participant, and gift cards of up to $50 ($40 for home visits and $10 for a returned Food Frequency Questionnaire [FFQ]).
Data collection
To maximize participation and data completeness, we completed the interview, examination, and collection of blood and urine samples in 1 home visit. The only exception was the FFQ,
which we left with the participant with instructions for completion and return
to ADH, using self-addressed and stamped envelopes. Home visits ranged from 60 to 90 minutes, depending on skip patterns for questions and ease of anthropometric measurements and sample collection. Examination Management Services,
Inc (EMSI) (Irving, Texas), a provider of specimen collection services for clinical trials and epidemiologic studies, collected
all data.
Interviewers were nurses or other health professionals employed by EMSI and trained in phlebotomy and interviewing and examination techniques. In addition, we required that interviewers take training courses related to human subjects research and Health Insurance Portability and Accountability Act (HIPAA) privacy rules and participate in a 3-day training and certification session conducted by ARCHES investigators. Training included administering the questionnaire and standard protocols for
drawing blood, measuring blood pressure, and performing anthropometric measurements. In accordance with Arkansas law, we also trained interviewers
to follow required procedures if they observed child or adult abuse while in homes.
| Box. Major Content Areas of the Arkansas Cardiovascular Health Examination Survey Questionnaires and Physical Examination |
Questionnaire Domains
- General health and access to care
- Perceived stress
- Physical functioning (Activities of Daily Living and Instrumental Activities of Daily Living)
- Medical conditions and family medical history
- Diabetes
- Hypertension
- Knowledge of signs and symptoms of heart attack and stroke
- Cholesterol
- Aspirin use
- Oral health
- Physical activity
- Sleep disorders
- Fruit and vegetable consumption
- Self-reported weight and weight management
- Tobacco use and exposure
- Alcohol consumption
- Occupation
- Social support and depression
- Demographic information and housing
- Health insurance
- Food security
- Complementary and alternative medicine use
- Reactions to race
- Hepatitis C risk factors
- List of all medications and supplements
- Food Frequency Questionnaire
Physical Examination
- Weight
- Height
- Abdominal circumference
- Arm circumference
- Pulse (3 readings throughout interview)
- Blood pressure (3 readings throughout interview)
Blood and Urine Tests
- Blood chemistry panel (alanine, albumin, alkaline phosphatase, aminotransferase, aspartate aminotransferase, bicarbonate, direct/indirect bilirubin, calcium, chloride, cholesterol, creatinine phosphokinase, creatinine, gamma-glutamyl transpeptidase, iron, phosphate, lactate dehydrogenase, lipase, magnesium, potassium, sodium, total bilirubin, total protein, and triglycerides)
- Complete blood count (hematocrit, hemoglobin, mean corpuscular hemoglobin, mean corpuscular hemoglobin concentration, mean corpuscular volume, red blood cell count, white blood cell count, and differential counts)
- Calcium
- Cystatin C
- Fasting glucose
- Fasting serum insulin
- Hemoglobin A1c (for known diabetics only)
- High sensitivity C-reactive protein
- Homocysteine
- Parathyroid hormone
- Serum cotinine
- Urinary albumin-to-creatinine ratio
|
The ARCHES questionnaire consisted of up to 285 questions (depending on skip patterns) covering behavioral, psychosocial, socioeconomic, and demographic variables, personal and family medical history, cardiovascular and other chronic disease risk factors, health care access, and other subjects (Box). Questions were mainly from BRFSS (5) and NHANES (6). The complete questionnaire was pretested through cognitive interviews with a convenience sample of low-income community volunteers, and
necessary changes were made. Nutrient intake data were collected by using the FFQ developed by the Nutrition Assessment Shared Resource (7) of the Fred Hutchinson Cancer Research Center (FHCRC). Questionnaires are available on the ARCHES page of
the ADH website (http://www.healthy.arkansas.gov/ programsServices/chronicDisease/Initiatives/ Pages/Arches.aspx).
After the participant provided written informed consent, interviewers administered the questionnaire and recorded responses on paper forms. Interviewers also examined medicine bottles for all medications (prescribed and over-the-counter, including dietary supplements), and recorded medication names. We measured participants’ height, weight, and abdominal circumference by using standard NHANES protocols, while
they wore light clothing and no shoes. We used a Tanita digital, self-calibrating
scale (model HD-351) (Tanita Corporation of America, Inc, Arlington Heights,
Illinois) to measure weight. After measurement of arm circumference and use of
an appropriate-sized cuff, interviewers recorded blood pressure 3 times at
intervals during the interview process by using standard protocols (6), with an Omron HEM-907XL monitor (Omron Healthcare, Inc, Bannockburn, Illinois). For each recording, the monitor recorded the average of 3 separate readings, for up to 9 readings and 3
recordings.
After administering the questionnaire and taking anthropometric measurements, interviewers collected blood and urine samples. Interviewers placed the samples in containers with frozen-gel bags, processed them in the field
according to protocols provided by
Clinical Reference Laboratories, Inc (CRL) (Lenexa, Kansas), and shipped them to
CRL, a
laboratory certified according to the CDC Lipid Standardization Program
(http://www.cdc.gov/labstandards/lsp.html), for analysis and reporting. The
laboratory also froze aliquots of blood and urine and shipped them to ADH
for storage and future analyses.
We managed all activities, including tracking of interviews, movement of
forms and biological samples, data entry, and quality control, centrally at ADH, through contracts with several external entities (Figure 1). After completing the interview, EMSI personnel shipped questionnaires, forms, and biological samples to CRL, where blood and urine samples were further processed and analyzed. CRL sent the results of analyses, along with
forms and questionnaires, to ADH, where they were logged and entered in the main
database. The University of Arkansas at Fayetteville Survey Research Center
scanned the main questionnaires, digitized the data, and transmitted them
electronically to ADH. ADH personnel logged and shipped the FFQs that had been mailed back by participants to FHCRC for analysis. FFQ
results were electronically transmitted back to ADH. After all data were received and entered into the main database, we
created an analysis dataset, stripped of personal identifiers, for use in further analyses.
We took several steps to ensure data integrity and quality. One of the senior investigators telephoned a 5% random subsample of respondents within a few days of the interviews to ascertain interviewer accuracy and find out about participants’ experiences with the interviewers. We reported inaccuracies or problems to EMSI for corrective action. Before scanning and data entry, we hand-checked all questionnaires for readability, correct skip patterns, and missing data, and made
corrections to the extent possible (calling respondents when needed). We pulled a 5% random subsample of paper copies of the main questionnaires and checked them against the electronic data to ensure accuracy in digitization. We hand-checked all FFQs before scanning and analysis. Laboratory analyses were subject to internal laboratory standards and checks by CRL
and to range and consistency checks of all data by ARCHES staff.
Interviewers informed respondents with high blood pressure of their measurements and advised them to seek appropriate medical care. We monitored the results of blood and urine tests as they were received by ARCHES; respondents with results above predetermined critical values were contacted immediately and advised to seek medical attention, with an offer to fax results directly to their health care provider. We sent all blood and urine results, within 2 weeks
of receipt, to each respondent along
with a cover letter, with abnormal values flagged for attention and discussion with their health care provider.
Back to top
Results
Of the 6,508 households contacted by telephone, 4,894 were eligible. Of these, refusals accounted for 2,748, and 2,146 gave initial consent to participate, for an initial response rate of 44%. The final number of completed household visits was 1,385, resulting in a CASRO (Council of American Survey Research Organizations) response rate of 28.3% (Figure 2).
Figure 2. Response rate calculation (using Council of American Survey Research Organizations formula) for Arkansas Cardiovascular Health Examination Survey sample. The response rate was the number who completed surveys (1,385) divided by the sum of the number who were eligible and initially consented (2,146) plus the estimated number who were eligible among those who refused (2,748): 1,385/(2,146 + 2,748) = 28.3%.
[A text description of this figure is also
available.]
Among completed visits, 1,265 (91.3%) participants also mailed in their FFQs, and 1,202 (86.8%) gave consent to freezing biological samples
for future analyses. Also, 1,115 (80.5%) consented to future contact for follow-up surveys.
Compared with the state population, the ARCHES sample had a higher proportion of women (66.9% vs 51.7%), a higher proportion of blacks (23.8% vs 14.9%), and an older age distribution
(Table 2). Median annual household income for the sample, about $35,000, was just slightly lower than the state median income of about $36,600 in 2007 (8), the time when the sample was developed.
Back to top
Discussion
In organizing ARCHES, we had 3 goals: 1) to foster collaboration among programs, 2) to leverage CDC funds, and 3) to minimize
the burden on resources of the health department. We achieved the first 2 goals by approaching a number of internal programs and external partners and encouraging their participation. This resulted in additional cash funding from 8 entities (Figure 1), with a 1.42:1 ratio of total cash available to that provided by CDC. We achieved the third goal by contracting with
different entities to carry out much of the work, such as initial recruitment, setting appointments, conducting interviews and examinations, data entry, and laboratory analyses (Figure 1). Using this approach, each completed survey cost about $780. However, as a potential future ongoing surveillance effort, efficiency can be improved by using a different approach, focusing on higher priority data collection, and eliminating sample storage.
The tasks of overall coordination, data management, and quality control were
maintained by the staff at ADH, directed by the principal investigator and the
co-investigators — a collaboration between ADH, the Fay W. Boozman College of Public Health at the University of Arkansas for Medical Sciences, and the Arkansas Minority Health Commission. This aspect of ARCHES, the ability to partner with many entities, was a major accomplishment of the project and
a factor in its successful
completion.
We completed interviews and examinations on 1,385 people, exceeding the goal of 1,344. Our sample was older
and had a higher proportion of women than the Arkansas adult population (9). This is not surprising for a household survey (10) and was probably further influenced by our use of landline telephones only. At the time of sampling, cellular telephone numbers linked to addresses at census tract level (our primary sampling unit) were not publicly available; therefore,
we were compelled to use
landlines. Also, our BRFSS survey in 2007 was landline-based, facilitating eventual comparison of ARCHES results with BRFSS. The higher proportion of blacks in ARCHES was by design, fulfilling the CDC requirement of oversampling 1 priority population. All 3 of these differences were taken into account in the individual survey sampling weights, and the use of analytic software that allows accommodation for these sampling factors. Approximately one-third of those giving initial consent were
either unable to be scheduled or declined to be scheduled for the in-home visit. This rate is close to that of the national REGARDS
study, which used similar methods (11). Although the 28% CASRO response rate may be of some concern, there are no similar published state-level studies
for comparison. However, the acceptable range of individual sampling weights (0.23-3.08) and the similar household incomes of participants and nonparticipants increase our confidence in the
representativeness of the weighted sample.
ARCHES has provided ADH with a large amount of data that are being used to generate much-needed health information. Some of this information, such as levels of undiagnosed or uncontrolled disease (eg, hypertension, diabetes) and risk factors (such as overweight and obesity), is available for the first time at the state level. The data
differ greatly from those obtained from self-reported BRFSS surveys.
For example, obesity, hypertension, and diabetes are 50% to 55% more prevalent
than indicated by BRFSS data (unpublished data). The data provide the ADH
programs, researchers, and clinicians with information necessary to address the
state’s worsening public health problems. Already the data have been used to
inform policy makers and legislators about the more prevalent chronic diseases
in the state and have resulted in a legislative request for an interim study of
hypertension in Arkansas. The data are also being used by ADH, public health researchers, and students to analyze specific patterns of consumption, risk factors, and diseases
in the state, leading to program development and improvement. In addition, the bank of frozen biological specimens will be used for future studies of risk factors and diseases in the state.
Conducting a state-level health examination survey was challenging. Arkansas’s model shows that by working with internal and external partners, and by contracting out major survey tasks, it is possible to conduct such a health examination survey without putting undue burden on the human and financial resources of the health department. The local information provided can be of benefit in addressing chronic diseases at the state level. This benefit, however, can
be fully realized only if such surveys are repeated regularly, allowing states to track changes and effects of policies and programs. On the basis of our experience with ARCHES, we believe that repeating such surveys approximately every 5 years is feasible and has the potential to provide timely information for monitoring progress toward intermediate and long-term goals related to outcomes.
Back to top
Acknowledgments
We thank the staff at the following institutions for their help in various aspects of the survey: ADH, University of Arkansas for Medical Sciences Fay W. Boozman College of Public Health, Arkansas Minority Health Commission, Abbott Renal Care Inc, EMSI, CRL, the Survey Research Centers of the University of Arkansas at Little Rock and at Fayetteville, Fred Hutchinson Cancer Research Center, American Heart
Association, and Blue and You Foundation for a Healthier Arkansas. Direct funding support for ARCHES was received from CDC, Abbott Renal Care Inc,
Blue and You Foundation for a Healthier Arkansas, Arkansas Minority Health Commission, and the following programs at the Arkansas Department of Health: Tobacco Prevention and Cessation Program, Diabetes Prevention and Control Program, and the Oral Health Program.
Back to top
Author Information
Corresponding Author: Namvar Zohoori, MD, MPH, PhD, Chronic Disease Director and Associate Director of Science, Center for Health Advancement, Arkansas Department of Health, 4815 West Markham St, Slot 6, Little Rock, AR 72205. Telephone: 501-661-2546. E-mail:
Namvar.Zohoori@arkansas.gov.
Author Affiliations: LeaVonne Pulley, Fay W. Boozman College of Public Health, University of Arkansas for Medical Sciences, Little Rock, Arkansas; Camille Jones, Arkansas Minority Health Commission, Little Rock, Arkansas; John Senner, Arkansas Department of Health, Little Rock, Arkansas; Hylan Shoob, Robert K. Merritt, Centers for Disease Control and Prevention, Atlanta, Georgia.
Back to top
References
- Thorpe LE, Gwynn RC, Mandel-Ricci J, Roberts S, Tsoi B, Berman L, et al. Study design and participation rates of the New York City Health and Nutrition Examination Survey, 2004. Prev Chronic Dis 2006;3(3).
http://www.cdc.gov/pcd/issues/2006/jul/05_0177.htm. Accessed
April 22, 2010.
- Kish L, Anderson DW. Multivariate and multipurpose stratification. J Am Stat Assoc 1978;73(361):24-34.
- Kish L. A procedure for objective respondent selection within the household. J Am Stat Assoc 1949;44(247):380-7.
- National Center for Health Statistics. Vintage 2007 bridged-race postcensal
population estimates. http://www.cdc.gov/nchs/nvss/bridged_race/data_documentation.htm#vintage2007. Accessed
January 15, 2010.
- Behavioral Risk Factor Surveillance System survey questionnaire. Atlanta (GA): US Department of Health and Human Services, Centers for Disease Control and Prevention; 2006.
- National Health and Nutrition Examination Survey questionnaire and examination protocol. Atlanta (GA): US Department of Health and Human Services, Centers for Disease Control and Prevention;
2005-2006. http://www.cdc.gov/nchs/nhanes/nhanes2005-2006/nhanes05_06.htm. Accessed
November 12, 2005.
- Schakel SF. Maintaining a nutrient database in a changing marketplace: keeping pace with changing food products — a research perspective. J Food Comp Anal 2001;14:315-22.
- Small area income and poverty estimates. Final release date 2008. Washington (DC):
US Census Bureau. http://quickfacts.census.gov/qfd/states/05000lk.html. Accessed May 2010.
- Blumberg SJ, Luke JV. Wireless substitution: early release of estimates from the National Health Interview Survey, July-December 2008. National Center for Health Statistics.
http://www.cdc.gov/nchs/data/nhis/earlyrelease/wireless200905.htm. Accessed
April 21, 2010.
- Centers for Disease Control and Prevention. Behavioral Risk Factor Surveillance System 2009
summary data quality report (version #1 – Revised 04/27/2010). ftp://ftp.cdc.gov/pub/Data/Brfss/2009_Summary_Data_Quality_Report.pdf. Accessed
April 22, 2010.
- Howard VJ, McClure LA, Meschia JF, Pulley L, Orr SC, Friday GH.
High prevalence of stroke symptoms among persons without a diagnosis of stroke or
transient ischemic attack in a general population: the REasons for Geographic And Racial Differences in Stroke (REGARDS)
study. Arch Intern Med 2006;166(18):1952-8.
Back to top
