Volume
8: No. 1, January 2011
Suggested citation for this article: Ma M, McClintock S. Regression model fitting with quadratic term leads to different conclusion in economic analysis of Washington state smoking ban [letter]. Prev Chronic Dis 2011;8(1):A26.
http://www.cdc.gov/pcd/issues/2011/jan/10_0213.htm. Accessed [date].
To the Editor:
Authors of a recent article studied the economic effect of a 2006 smoking ban on bars and taverns in Washington State (1). Their findings of higher-than-expected taxable sales in bars and taverns could have a broad influence on future policy
decisions in other states that still do not have these laws.
We found some issues with the authors’ methods. The authors used taxable retail sales (TRS) data from 2002 through 2007 to fit the following regression model:
ln(TRS_bar)i = b0 + b1SFLi + b2Q2i + b3Q3i + b4Q4i + b5ti + b6SFLi ti+ b7UNEMPi + b8lnPOPi + b9lnINCi + ei
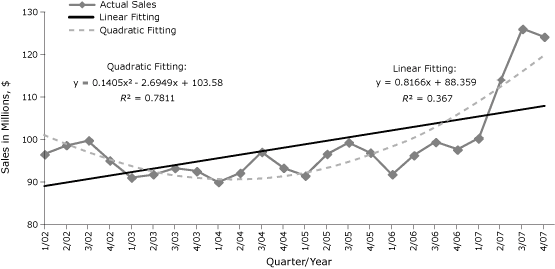
Based on the raw TRS data provided to us by the authors (Table 1) the taxable retail sales from 2002 to 2005 or 2007 do not seem to follow a linear trend over time. Instead, the overall trend from 2002 to 2005 or 2007 seems to be parabolic. Thus, the quadratic model is a better fit for the data than the linear model (Figure).

Figure. Comparison of regression fit to taxable retail sales in bars and taverns in Washington State after the implementation of a smoke-free law, from the first quarter of 2002 (1/02) through the fourth quarter of 2007 (4/07). Values are adjusted
for inflation to the
Consumer Price Index (www.bls.gov/cpi/). [A
tabular version of this figure is also available.]
We fit the TRS data provided by the authors to a regression model with a quadratic term as well as a model without a quadratic term. Although the variables unemployment, population, and income were unavailable, we used all other variables in our model. The model with the quadratic term provided a better fit (R2 = 0.95) than the model without the quadratic term (R2 = 0.89). Also, with the quadratic time term in the model, the time by smoking ban interaction
is no longer significant, which suggests that the smoking ban did not affect the taxable sales revenue over the time. This result contradicts the authors’
conclusion that the smoking ban had an effect on taxable retail sales. Our model, without the quadratic term, predicts a $98.5 million increase during the 2 years after implementation of the smoke-free law. This is close to the $105 million predicted by the authors, and the difference is presumably accounted for by the absence of
unemployment, population, and income variables in our model. However, if we include the quadratic term our model shows a $42.3 million decrease in taxable retail sales during the 2 years after implementation of the smoke-free law (Table 2). Inclusion of a quadratic term leads to considerably different conclusions.
Marshal Ma, BMed, MPH, MS
Pennsylvania Department of Health
Harrisburg, Pennsylvania
Scott McClintock, PhD
West Chester University
West Chester, Pennsylvania
Back to top
Reference
- Boles M, Dilley J, Maher JE, Boysun MJ, Reid T. Smoke-free law associated with higher-than-expected taxable retail sales for bars and taverns in Washington State. Prev Chronic Dis 2010;7(4).
http://www.cdc.gov/pcd/issues/2010/jul/09_0187.htm. Accessed October 4, 2010.
Back to top
