Volume
8: No. 1, January 2011
Sharon G. Bruce, PhD; Natalie D. Riediger, MSc; James M. Zacharias, MD, MSc; T. Kue Young, MD, DPhil
* This article is part of a joint publication initiative between Preventing Chronic Disease and Chronic Diseases in Canada. Preventing Chronic Disease is the
primary publisher, while Chronic Diseases in Canada is the secondary publisher.
Suggested citation for this article: Bruce SG, Riediger ND, Zacharias JM, Young TK. Obesity and obesity-related comorbidities in a Canadian First Nation population. Prev Chronic Dis 2011;8(1):A03.
http://www.cdc.gov/pcd/issues/2011/jan/09_0212.htm.
Accessed [date].
PEER REVIEWED
Abstract
Introduction
Rates of obesity are higher among Canada’s
Aboriginal First Nations populations than among non-First Nations populations. We studied obesity and obesity-related
illness in a Manitoba First Nation community.
Methods
We conducted a screening study of diabetes and diabetes complications in 2003,
from which we drew a representative sample of Manitoba First Nations adults (N = 483). We assessed chronic disease and chronic disease risk factors.
Results
Prevalence of obesity and associated comorbidities was higher among women than men.
By using multivariate analysis, we found that factors significantly associated with obesity among women
were diastolic blood pressure, insulin resistance, and employment status. Among men, factors
were age, apolipoprotein A1 level, apolipoprotein B level, and insulin resistance.
Seventy-five percent of study participants had at least 1 of the following
conditions: obesity, dyslipidemia, hypertension, or diabetes.
Comorbidity was high even among the youngest age groups; 22% of men and 43% of women aged 18 to 29 had 2 or more chronic conditions. Twenty-two percent of participants had undiagnosed hypertension. Participants with undiagnosed hypertension had significantly more chronic conditions and
were more likely to have microalbuminuria than were those without hypertension. The number of chronic conditions was not significantly different for participants
with newly diagnosed hypertension than for those with previously diagnosed
hypertension.
Conclusions
The prevalence of obesity and other chronic conditions in the study community is high, especially considering the number of young people. Community-based interventions are being undertaken to reduce the excessive rate of illness.
Back to top
Introduction
The Canadian First Nations population has poorer overall health than does the general Canadian population (1), specifically in terms of chronic diseases, chronic disease risk factors (2), and injuries and accidents (3). In Canada, First Nations peoples are 1 of 3 constitutionally recognized Aboriginal groups; the other 2 are the Métis and the Inuit. In this article, we use the term
Aboriginal to report on research that included 2 or more of these distinct groups
if no distinction was made between the groups in the analysis. However, if the
research included only 1 group, we have identified that group. According to the
2005-2006 Canadian Community Health Survey, the prevalence of obesity among
people who self-identified as Aboriginal and who did not live on reserve land
was 20% in Canada’s north (Yukon, Northwest Territories, and Nunavut) and 23% in the rest of Canada (4).
Obesity prevalence appears to be higher among First Nations people living on reserves. In Sandy Lake, Ontario, the prevalence of obesity (body
mass index [BMI] ≥30 kg/m2) was 50% for men and 65% for women (5). Furthermore, in a First Nation community in Quebec, 91% of study participants from a sample of 172 were abdominally obese (6).
The prevalence of obesity was 55% among a sample of Alberta First Nations people and 49% among a sample of Métis people
(7).
Prevalence of obesity-related comorbidities is also high among Canadian First Nations peoples. The prevalence of diabetes among Canadian First Nations populations is 3 to 5 times
higher than among the general Canadian population (5-8). Hypertension, dyslipidemia, metabolic syndrome, and diabetes complications such as cardiovascular disease (CVD), stroke, retinopathy, neuropathy, and nephropathy are also major contributors to poor health (2,5-10). CVD is
one of the leading causes of death in Canada, and
Aboriginal populations have twice the
CVD death rate of non-Aboriginal populations (2). In a random sample, the rate of
CVD was 18% among Canadian Aboriginal people and 8% among people of European ancestry (2).
Despite the evidence of excess obesity, diabetes, and related metabolic conditions among Canada’s First Nations populations, few researchers have investigated their coexistence in this population.
Our purpose was to explore the magnitude and effect of obesity and obesity-related comorbidities in a Manitoba First Nation.
Back to top
Methods
Our methods have been previously described (10). Briefly, 483 eligible residents of a Manitoba First Nation community volunteered in 2003 to participate in a screening study for diabetes and diabetes complications. A total of 1,356 eligible participants included nonpregnant adults aged 18 years or older who were
Registered Indians and who were residents of the community. Our sample (36%, 483 of 1,356) is representative of eligible participants by age and sex (10). A registered nurse drew venous samples
to measure glucose, hemoglobin A1c, insulin, total cholesterol, high-density lipoprotein (HDL) cholesterol, triglycerides, apolipoprotein A1
(apoA1), total apolipoprotein B (apoB), and homocysteine levels from fasting participants (low-density lipoprotein [LDL] cholesterol was calculated).
A registered nurse or trained research assistant administered a 17-item questionnaire that included standard demographic data (age, sex, employment status, education level), current and past smoking status, number of cigarettes smoked per day, previous diagnosis of diabetes and hypertension (“Have you ever been told by a doctor that you have diabetes? How long have you had diabetes?”), and current medication use.
Standard techniques were used to obtain
anthropometric measures (11). Height was measured via metric wall tape and set square to the nearest 0.5 cm; weight was measured on a balance scale to the nearest 0.1 kg; waist
circumference was measured at noticeable waist narrowing or at the level of the 12th rib, to the nearest 0.5 cm; and hip circumference was measured at the level of the symphysis pubis and the largest area of the buttocks to the nearest 0.5 cm (11).
Abdominal obesity was defined as waist circumference greater than 102 cm for men and greater than 88 cm for women (10). Diabetes
was defined as a fasting plasma glucose of 7.0 mmol/L or higher, or a previous diagnosis; impaired fasting glucose
was defined as a fasting plasma glucose of 6.1 to 6.9 mmol/L (12). Hypertension
was defined as systolic blood pressure higher than 140 mmHg or diastolic blood
pressure higher than 90 mmHg, or a previous diagnosis. Dyslipidemia
was defined as a plasma triglyceride level of 1.7 mmol/L or higher and HDL
cholesterol level of 1.03 mmol/L or less for men or 1.30 mmol/L or less for women. Metabolic syndrome
was defined using Adult Treatment Panel III criteria (13). Insulin resistance
was estimated through the homeostasic model assessment (HOMA), which is
calculated as follows: [(insulin [pmol]
x 0.139) x (glucose [mmol/L]/22.5)]. Microalbuminuria was defined as an
albumin-to-creatinine ratio higher than 2.0 mg/mmol for men and higher than 2.8
mg/mmol for women. Neuropathy was defined as presence of numbness, tingling,
pain, and loss of protective sensation determined through application of the
10-g Semmes-Weinstein monofilament wire system (Sensory Testing Systems, Baton
Rouge, Louisiana) (14). A registered nurse completed the foot examination and applied
the 10-g monofilament. The University of Manitoba Health Research Ethics Board
approved the project.
Statistical analyses were completed by using SPSS version 16 for Windows
(IBM, Chicago, Illinois). We used χ2 tests to detect differences between the sexes for chronic disease prevalence, risk factors, and sociodemographic variables. We compared differences between the sexes on variables that were continuously distributed
by using t tests or Mann-Whitney tests for variables with a nonnormal distribution. Differences in the number of chronic health conditions by
age group and sex and number of comorbidities by hypertensive status were determined by using χ2 tests. Tests were 2-tailed and
differences were considered significant at P < .05. We used logistic regression to estimate odds ratios
(ORs) for obesity and microalbuminuria with 95% confidence intervals (CIs). Participants with missing values were excluded from analyses. No pattern was found for missing values by sex, age group, chronic disease, or risk factor variables.
Back to top
Results
The demographic and health status characteristics of the study sample describe a young population with low education and high unemployment
(Table 1). The prevalence of
smoking, diabetes, hypertension, and overweight and obesity was high among study
participants. Waist circumference was available for 259 of the 264 obese
participants; 96% (250 of
259) had waist circumferences that placed them at high risk for adverse health outcomes (9). We found no significant differences between men and women in
prevalence of diabetes or hypertension. However, the prevalence of dyslipidemia among women (38%) was significantly higher than among men (26%).
Overall obesity and abdominal obesity
We used BMI and waist circumference to classify participants as obese by age and sex (Figure 1). Almost 50% of men and 65% of women were obese as defined by BMI, and 53% of men and 81% of women had abdominal obesity. Obesity was more common among women than men according to BMI (χ2 = 14.62, P < .001) and abdominal obesity (χ2 = 41.38, P < .001). The prevalence of BMI ≥30 kg/m2 was higher among women aged 18 to
29 years than among men of the same age group (χ2 = 9.06, P < .01).
Abdominal obesity was significantly more common for women than for men in all age groups except 40 to 49 years. Three-quarters of women aged 18 to 29 years had abdominal obesity (Figure
1).
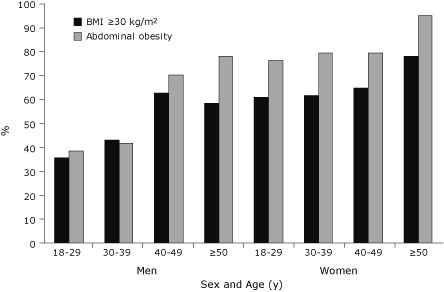
Figure 1. Prevalence of obesity by age and sex in a
Canadian First Nation population. BMI, body mass index. Abdominal obesity was
defined as waist circumference greater than 102 cm for men and greater than
88 cm for women. [A tabular version of this figure is also available.]
Given the differences in obesity between men and women and the high prevalence of abdominal obesity, we determined factors associated with abdominal obesity for each sex by using multivariable
backward stepwise logistic regression. Variables included in the models were those that were significantly associated with abdominal obesity in bivariate analyses. For women those variables were age; systolic and diastolic blood pressure; triglyceride, apoA1,
and apoB levels; insulin resistance;
education; and employment status. For men variables included in the model were age; systolic and diastolic blood pressure; triglyceride,
apoA1, and apoB levels; insulin resistance; and microalbuminuria
(Table 2).
For women, the odds of abdominal obesity increased with diastolic blood pressure and insulin resistance. In addition, the odds of obesity were lower for women who
were employed than for those who were unemployed. Among men, abdominal obesity was associated with increasing age, insulin resistance,
lower apoA1, and higher apoB levels.
Comorbidities
We determined the extent of comorbidity among this population for 4 chronic
conditions: obesity, diabetes, hypertension, and dyslipidemia. The distribution
of chronic conditions by age and sex (Figure 2) showed that women aged 18 to 29
and aged 50 or older had significantly more chronic conditions than men of the
same age groups. Twenty-two percent (16 of 73) of men and 43%
(30 of 69) of women aged 18 to 29 had 2 or more preventable chronic conditions. Among participants with abdominal obesity, 48%
(147 of 303) had hypertension and 35% (111 of 313) had diabetes. Thirty-seven percent
(54 of 147) of the hypertension and 26% (29 of 111) of diabetes cases among these
participants were undiagnosed.
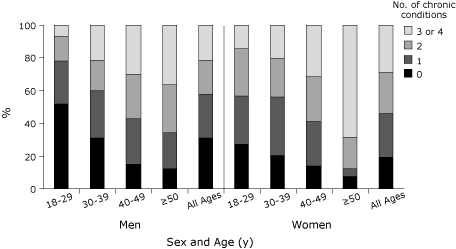
Figure 2. Percentage of sample with chronic conditions (obesity,
diabetes, hypertension, dyslipidemia) by age and sex in a Canadian First Nation
population. [A tabular version of this figure is also available.]
Undiagnosed hypertension
Overall, 22% (72 of
337) of study participants had undiagnosed hypertension. We compared the extent of comorbidity for participants with newly diagnosed hypertension and 2 groups: 1) participants who were not hypertensive and 2) participants with a previous diagnosis of hypertension
(Table 3). Participants with newly diagnosed hypertension were significantly more likely to have more chronic conditions than were the normotensive participants. However, we found no
significant differences in extent of comorbidity between those with newly diagnosed hypertension and those
with previously diagnosed hypertension. In terms of outcomes, the adjusted odds of microalbuminuria among people with newly diagnosed hypertension were
almost 2 times higher than among those without hypertension. The adjusted odds of microalbuminura among those with previously diagnosed hypertension were almost 5 times
higher than among those without hypertension.
Back to top
Discussion
The prevalence of obesity in the study population is among the highest reported for a Canadian First Nations community
on a reserve (6,7) and is substantially higher than that among the general Canadian (4) and off-reserve
Aboriginal populations (4,15), whether the studies used self-reported data (4,6) or direct measurement (15). The high prevalence of obesity
in the study population is concerning given the etiologic role of obesity in diabetes, heart disease, stroke, and some cancers.
The prevalence of diabetes that we found is one of the highest
reported among Canadian First Nation populations (6,7,16).
One finding of concern is the high prevalence of obesity among young adults, especially young women of reproductive age. The relationships between maternal obesity and gestational diabetes, type 2 diabetes, poor birth outcomes, and development of obesity and type 2 diabetes among offspring are well documented (17-20). Thus, the prevalence of obesity
in this young study population warrants intervention.
These findings are important for 2
reasons: 1) participants developed chronic conditions at young ages, and 2) hypertension and diabetes cases were undiagnosed among a large proportion of
obese participants.
Results from logistic regression confirmed established associations between obesity and plasma lipid
levels, hypertension, insulin resistance, and sociodemographic factors in the
study population. The sex-specific regression analyses did not include lipids for abdominal obesity among women. We offer 2 possible reasons for this. First, the prevalence of abdominal obesity
was high among women in all age groups but the presence of abnormal lipid levels was not. These age differences may have been blunted because our outcome
(obesity) was
present in all age groups. Second, previous research has shown significant sex differences in the relationship between adiposity and plasma lipids (21). Because abnormal lipid levels did occur among women, this finding warrants further examination.
We found a high prevalence of comorbidity even among the youngest age groups.
The Diabetes and Related conditions in Urban Indigenous people in the Darwin
region (DRUID) study also found high numbers of cardiovascular comorbidities among Australian Aborigines, and
a higher number of comorbidities with increasing age (22). A large proportion of the
study participants had undiagnosed diabetes and hypertension, despite the known strong correlations among obesity, diabetes, dyslipidemia, and
hypertension (23) (we could not determine the extent of undiagnosed dyslipidemia among study participants because we did not ask
them to self-report abnormal lipid levels). In a previous study, risk factors for not having blood pressure measured included male
sex, never being married, not having a regular physician, being younger, and belonging
to an Aboriginal or other ethnic minority group (24). In our study, the likelihood of not
having hypertension diagnosed was
higher for men (OR, 3.27; 95% CI, 1.74-6.10;
P < .01) and younger participants (OR, 1.04; 95% CI, 1.01-1.07; P < .001).
In our study, the undiagnosed hypertension was not benign. The extent of comorbidity among participants with newly diagnosed hypertension was similar to that for those with previously diagnosed hypertension. In addition, the risk for microalbuminuria was significantly
higher among participants with newly diagnosed hypertension compared with those without hypertension but not significantly different between those with newly diagnosed hypertension and those with previously diagnosed hypertension.
This suggests that newly diagnosed hypertension among participants had existed for some time. The association between hypertension and outcomes such as CVD and stroke warrants vigilant screening on the part of health care providers, especially in high-risk populations. Some participants in our
“newly diagnosed” group may have been told by a physician that they did have hypertension, but they may not have remembered or they may have not understood. However, none were receiving antihypertensive treatment, so they
probably had not received a hypertension diagnosis before our study.
The study is subject to limitations. First, our sample was based on volunteers and therefore may not be representative of the community as a whole or of other Canadian First Nations communities. A screening study based on a volunteer sample may attract primarily healthy people who are motivated to learn more about their health, resulting in an underestimation of illness. On the other hand, a screening study can attract people who already have health problems and are seeking additional
medical assistance, which may result in an overestimation of the prevalence of illness in a population. We do not think our sample was overrepresented by either group because men and women were equally represented, and the age distribution of our sample matched that of the eligible population (10). Another indication that the prevalence of illness in the community was not overstated is that only half of the community members known
to have diabetes participated in the study. None of the 15 people with end-stage renal disease participated, and only 3 of 10 community members with amputations participated (10).
The prevalence of chronic disease and risk factors that we report are not substantially out of line with previous research.
A second limitation is the use of a fasting glucose test rather than a glucose tolerance test. More people with diabetes may have been identified if 2-h glucose tolerance tests were conducted. However, our protocol is acceptable for epidemiologic research.
A third limitation is that we did not validate the self-reported hypertension or diabetes status measures with local health care providers, so we may have underestimated self-reported prevalence and therefore overestimated undiagnosed cases. However, we have
previously reported lack of adherence with standards of care in this community in relation to foot examinations among people with diabetes (10), so participants may not have been tested for diabetes and hypertension even when indicated. Finally, the study is cross-sectional, so we cannot infer
the temporal sequence of events.
The prevalence of obesity in this population is among the highest reported
among Canadian First Nation populations, particularly among women in their
reproductive years. The extent of obesity-related comorbidity in this population
is high even among young adults, and women at almost every age have a
significantly higher rate of comorbidity than do men. A sizable proportion of participants have undiagnosed hypertension that may have been
present for some time, given the significant associations with the other chronic diseases and microalbuminuria. The
prevalence of cardiovascular and renal disease risk factors
in this population may portend a larger prevalence of cardiovascular and renal disease. In addition, given the
influence of maternal obesity and diabetes on the health of offspring, an increase in childhood obesity and type 2 diabetes could occur in the community.
An increasing prevalence of obesity and obesity-related conditions is not inevitable,
however. Many prevention activities are under way. First, a research intervention in the community
is focused on preventing gestational diabetes through controlling weight gain during pregnancy with exercise and diet. Second, the community operates a fitness center that has good equipment and instruction. Third, the
health center offers education on diet, exercise,
and wellness. Fourth, walking groups for youth and adults are organized through the
health center. Fifth, activity programs for young
people operate out of the local schools. However, given the well-established effect of obesity on health, continued surveillance of chronic disease and risk factors is warranted, as are
further health promotion and health education initiatives. We continue
to work with the community to develop and evaluate primary and secondary prevention activities.
Back to top
Acknowledgments
We thank the Canadian Institutes of Health Research (CIHR) and the
Manitoba Health Research Council for their funding for this project. Dr
Riediger is the recipient of a CIHR Doctoral Canada Graduate Scholarship. We are grateful for the statistical assistance of Mary Cheang. Finally, we thank the study community, staff, and leadership for their participation and ongoing commitment.
Back to top
Author Information
Corresponding Author: Sharon G. Bruce, PhD, University of Manitoba, Department of Community Health Sciences, S113 Medical Services Bldg, 750 Bannatyne Ave, Winnipeg, MB Canada R3E 0W3. Telephone: 204-975-7745. E-mail:
brucesg@cc.umanitoba.ca.
Author Affiliations: Natalie D. Riediger, James M. Zacharias, University of Manitoba, Winnipeg, Manitoba, Canada; T. Kue Young, University of Toronto, Toronto,
Ontario, Canada.
Back to top
References
- Macaulay AC.
Improving aboriginal health: how can health care professionals contribute? Can Fam Physician 2009;55(4):334-9.
- Anand SS, Yusef S, Jacobs R, Davis AD, Yi Q, Gerstein H, et al.
Risk factors, atherosclerosis, and cardiovascular disease among Aboriginal people in Canada: the Study of Health Assessment and Risk Evaluation in Aboriginal Peoples (SHARE-AP). Lancet 2001;358(9288):1147-53.
- Allard YE, Wilkins R, Berthelot JM.
Premature mortality in health regions with high aboriginal populations. Health Rep 2004;15(1):51-60.
- Lix L, Bruce S, Sarkar J, Young TK.
Risk factors and chronic conditions among Aboriginal and non-Aboriginal populations.
Health Rep 2009;20(4):21-9.
- Connelly PW, Hanley AJ, Harris SB, Hegele RA, Zinman B.
Relation of waist circumference and glycemic status to C-reactive protein in the Sandy Lake Oji-Cree. Int J Obes Relat Metab Disord 2003;27(3):347-54.
- Chateau-Degat ML, Pereg D, Egeland GM, Nieboer E, Bonnier-Viger YV, Laouan-Sidi
EA, et al. Diabetes and related metabolic conditions in an aboriginal Cree
community of Quebec, Canada. Canadian Journal of Diabetes 2009;33(3):156-62.
- Oster RT, Toth EL.
Differences in the prevalence of diabetes risk-factors among First Nation, Metis and non-aboriginal attending screening clinics in rural Alberta, Canada. Rural Remote Health 2009;9(2):1170.
- Dyck R, Osgood N, Lin TH, Gao A, Stang MR.
Epidemiology of diabetes mellitus among First Nations and non-First Nations adults. CMAJ 2010;182(3):244-56.
- Gao S, Manns BJ, Culleton BF, Tonelli M, Quan H, Crowshoe L, et al.
Prevalence of chronic kidney disease and survival among aboriginal people. J Am Soc Nephrol 2007;18(11):2953-9.
- Bruce SG, Young TK.
Prevalence and risk factors for neuropathy in a Canadian First Nation community. Diabetes Care 2008;31(9):1837-41.
- Canadian Society for
Exercise Physiology. The Canadian Physical Activity, Fitness, and Lifestyle
Approach. 3rd edition. Ottawa, Ontario (CA):
CSEP; 2003.
- Canadian Diabetes Association 2008 clinical practice guidelines for the
prevention and management of diabetes in Canada. Canadian Journal of
Diabetes 2008;32(Suppl 1).
- Executive Summary of the Third Report of the National Cholesterol Education Program (NCEP) Expert Panel on Detection, Evaluation, and Treatment of High Blood Cholesterol in Adults (Adult Treatment Panel III). JAMA 2001;285(19):2486-97.
- Armstrong DG, Lavery LA. Clinical care of the diabetic foot. Alexandria (VA): American Diabetes Association; 2005.
- Garriguet D.
Obesity and the eating habits of the
aboriginal population. Health Rep 2008;19(1):21-35.
- Harris SB, Gittelsohn J, Hanley A, Barnie A, Wolever TM, Gao J, et al.
The prevalence of NIDDM and associated risk factors in native Canadians. Diabetes Care 1997;20(2):185-7.
- Aljohani N, Rempel BM, Ludwig S, Morris M, Cheang M, Murray R, et al.
Impact of diabetes on maternal-fetal outcomes in Manitoba. Relationship with ethnic and environmental factors. Clin Invest Med 2008;31(6):E338-45.
- Dunne F, Brydon P, Smith K, Gee H.
Pregnancy in women with type 2 diabetes: 12 years outcome data 1990-2002. Diabet Med 2003;20(9):734-8.
- Young TK, Martens PJ, Taback SP, Sellers EA, Dean HJ, Cheang M, et al.
Type 2 diabetes mellitus in children: prenatal and early infancy risk factors among native Canadians. Arch Pediatr Adolesc Med 2002;156(7):651-5.
- Dyck RF, Klomp H, Tan L.
From “thrifty genotype” to “hefty fetal phenotype”: the relationship between high birthweight and diabetes in Saskatchewan Registered Indians. Can J Public Health 2001;92(5):340-4.
- Masharani U, Goldfine ID, Youngren JF.
Influence of gender on the relationship between insulin sensitivity, adiposity, and plasma lipids in lean nondiabetic subjects. Metabolism 2009;58(11):1602-8.
- O’Dea K, Cunningham J, Maple-Brown L, Weeramanthri T, Shaw J, Dunbar T, et al.
Diabetes and cardiovascular risk factors in urban
indigenous adults: results from the DRUID study. Diabetes Res Clin Pract 2008;80(3):483-9.
- Makaryus AN, Akhrass P, McFarlane SI.
Treatment of hypertension in metabolic syndrome: implications of recent clinical trials. Curr Diab Rep 2009;9(3):229-37.
- Amankwah E, Campbell NR, Maxwell C, Onysko J, Quan H.
Why some adult Canadians do not have blood pressure measured. J Clin Hypertens (Greenwich) 2007;9(12):944-51.
Back to top
