
|
|
Volume 5:
No. 3, July 2008
ORIGINAL RESEARCH
Tracking Chronic Disease and Risk Behavior Prevalence as Survey Participation Declines: Statistics From the Behavioral Risk Factor Surveillance System and Other National Surveys
Mansour Fahimi, PhD, Michael Link, PhD, Deborah A. Schwartz, Paul Levy, PhD, Ali Mokdad, PhD
Suggested citation for this article: Fahimi M, Link M, Schwartz DA, Levy P, Mokdad A. Tracking chronic disease and risk behavior prevalence as survey participation declines: statistics from the Behavioral Risk Factor Surveillance System and other national surveys. Prev Chronic Dis 2008;5(3).
http://www.cdc.gov/pcd/issues/2008/
jul/07_0097.htm. Accessed [date].
PEER REVIEWED
Abstract
Introduction
Response rates for the Behavioral Risk Factor Surveillance System (BRFSS) have declined in recent years. The response rate in 1993
was approximately 72%; in 2006, the response rate was approximately 51%. To assess the impact of this decline on the quality of BRFSS estimates, we compared selected health and risk factor estimates from BRFSS with similar estimates from the National Health Interview Survey (NHIS) and the National Health and Nutrition Examination Survey (NHANES).
Methods
We reviewed questionnaires from the 3 surveys and identified a set of comparable measures related to smoking prevalence, alcohol consumption, medical conditions,
vaccination, health status, insurance coverage, cost barriers to medical care, testing for human immunodeficiency virus, and body measurements (height and weight).
We compared weighted estimates for up to 15 outcome measures, including overall measures and measures for 12 population subgroups. We produced design-appropriate
point estimates and carried out statistical tests of hypotheses on the equality of such estimates. We then calculated
P values for comparisons of NHIS and NHANES estimates with their BRFSS counterparts.
Results
Although BRFSS and NHIS estimates were statistically similar for
5 of the 15 measures examined, BRFSS and NHANES
estimates were statistically similar for only 1 of 6 measures. The
observed differences for some of these comparisons were small, however.
Conclusion
These surveys produced similar estimates for several outcome measures, although we observed significant differences as well. Many of the observed differences may
have limited consequences for implementing related public health programs; other differences may require more detailed examination.
In general, the range of BRFSS estimates examined here tends to parallel those
from NHIS and NHANES, both of which have higher rates of participation.
Back to top
Introduction
The federal government allocates substantial resources each year for collection of state and national data to monitor trends and changes in the health of the U.S. population. Scientists, health care professionals, and policy makers use such data to understand current and emerging trends in public health, to provide a basis for the establishment and evaluation of health policies and programs, and to assess where best to apply limited public health resources. It is, therefore, imperative for
health statistics and other population estimates obtained from these surveys to be of the highest possible quality.
The Behavioral Risk Factor Surveillance System (BRFSS), the world’s
largest ongoing random-digit–dialed (RDD) telephone survey, is conducted
by the health departments in the 50 states as well as those in the
District of Columbia, Puerto Rico, Guam, and the Virgin Islands, with
assistance from the Centers for Disease Control and Prevention (CDC) (1). Estimates obtained from
the BRFSS are based on sound methods for conducting surveys and
performing statistical analyses; comparison of these estimates with
those from other national surveys is important for measuring the validity and reliability
of the estimates. Such comparisons are especially important because RDD surveys are facing an increasing number of newly emerging operational challenges.
The rate of response to telephone surveys has traditionally served as a proxy indicator of the survey’s data quality. Link et al point out that telephone survey response rates have recently declined (2). BRFSS response rates
declined between 1993 and 2006 (Figure). Several researchers have presented convincing arguments on the negative correlation between rate of nonresponse and survey data quality (3-5). RDD surveys face a unique and growing problem: an increasing number of
people rely on cell phones as the only means of telephone communication. Most RDD surveys traditionally sample only from landline telephone numbers (6).
Also of concern is the change in BRFSS sampling methods. As of 2004, all zero-listed telephone banks
(sets of telephone numbers that include only unlisted or nonresidential
numbers) were eliminated from the sampling frame to increase efficiency; this change has increased undercoverage of the population by up to 2% (7).
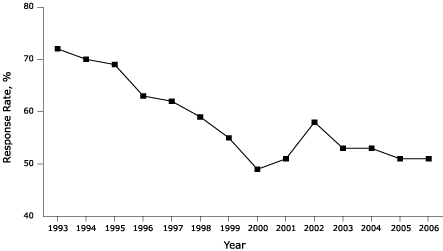
Figure. Response rates for the Behavioral Risk Factor Surveillance System,
1993–2006 (Reference 1). [A
tabular version of this figure is also
available.]
This study compares a number of key estimates obtained from BRFSS with related estimates from the National Health Interview Survey (NHIS) and the National Health and Nutrition Examination Survey (NHANES). These surveys have structural differences in design protocols, modes of data collection, and postsurvey procedures for data adjustment. NHIS and NHANES also
have higher rates of participation than BRFSS. A comparison of the estimates from the
3 surveys can render valuable insights
into the quality of the estimates. The estimates included in these comparisons are related to smoking prevalence, alcohol consumption, medical conditions,
vaccination, health status, insurance coverage, cost barriers to medical care, testing for human immunodeficiency virus (HIV), and body measurements (height and weight).
Gentry and colleagues compared estimates of chronic drinking obtained from the National Institute on Alcoholism and Alcohol Abuse and estimates of current smoking obtained from NHIS with BRFSS estimates and concluded that their similarity was statistically significant (8). A more comprehensive study by Nelson et al examined the comparability of national estimates from the 1997 BRFSS and NHIS (9). Nelson et al concluded that the
2 surveys provided similar estimates for most of the overall
measures examined. This research reexamines these findings after nearly a decade and makes new comparisons with estimates from NHANES and NHIS.
Back to top
Methods
Survey designs and data The data for this research were obtained from the 2004 public-use versions of BRFSS, NHIS, and NHANES. Although technical and methodological details of these surveys are readily available online and in print form, a brief overview of these surveys is provided here for reference purposes (10-12).BRFSS relies on a monthly, state-based RDD sample design in which virtually all households with landline telephones have a nonzero probability of selection. States use disproportionate stratified sampling in which listed residential telephone numbers are sampled at a higher rate than unlisted residential telephone numbers. One adult aged 18 years or older is chosen at random for interview from each selected household; annual sample sizes vary from state to state. In 2004, state sample sizes
ranged from 2656 in Alaska to 18,587 in Washington, with a median state-level sample size of 5903 and a weighted national response rate of 47.2%. BRFSS data from the 50 states and the District of Columbia are aggregated to provide a national sample and are weighted to reflect the
sample design and to compensate for differential nonresponse and undercoverage. The resulting weights are ratio-adjusted (poststratified) within cells indexed by age and sex and, in certain
states, by race/ethnicity.
NHIS is a national survey conducted annually by interviewers of the U.S. Census Bureau for the National Center for Health Statistics (NCHS) of CDC and is designed to track major trends in illness, disability, and coverage of certain health care services in the U.S. population. The annual questionnaire consists of
3 components: the family core, the sample adult core, and the sample child core. The family core collects information on all members of the household aged 17 years or older who
are at home during the interview. Proxy data are collected on children and adults who are not at home.
In addition, 1 sample child and 1 sample adult from each household
are randomly selected, and information on each is collected with the
sample child core and sample adult core questionnaires. This survey, which is conducted year-round, is based on a multistage design that starts with selection of a sample of 358 primary sampling units (PSUs) from approximately 1900 geographically designed PSUs in the country. In the second stage, all occupied houses in selected area segments in
each PSU are targeted for interview. The sample for the 2004 survey consisted of 94,460 people in 36,579 households. Interviewers obtained data for the sample adult
component of the questionnaire from 31,326 of the 37,388 adults eligible for the interview. The household-level response rate was 86.9%, and the conditional response rate for the sample adult component was 83.8%
(calculated by dividing the number of completed sample adult interviews
by the total number of eligible sample adults). Weights for NHIS data are derived from the 2000 census and adjusted by age, sex, and race/ethnicity.
NHANES, which is also conducted by NCHS, aims to assess the health
and nutritional status of adults and children in the United States as a
basis for setting national standards for physical measurements such as
height and weight. Basic survey data are obtained in the homes of study
participants; data from detailed physical examinations are obtained for
a selected subset of participants at mobile examination centers.
Incentives range from $20 to $100 and are given for completion of surveys
and examinations and as compensation for expenses related to participating in the survey. Similar to NHIS, NHANES begins with selection of PSUs. Clusters of households are selected to be screened for specific demographic characteristics. Then a sample of eligible households is selected, and
1 or more individuals per household are interviewed. During the 2003–2004 NHANES, of the 12,761 people selected, 10,122 were interviewed, and 9643 had a physical examination. Because of the
multistage design for NHANES, a complex weighting procedure is used to compensate for unequal selection probabilities and
for poststratification to the Current Population Survey estimates of the U.S. population.
Analysis We reviewed questionnaires used for BRFSS, NHIS, and NHANES and identified a set of comparable measures related to smoking prevalence, alcohol consumption, medical conditions,
vaccination, health status, insurance coverage, cost barriers to medical care, testing for HIV, and body measurements. (The exact questions used in this study are provided in the
Appendix.) We identified 15 measures from NHIS
(14 reported measures and 1 calculated measure, body mass index [BMI]) and 6 measures from NHANES
(5 reported measures and 1 calculated measure, BMI) for comparison with their BRFSS
counterparts.We combined some response categories to create conforming scales
between the 3 surveys. We also used only subsets of respondents with matching age categories for certain comparisons. For example, we grouped people with borderline diabetes with people who reported a diagnosis of diabetes.
Also, we combined the response categories of fair health and poor health to create
1 category. To eliminate confounding
effects attributable to different age requirements for these surveys, we excluded from analysis all respondents aged younger than 18 years. Finally, we restricted analysis of health care coverage to participants aged 18 to 64 years, and we restricted questions on influenza and pneumococcal vaccinations to participants aged 65 years or older. A few wording differences
between the 3 survey instruments could not be addressed completely by combining response categories. For instance, the 2004 BRFSS
asked for the number of times during the past 30 days the person had 5
or more drinks in a single occasion, while NHIS
allows a choice of unit for time (per day, week, month, or year).To determine which estimates were statistically different, we used the SAS-callable version of SUDAAN (Research Triangle Institute, Research Triangle Park, North Carolina) to produce design-appropriate point estimates and 95% confidence intervals. We calculated corresponding
P values for comparisons of NHIS and NHANES estimates with their BRFSS counterparts under the null hypothesis of equality of point estimates.
All test statistics were produced using z tests for proportions for
weighted data. We used a nominal α level of .05 (P < .05),
adjusted for multiple comparisons, to determine significant differences between
2 corresponding surveys. In addition to comparing overall estimates, we compared the following 12 demographic categories:
- Age: 18 to 34, 35 to 54, and 55 years or older.
- Education: less than a high school diploma, high school diploma
or some college, and college diploma or more.
- Sex: male or female.
- Race/ethnicity: Hispanic, non-Hispanic white, non-Hispanic black, and non-Hispanic other.
Back to top
Results
The data show varying levels of agreement between the 3 surveys (Tables 1–4). BRFSS and NHIS overall estimates were statistically similar for
5 of the 15 items examined: current smoker, diabetes, BMI,
average number of alcoholic drinks per occasion, and no health insurance. BRFSS and NHANES estimates were statistically similar for
1 of the 6 items analyzed: self-reported height. BRFSS and NHIS were significantly different for 10 items; for
9 of these, BRFSS estimates were significantly
higher than NHIS estimates. Only 1 BRFSS estimate (for binge drinking) was significantly lower than the NHIS estimate. In contrast, BRFSS estimates were lower than NHANES estimates for
4 of the 5 items for which differences were found; diabetes was the sole exception.
The magnitude of differences varied widely. For example, the relative difference between BRFSS and NHIS estimates of height is less than 1% (derived by dividing the difference [0.14 inches] between the BRFSS and NHIS overall point estimates by the NHIS
overall point estimate [66.96 inches]). For weight, the relative difference is 1.2%
(2.13%/170.90%). The relative difference in overall estimates of ever having smoked a cigarette is 4.0%
(1.68%/42.35%) and of having received an influenza vaccination in the past 12 months,
4.6% (2.95%/64.63%). At the other end of the spectrum, however, the relative differences in BRFSS and NHIS
estimates are 94.4% (7.35%/7.79%) for experiencing cost barriers to
medical care, 35.1% (3.48%/9.91%) for having asthma, 33.9%
(4.16%/12.28%) for reporting poor or fair health, 26.4% (9.15%/34.61%)
for having ever had an HIV test, and 11.5% (6.54%/56.84%) for having
ever had a pneumonia vaccination. In contrast, the estimate for binge
drinking is 8.3% (0.39 drinks/4.70 drinks) lower for BRFSS than for NHIS.
As a relative percentage of the NHANES estimates, BRFSS estimates show less variation. For diabetes, BRFSS estimates are 31.3%
(1.92%/6.14%) higher, but they are 12.2% (2.89%/23.60%) lower for current smoking, 8.3%
(3.96%/47.99%) lower for ever having smoked a cigarette, 2.1% lower for BMI
(0.58/27.55), and 2.0% (3.55 lb/176.58 lb) lower for self-reported weight.
BRFSS and NHIS estimates for diabetes prevalence were similar for all 12
population subgroups. The following tabulation shows the number of subgroups for which BRFSS and NHIS estimates were statistically similar:
| Survey Question |
No. of Subgroups Similar/
No. Subgroups Surveyed |
| No health insurance |
10/12 |
| Binge drinking |
8/12 |
| BMI |
7/12 |
| Influenza vaccination |
6/9 |
| Number of alcohol drinks |
5/12 |
| Current smoker |
5/12 |
| Self-reported height |
3/12 |
| Pneumonia vaccination |
2/9 |
| Self-reported weight |
2/12 |
| Ever smoked |
2/12 |
The estimates for fair or poor health status, asthma, having been
tested for HIV, and not receiving medical care because of cost were
significantly different between all subgroups examined.
Similarity between BRFSS and NHANES estimates among the 12 subgroups was greatest for self-reported height (9 subgroups), followed by diabetes (8 subgroups), current smoker (6 subgroups), self-reported weight (5 subgroups), BMI (4 subgroups), and ever having smoked a cigarette (2 subgroups).
The estimates provided by the 3 surveys for the 4 demographic characteristics (age, sex, race/ethnicity, and education) are not entirely consistent despite being indexed to population totals;
estimates for educational attainment differ most notably.
Back to top
Discussion
Some of the estimates from the 2004 BRFSS, NHIS, and the 2003–2004 NHANES
vary overall and within certain subgroups. While a number of these differences are small and
may not warrant more examinations, other differences — especially those that reflect a relative difference of
more than 20% — may require further investigations. The BRFSS estimates tended to be higher than NHIS estimates but lower than NHANES
estimates. For the 6 items examined in all 3 surveys, 1 of the BRFSS estimates (self-reported height) was identical to NHANES,
2 fell between those of NHIS and NHANES (ever smoke cigarettes and self-reported weight), and
3 were statistically identical to NHIS (current smoking status, diabetes, and BMI).
The extent of similarity between the 2004 BRFSS and NHIS estimates
was less than what was reported by Nelson and colleagues (9) for the
1997 comparisons. They found statistically significant differences
between overall estimates for 6 of 14 items examined; BRFSS estimates were lower for current smoking, height, and BMI and higher for pneumococcal vaccination, cost as a barrier to medical care, and reporting fair or poor health.
Several explanations may account for the inconsistencies
BRFSS estimates and estimates from the other
2 surveys, including 1) differences in questionnaire wording, 2) mode of survey administration, 3)
sampling design differences and related postsurvey adjustments such as weighting procedures, and 4) use of incentives or proxy data.
Differences in questionnaire wording represent some of the greatest challenges in comparing survey results. The wording of the BRFSS and NHIS questionnaires was identical for only
4 of the items examined (ever smoked
cigarettes, ever had a pneumonia vaccination, health status, and asthma) and for
1 of the NHANES items (ever smoked
cigarettes). Some questions that seemed to be measuring the same concept differed in ways that may have led to differences in their final estimates. For example, the questions used to
assess binge drinking are dissimilar in wording, time frame, and response categories. BRFSS asks,
“Considering all types of alcoholic beverages, how many times during the past 30 days did you have 5 or more drinks on an occasion?”; NHIS asks,
“In the past year, on how many days did you have 5 or more drinks of any
alcoholic beverages?” Although both surveys attempt to measure the same concept, differences in wording and time frame could explain the small but statistically significant
differences in estimates that we observed.
Even with identical wording, however, different modes of survey administration can produce varying results and magnify differences in measurement (13,14). BRFSS is a telephone survey, whereas NHIS and NHANES are conducted face-to-face. For BRFSS the interaction is aural and limited to voice communication, whereas NHIS and NHANES rely on both aural and visual cues. Such differences in the patterns of interviewer–respondent communication and situational contexts may explain some of the
variation in survey estimates.
Differences in weighting adjustment to compensate for
design-imposed differential selection probabilities may also explain
some of the observed differences in survey estimates. The comparison of weighted estimates
for basic demographic characteristics, such as race/ethnicity and
education, shows that even when weights are applied, differences remain
between survey respondents. These differences may lead, in part, to some
of the inconsistencies in health and risk estimates between the 3 surveys. In addition, the
3 surveys use different sources to obtain population control totals for weight calibrations. BRFSS uses population estimates from Claritas (Claritas Inc, San Diego, California), a private data vendor that uses census projections as part of
its process for developing yearly population estimates, whereas NHIS uses census projections and NHANES relies on the Current Population Survey estimates. These sources for population control totals vary in their analysis of the U.S. population by sex,
age, and race/ethnicity. In addition, the weighting procedures for both NHIS and NHANES account for differences in the race/ethnicity distribution in each state, whereas BRFSS includes this type of adjustment in selected states only. Education was the socioeconomic indicator that differed most
markedly
between the 3 surveys. BRFSS is revising its weighting methodology to account for educational differences; the new weight will be applied to public release data sets in 2010 (15).
Other factors, perhaps minor, may also contribute to differences in survey estimates. For instance, BRFSS and NHIS do not offer any incentives for survey participation, but NHANES relies on incentives to secure higher rates of response. The use of incentives may alter a participant’s survey response or attract a different mix of participants (16). Also, differences between BRFSS and NHIS estimates may be affected by the use of proxy data in NHIS. Although BRFSS does not allow proxy
respondents, some NHIS estimates (e.g., cost as a barrier to medical care, health status) can be based on proxy data. BRFSS and NHIS provide significantly different estimates for both of these measures. Hays et al report that agreement between self and proxy responses are often good for measures of function that are directly observable but poor for subjective measures (17). Moreover, Nelson and colleagues suggest that proxy-derived data
are reliable for demographic and body
measures but are less reliable for questions on medications and alcohol consumption (18).
Although the many differences in design, procedures, and context of these surveys may confound our ability to single out the proximal causes of differences in survey estimates noted in this research, the comparison of estimates for similar concepts is important. These periodic comparisons are particularly important because BRFSS, NHIS, and NHANES are critical components of the U.S. public health system, with each providing essential data for policy makers, researchers, and the public alike.
The periodic examination of when and why measurements of similar concepts vary is equally important.
These research findings also need to be interpreted in light of tangible implications. Although many of the estimates examined here differed statistically, their programmatic implications and impact on actionable policy are subject to debate. What constitutes a “significant” difference is ultimately up to the people who use the data. Perhaps the good news for BRFSS is that despite declines in survey participation rates during the past decade, BRFSS estimates do not appear to be radically
different from similar estimates produced by NHIS and NHANES. In fact, for the 6 common
items in these surveys, BRFSS estimates were either similar to NHIS or NHANES estimates or were found between the estimates of these
2 surveys.
Back to top
Author Information
Corresponding Author: Mansour Fahimi, PhD, Marketing Systems Group, 565
Virginia Dr, Fort Washington, PA 19034. Telephone: (240) 477-8277. E-mail: mfahimi@m-s-g.com. At the time of the study, Dr
Fahimi was affiliated with RTI International, Rockville, Maryland.
Author Affiliations: Michael Link, Ali Mokdad, Division of Adult and
Community Health, National Center for Chronic Disease Prevention and
Health Promotion, Centers for Disease Control and Prevention, Atlanta,
Georgia; Deborah A. Schwartz, RTI International, Rockville, Maryland;
Paul Levy, Research Triangle Institute, Cary, North Carolina.
Back to top
References
- Mokdad AH, Stroup DF, Giles HW.
Public health surveillance for behavioral risk factors in a changing
environment. Recommendations from the Behavioral Risk Factor
Surveillance Team. MMWR Recomm Rep 2003;52(RR-9):1-12.
- Link MW, Mokdad AH, Kulp D, Hylon A. Has the National Do Not Call Registry
helped or hurt survey research efforts? Public Opin Q 2006;70(5):794-805.
- Groves RM. Nonresponse rates and nonresponse bias in household surveys.
Public Opin Q 2006;70:646-75.
- Curtin R, Presser S, Singer E. The effect of response rate
changes on the Index of Consumer Sentiment. Public Opin Q 2000;64:413-28.
- Keeter S, Miller C, Kohut A, Groves R, Presser S. Consequences of
reducing nonresponse in a national telephone survey. Public Opin Q 2000;64:125-48.
- Blumberg SJ, Luke JV, Cynamon ML.
Telephone coverage and health survey
estimates: evaluating the need for concern about wireless substitution. Am J
Public Health 2006;96(5):926-31.
- Brick JM, Waksberg J, Kulp D, Starer A. Bias in list-assisted telephone
samples. Public Opin Q 1995;59:218-35.
- Gentry EM, Kalsbeek WD, Hogelin GC, Jones JT, Gaines KL, Forman
MR, et al.
The behavioral risk factor surveys: II. Design, methods, and
estimates from combined state data. Am J Prev Med 1985;1(6):9-14.
- Nelson DE, Powell-Griner E, Town M, Kovar MG.
A comparison of national estimates from the National Health Interview Survey and the Behavioral Risk Factor Surveillance System. Am J Public Health 2003;93(8):1335-41.
- Behavioral Risk Factor
Surveillance System (BRFSS). Atlanta (GA): Centers for Disease Control and
Prevention. http://www.cdc.gov/brfss.
- National Health Interview
Survey (NHIS). Atlanta (GA): Centers for Disease Control and Prevention.
http://www.cdc.gov/nchs/nhis.htm.
- National Health and
Nutrition Examination Survey (NHANES). Atlanta (GA): Centers for Disease
Control and Prevention. http://www.cdc.gov/nhanes.
- Dillman DA, Sangster RL, Tanari J. Understanding differences in people’s
answers to telephone and mail surveys. In: Braverman MT, Slater JK, eds. New
directions for evaluation series, 70 (advances in survey research). San
Francisco (CA): Jossey-Bass; 1996.
- Tourangeau R, Smith T. Asking sensitive questions: the impact of data
collection, question format, and question context. Public Opin Q
1996;60:275-304.
- Frankel M, Battaglia M, Link M. A new weighting system for BRFSS.
Presentation at the 2007 Behavioral Risk Factor Surveillance System
annual conference. March 2007; Decatur, GA.
- Fahimi M, Chromy J, Whitmore W, Cahalan M. Efficacy of incentives in
increasing response rates. Proceeding from the Sixth International Conference
on Social Science Methodology. Amsterdam, Netherlands; 2004.
- Hays RD, Vickrey BG, Hermann BP, Perrine K, Cramer J, Meador K,
et al. Quality of life research. Amsterdam: Springer Netherlands;
1994. pp. 159-68.
- Nelson LM, Longstreth WT Jr, Koepsell TD, Checkoway H, van Belle G.
Completeness and accuracy of interview data from proxy respondents:
demographic, medical, and life-style factors. Epidemiology
1994;5(2):204-17.
Back to top |
|
