
|
|
Volume 4: No. 1, January 2007
COMMUNITY CASE STUDY
The Healthy Diabetes Plate
Martha Raidl, PhD, RD, Kristina Spain, MS, RD, Rhea Lanting, MS, Marsha Lockard, MS, Shelly Johnson, MS, Marnie Spencer, MS, RD, Laura Sant, MS, RD, Julia Welch, Audrey Liddil, MS, Mimi Hartman-Cunningham, MA, RD, CDE
Suggested citation for this article: Raidl M, Spain K, Lanting R, Lockard M, Johnson S, Spencer M, et al. The
Healthy Diabetes Plate. Prev Chronic Dis [serial online] 2007 Jan [date cited]. Available from: http://www.cdc.gov/pcd/issues/2007/
jan/06_0050.htm.
PEER REVIEWED
Abstract
Background
Diabetes education presents two major challenges to the U.S. Cooperative Extension System. The first is that the majority of diabetes education services are
provided in more populated areas, resulting in large nonurban areas being underserved. The second is that many individuals with diabetes find the
meal-planning component of diabetes education confusing.
Context
The University of Idaho, a land-grant institution, includes teaching, research, and extension as part of its mission. Extension means “reaching out,” and in Idaho, the Extension Service provides research-based programs on agricultural, natural
resources, youth, family, community, and environmental issues in 42 of Idaho’s 44 counties, making it accessible to most Idahoans.
Methods
The University of Idaho Extension Service collaborated with dietitians and certified diabetes educators to develop and test materials that simplify the
meal-planning component of diabetes education. The result was a four-lesson curriculum, The Healthy Diabetes Plate, which used the plate format to teach individuals about the type and amount of foods they should consume at each meal. In 2004,
the four-lesson curriculum was taught in three urban and five rural counties. Surveys, hands-on activities, and
note-taking of participants’ comments were used to collect data on participants’ characteristics, their ability to plan meals, and changes in eating habits.
Consequences
Participants were able to correctly plan breakfast, lunch, and dinner meals and improved their intake of fruit and vegetables.
Interpretation
Quantitative and qualitative evaluation information gathered from class participants helped identify which components of The Healthy Diabetes Plate curriculum were effective.
Back to top
Background
Approximately 21 million Americans, or 7% of the American population, have been told by a doctor or other health care professional that they have diabetes (1). But how well do people with diabetes manage their disease? A survey conducted by the American Association of Clinical Endocrinologists on 157,000 individuals with type 2 diabetes found that approximately two thirds
did not have their diabetes under control and were more likely to experience blindness and limb loss or die prematurely from myocardial infarction, kidney failure,
or a stroke (2).
Diabetes education is recommended to help individuals control their diabetes, but to be effective diabetes education must be accessible and understandable. Currently, most diabetes educators are located in health care organizations in urban areas (3), and most diabetes information provided in nutrition therapy classes is poorly understood by participants (4). In Idaho, the solution to both
problems was to have the University of Idaho (UI) Extension Service deliver diabetes education. The extension service is accessible to rural and urban clientele, having offices in 42 of 44 counties in Idaho. To make nutrition therapy classes understandable to participants, materials were developed using a visual format, the Idaho Plate Method (IPM). A group of Idaho dietitians modified the
Swedish Plate Method, which has been used successfully since 1987 to teach meal planning to individuals with type 2 diabetes (5-7). The IPM follows the nutritional guidelines of the American Diabetes Association and the American Dietetic Association (8).
Studies show that participants gain and retain more knowledge about diabetes when attending more than one lesson (9). Although the IPM has been used as a tool to plan meals, no multi-lesson diabetes curriculum had been developed for using the IPM as part of the
meal-planning process. Therefore, a curriculum was developed that focused on using the IPM to plan meals in
many settings. The
resulting four-lesson curriculum was called The Healthy Diabetes Plate (10), and its target audience was defined as adults with type 2 diabetes or their caregivers. The purpose of this project was to develop, test, and evaluate The Healthy Diabetes Plate curriculum that could be taught by extension educators to underserved populations.
Back to top
Context
The incidence of diabetes in Idaho has increased from 4% in 1997 to 6.2% in 2004 (11). In 2005, more than 61% of the state’s
area or population was designated as medically underserved (12). The UI Extension System can help reach this underserved population. UI faculty members who teach extension programs in the community are called extension educators, and those that teach nutrition and health programs are called
Family and Consumer Sciences (FCS) extension educators. The extension nutrition education specialist at UI provides research-based information and program development for FCS extension educators.
The increased incidence in diabetes in Idaho has created greater interest and demand for diabetes education materials among FCS extension educators. In 2000, the UI extension nutrition education specialist conducted a needs assessment with 24 UI FCS extension educators. The number one request among the extension educators was for new materials on nutrition for diabetes education. The request
was based on input from advisory boards and residents in their local communities. The UI FCS extension educators requested that any diabetes education materials developed include basic information on diabetes but focus mainly on meal planning in a variety of settings. The UI College of Agricultural and Life Sciences provided a $3000 grant to develop and test diabetes materials that could be used
by UI FCS extension faculty.
It was also important that materials used by extension faculty be technically accurate. The program manager for the Idaho Diabetes Prevention and Control Program promoted The Healthy Diabetes Plate curriculum in Idaho and other states by reviewing materials and facilitating collaboration between local registered dietitians, certified diabetes educators, and FCS extension educators.
The resulting four-lesson curriculum was developed and piloted during 3 years in three states (Idaho, Oregon, and Colorado) and reviewed by 10 extension educators, three extension nutrition specialists, and three certified diabetes educators. Numerous revisions were made on the content, activities, and evaluation tools. The final peer-reviewed curriculum, called The Healthy Diabetes Plate, was
published in January 2003 (10). Eight UI extension faculty members received a copy of the final curriculum in October 2003 and were trained on the materials, activities, evaluation tools, and research protocol. Testing of The Healthy Diabetes Plate was conducted during 2003 and 2004.
Back to top
Methods
Program and activities
The Healthy Diabetes Plate curriculum contains four lessons; participants met weekly either in a classroom or supermarket. Each lesson focused on teaching participants how to plan meals correctly using the IPM (Figure 1). The program was designed to reach an audience of people with diabetes and individuals who are caregivers of people with diabetes. Because individuals aged 45 years and older
have an increased risk of developing diabetes, the program participants were divided into two age groups: individuals aged less than 45 years and individuals aged 45 years or older (13).
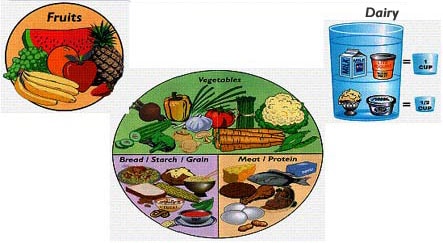
Figure 1. The Idaho Plate Method for meal planning, reproduced by permission from Idaho Plate Method, LLC (14).
Lesson 1 covered basic information on diabetes (signs and symptoms) and an introduction to the IPM. Information about the five food groups (vegetables, starches, meats and other proteins, fruits, and dairy) and how they fit on the plate was discussed. In this class, participants were divided into three groups and instructed to plan a breakfast, lunch, or dinner meal using a
meal-planning sheet
(Figure 2). In lessons 2, 3, and 4, participants learned how to plan meals in three different settings. The first setting was in the home, using foods they typically ate at home; the second setting was in the supermarket, using new foods introduced during the supermarket tour; the third setting was in a restaurant or fast-food establishment. The
meal-planning lessons not only reinforced the five
food groups but also helped participants visually plan meals; participants were able to visualize the types and amounts of foods allowed and how the foods formed a balanced and nutritious meal.
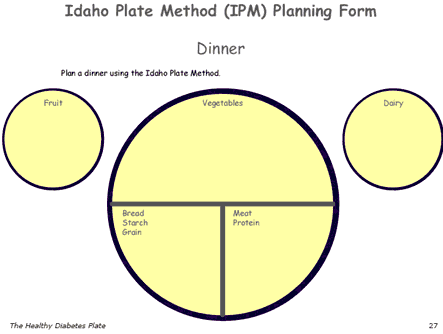
Figure 2: Example of a meal-planning form from The Healthy Diabetes Plate curriculum, Idaho Plate Method.
Recruitment of participants
Adult participants were recruited through the county extension newsletter and selected through nonrandom sampling. Extension faculty found that registration for the classes filled up quickly, and many potential participants were placed on a waiting list for the next set of classes. Participants were recruited from five rural and three urban counties. When participants residing in an urban area
called to register for the class, several commented that either they could not afford the cost of diabetes education classes at their own local hospital or that they had taken a class but did not understand most of it. Residents in rural counties commented that this was the first time diabetes classes had been offered in their county. The UI Human Assurances Committee approved this study, and
each participant signed a subject consent form.
Program evaluation
The Healthy Diabetes Plate program was evaluated using pre- and postcurriculum surveys and
meal-planning activities. A precurriculum survey was filled out during lesson 1 and contained questions on demographics and diabetes history. The precurriculum survey also included a four-question semiquantitative food frequency survey. Questions in the food frequency survey were related to foods
promoted in the IPM — whole grains, fruits, vegetables, and milk —
that are known to affect blood glucose levels (15-17). The postcurriculum survey was completed at the end of lesson 4; it included the same four-question semiquantitative food frequency survey as well as a comments section. In lessons 2, 3, and 4, a
meal-planning activity was used to determine participants’
abilities to plan meals correctly using the IPM. Each participant planned breakfast, lunch, and dinner meals in three different settings (i.e., home, supermarket, and eating out). The breakfast, lunch, and dinner meals were combined within each setting and analyzed. For each setting, the percentage of correct responses for each of the five food groups was calculated.
Statistical analysis
Data were gathered on participant demographic characteristics, the reasons given by participants for taking the class, food consumption frequency, and the ability of participants to plan meals correctly in three settings.
Pre- and postcurriculum food frequency questions were analyzed using t
tests; participants served as their own control.
Back to top
Consequences
Demographic and diabetes characteristics
Table 1 shows participants’ age, sex, racial and ethnic characteristics, and reasons for taking the class. One hundred and thirty five individuals started the project, and 117 (87%) completed all four lessons. Most of the participants (88%) were aged 45 years or older. Ages ranged from 26 years to 83 years. Of the 117 participants who completed the lessons, 83% were female and 17% were
male.
Table 1 also shows that 113 (96.6%) were white, and the rest of the participants were evenly divided into Hispanic, African American, Asian American, and American Indian groups. In Idaho, the most recent census data (2004) indicated that approximately 91% of the population of Idaho is white, followed by 8% Hispanics, 1.4% American Indian and Alaska Native, 1% Asian, and less than 0.5% African
American, Native Hawaiian and Other Pacific Islander. While Hispanic participation in the program was low, the rest of the research population was similar to the most recent census data on Idaho (18).
Reasons why participants took the classes were divided into three categories: 1) 48% had been diagnosed with type 2 diabetes; 2) 46% did not have diabetes and were caregivers of individuals who had diabetes; and 3) 6% were not sure if they had diabetes but were interested in learning more about diabetes. The results indicate that the target population was reached.
Eating habits
Table 2 shows that there were no significant changes in daily whole grain or milk consumption, but there were significant increases in daily fruit (P = .02) and vegetable consumption (P = .01).
Ability to plan meals correctly
Table 3 shows that a high percentage of participants were able to plan their meals correctly: 86% to 97% of participants in the home setting; 88% to 96% in the supermarket setting; and 90% to 99% in the restaurant and fast-food setting. In all three settings, the dairy group had the lowest percentage of correct responses. Comments from the instructors and participants indicated that some
participants forgot that with the IPM, cheese was grouped with meat and other protein and not with dairy.
Back to top
Interpretation
The results from the study indicate that having FCS extension educators teach The Healthy Diabetes Plate curriculum solves two problems encountered in diabetes education — understandability and accessibility. The IPM was easy for participants to understand; a high percentage of participants planned meals correctly in three different settings. Because extension faculty members are located
in urban and rural counties, diabetes education became accessible to the underserved population. Also,
participants in our study indicated that they preferred attending extension
classes rather than visiting their physician or attending hospital classes. We
speculate that extension educators may be viewed as less threatening than health professionals,
and a greater level of comfort among participants may help to explain the low attrition rate in this study.
The IPM focused on meal planning and showed participants how to include all foods in their meal planning. A focus on meal planning provided an opportunity to reinforce basic information at each lesson. Exposing participants to a variety of settings helped them plan their meals accordingly. Planning meals in supermarkets and restaurants made the lessons more applicable and interesting and
sparked discussions on how participants could eat out at their favorite restaurant and still adhere to the guidelines of the IPM.
Most Americans do not consume the recommended five to nine daily servings of fruits and vegetables. The supermarket tour lesson provided an excellent opportunity for participants to learn about new fruits and vegetables and how to incorporate them in their meal plan. The significant increase in fruit and vegetable consumption indicated that participants were making some of these changes
in their diet.
The Healthy Diabetes Plate curriculum became a starting point for diabetes education for many participants. One outcome was that many participants wanted to continue to meet on a monthly or bimonthly basis as a support group to help one another follow the IPM. Participants also had questions about diabetes that were outside the expertise of the extension educator (e.g., questions about
insulin, foot care, and matching insulin to food). The extension educators invited health care professionals such as pharmacists, podiatrists, and certified diabetes educators to answer questions at meetings. One topic not covered in The Healthy Diabetes Plate curriculum was physical activity. Many participants expressed an interest in being more physically active and starting a walking
program.
One of the best ways to learn about the effectiveness of a lesson is to listen to comments made by participants. Participants made the following comments: “This is so easy to understand,” “I’ll be able to follow this forever,” “Now I know how to fit all foods into my diet,” and “I don’t have to give up cookies forever.”
Future projects include adding a physical activity component to the study and making The Healthy Diabetes Plate more culturally appropriate to the Hispanic population. Based on research indicating that diet and physical activity may help control and prevent type 2 diabetes, a walking program and resistance activity component are being piloted along with The Healthy Diabetes Plate lessons. One
of the fastest-growing population groups in Idaho is the Hispanic population. A separate curriculum written for the Hispanic population needs to be developed.
By participating in this project, the UI Extension Service strengthened its ties with the residents in the community, health care professionals, and the Idaho Diabetes Prevention and Control Program. These diabetes education classes are now offered on a regular basis (3 to 4 times
per year) in various counties to meet the needs of their clientele. Many extension faculty members serve on local
diabetes advisory councils, and some health care professionals regularly refer their clients with diabetes to these classes. Finally, the manager of the Idaho Diabetes Prevention and Control Program is currently providing expertise and resources for a new diabetes pedometer project conducted by
the UI Extension Service.
Back to top
Acknowledgments
The authors thank Dr Lou Riesenberg, UI Department of Agricultural and Extension Education, for his input in planning this project and his assistance in calculating frequencies on the demographic characteristics and the UI College of Agricultural and Life Sciences for providing funding to develop and test The Healthy Diabetes Plate.
Back to top
Author Information
Corresponding Author: Martha Raidl, PhD, RD, University of Idaho, 322 E Front St, Suite 180, Boise, ID 83702. Telephone: 208-364-4056. E-mail:
mraidl@uidaho.edu.
Author Affiliations: Kristina Spain, Bureau of Clinical and Preventive
Services, Idaho Department of Health and Welfare, Boise, Idaho; Mimi Hartman-Cunningham, Idaho Diabetes Prevention and Control Program, Idaho Department of Health and Welfare,
Boise, Idaho; Rhea Lanting, University of Idaho (UI), Twin Falls, Idaho; Marsha Lockard,
UI, Marsing, Idaho; Shelly Johnson, UI, Coeur d'Alene, Idaho; Marnie Spencer,
UI, Blackfoot, Idaho; Laura Sant, UI, Preston, Idaho; Julia Welch, UI,
Grangeville, Idaho; Audrey Liddil, UI, Pocatello, Idaho. Ms. Welch is now
affiliated with Schweitzer Engineering, Pullman, Wash.
Back to top
References
- National diabetes fact sheet: total prevalence of diabetes in the United States, all ages, 2005.
Atlanta (GA): Centers for Disease Control and Prevention;[updated 2005
Nov 16]. Available from: http://www.cdc.gov/diabetes/pubs/estimates05.htm#prev3
- American Association of Clinical Endocrinologists. State of diabetes
in America. Jacksonville (FL): American Association of Clinical
Endocrinologists; 2005. Available from: http://www.aace.com/public/awareness/stateofdiabetes/ DiabetesAmericaReport.pdf *
- Lorig K, Gonzalez VM. Community-based diabetes self-management education: definition and case study. Diabetes Spectr 2000;13(4):234-42.
- Maryniuk MD. The new shape of medical nutrition therapy. Diabetes Spectr 2000;13(3):122-4.
- Camelon KM, Hadell K, Jamsen PT, Ketonen KJ, Kohtamaki HM,
Makimatilla S, et al.
The Plate Model: a visual method of teaching meal planning. DAIS Project
Group. Diabetes Atherosclerosis Intervention Study. J Am Diet Assoc 1998;98(10):1155-8.
- Rizor HM, Richards S.
All our patients need to know about intensified diabetes management they learned in fourth grade. Diabetes Educ 2000;26(3):392-4,396,400-2.
- Brown MD, Lackey HD, Miller TK, Priest D. Controlling calories — the simple approach. Diabetes Spectr 2001;14(2):110-2.
- Rizor H, Smith M, Thomas K, Harker J, Rich M. Practical nutrition: the Idaho Plate Method. Practical Diabetology 1998;17:42-5.
- Noel PH, Larme AC, Meyer J, Marsh G, Correa A, Pugh JA.
Patient choice in diabetes education curriculum: nutritional versus
standard content for type 2 diabetes. Diabetes Care 1998;2(16):896-901.
- Raidl M. The Healthy Diabetes Plate. Moscow: University of Idaho Educational Publications; 2003.
- Idaho Department of Health and Welfare. Idaho Behavioral Risk Factors:
results from the 2004 Behavioral Risk Factor Surveillance System. Boise
(ID): Division of Health, Bureau of Health Policy and Vital Statistics;
2005.
- Salant P, Porter A. Profile of rural Idaho:
a look at economic and social trends affecting rural Idaho. Boise: Idaho Commerce & Labor, Division of Commerce;
2005. Available at:
http://irp.idaho.gov/ProfileofRuralIdaho/tabid/204/ Default.aspx.*
- National Diabetes Information Clearinghouse. Am I at risk for type 2
diabetes? Taking steps to lower your risk of getting diabetes. Bethesda
(MD): National Institute of Diabetes and Digestive and Kidney Diseases,
National Institutes of Health; 2004. Chapter 4, Should I be tested for diabetes?;
p. 4. Available from:
http://diabetes.niddk.nih.gov/dm/pubs/riskfortype2/risk.pdf.
- Idaho plate method [homepage on the Internet]. Rexburg (ID): Idaho
Plate Method. Available from: http://platemethod.com.*
- McKeown NM, Meigs JB, Liu S, Wilson PW, Jacques PF.
Whole-grain intake is favorably associated with metabolic risk factors
for type 2 diabetes and cardiovascular disease in the Framingham
Offspring Study. Am J Clin Nutr 2002;76(2):390-8.
- Ford ES, Mokdad AH.
Fruit and vegetable consumption and diabetes mellitus incidence among U.S. adults. Prev Med 2001;32(1):33-9.
- Choi HK, Willett WC, Stampfer MJ, Rimm E, Hu FB.
Dairy consumption and risk of type 2 diabetes mellitus in men:
a prospective study. Arch Intern Med 2005;165(9):997-1003.
- U.S. Census Bureau. State and county QuickFacts: Idaho. Washington
(DC): U.S. Census Bureau;[updated 2006 Jan 12]. Available from:
http://quickfacts.census.gov/qfd/states/16000.html
Back to top
|
|
