
|
|
Volume
2:
No. 2, April 2005
ORIGINAL RESEARCH
Family History, Diabetes, and Other Demographic and
Risk Factors Among Participants of the National Health and Nutrition Examination Survey
1999–2002
Ann M. Annis, RN, MPH, Mark S. Caulder, MS, MPH, Michelle L. Cook, MPH, Debra
Duquette, MS, CGC
Suggested citation for this article: Annis AM, Caulder MS, Cook
ML, Duquette D. Family history, diabetes, and other demographic and
risk factors among participants of the National Health and Nutrition Examination Survey
1999–2002. Prev Chronic Dis [serial online] 2005 Apr [date cited]. Available
from: URL: http://www.cdc.gov/pcd/issues/2005/
apr/04_0131.htm.
PEER REVIEWED
Abstract
Introduction
Family history of diabetes has been recognized as an important risk factor of the
disease. Family medical history represents valuable genomic information because it
characterizes the combined interactions between environmental, behavioral, and genetic
factors. This study examined the strength and effect of having a family history of
diabetes on the prevalence of self-reported, previously diagnosed diabetes among adult
participants of the National Health and Nutrition Examination Survey 1999–2002.
Methods
The study population included data from 10,283 participants aged 20 years and older.
Gender, age, race/ethnicity, poverty income ratio, education level, body mass index, and
family history of diabetes were examined in relation to diabetes status. Diabetes
prevalence estimates and odds ratios of diabetes were calculated based on family history
and other factors.
Results
The prevalence of diabetes among individuals who have a first-degree relative with
diabetes (14.3%) was significantly higher than that of individuals without a family
history (3.2%), corresponding to a crude odds ratio of five. Both prevalence and odds
ratio estimates significantly increased with the number of relatives affected with
diabetes. Family history was also associated with several demographic and risk
factors.
Conclusion
Family history of diabetes was shown to be a significant predictor of diabetes
prevalence in the adult U.S. population. We advocate the inclusion of family history
assessment in public health prevention and screening programs as an inexpensive and
valuable source of genomic information and measure of diabetes risk.
Back to top
Introduction
Diabetes mellitus presents multiple challenges to public health. An estimated 18.2
million individuals in the United States have diabetes (1). This disease contributes to
significant morbidity, including cardiovascular, cerebrovascular, and renal disease, and
premature mortality (1-3). In 2002, diabetes was ranked as the sixth leading cause of
death (1,4). Another major public health challenge is the increasing prevalence of type 2
diabetes in adults, children, and adolescents during the past two decades (5-7).
Additionally, type 2 diabetes may account for 90% to 95% of all diagnosed cases
of diabetes
(1,6,8), may progress undetected for years, and is often not diagnosed until onset of
clinical symptoms or complications (3,6,8).
Undiagnosed diabetes constitutes approximately 29.3% of total diabetes prevalence (5).
It is clear that developing strategies to screen and identify high-risk individuals
should be an important public health goal. Screening for type 2 diabetes is recommended
for individuals aged 45 years and older and/or younger individuals who have one or more
risk factors, such as race/ethnicity (i.e., African American, Native American,
and Hispanic), overweight or obesity, physical inactivity, previous history of
gestational diabetes, and family history of diabetes (9). A primary goal of tailored
screening is to recognize high-risk individuals in the presymptomatic stage of diabetes.
Research has indicated that diabetes and many of its health complications can be delayed
or prevented through medical and lifestyle interventions, such as pharmaceuticals, diet,
and exercise (6,10-17).
For prevention efforts to be most effective, public health programs must
recognize the factors involved in diabetes susceptibility. Evidence for a strong
genetic element of type 2 diabetes susceptibility is suggested by the high
incidence in certain racial/ethnic populations (1,3,6,18,19), high concordance
in monozygotic twins compared with dizygotic twins (6,20,21), and high incidence among first-degree relatives of persons
with type 2 diabetes (3,6,19,22-25). The complex pathophysiologic nature of diabetes
supports the idea that multiple biologic and/or chemical pathways are implicated in the
development and progression of the disease (26), and numerous genetic loci have
been investigated in the search for genetic determinants of the disease (26-30).
Identifying susceptibility loci for diabetes, however, has been difficult because of the
multiple genes involved and strong environmental contributing factors (26).
Family history of type 2 diabetes is recognized as an important risk factor
of the disease (3,6,9,19,22-25). Individuals who have a family history of
diabetes can have two to six times the risk of type 2 diabetes compared with
individuals with no family history of
the disease (6,19). The etiologies of type 2 diabetes are complex: family medical
history provides valuable genomic information because it represents the combination of
inherited genetic susceptibilities and shared environmental and behavioral factors (31).
The use of family history as part of a comprehensive risk assessment for an individual
can be crucial in the prevention, early detection, and treatment of type 2 diabetes. On a
population level, family history may help tailor health promotion messages for specific
population groups (31).
A goal of this study was to assess the feasibility of obtaining and using genomic
information from an existing, national population-based data source to provide chronic
disease program recommendations. Specifically, our objective was to examine the strength
and effect of having a family history of diabetes in first-degree relatives on the
prevalence of self-reported, physician-diagnosed diabetes among adult participants in the
National Health and Nutrition Examination Survey (NHANES) during 1999 to 2002. We
evaluated several risk factors influencing diabetes prevalence in the United States and
how these factors relate to family history.
Back to top
Methods
Population
The National Center for Health Statistics (NCHS), within the Centers for Disease
Control and Prevention (CDC), annually conducts NHANES, a continuous, population-based
survey of the civilian, noninstitutionalized U.S. population (32). Data for NHANES is
collected from U.S. households using two methods: an in-home interview and a physical
health examination. Written informed consent is obtained from each participant for both
parts of the survey. Information gathered by NHANES is intended for health research
purposes, and NHANES documentation and codebooks are provided elsewhere (32).
For the study, data sets from both NHANES 1999–2000 and NHANES 2001–2002
were merged to create a NHANES 1999–2002 data set (n = 21,004) (32). Information on
family history of diabetes was not available for participants aged 19 years and younger.
Because family history was considered an important predictor of diabetes status, and the
main focus was type 2 diabetes, subjects under the age of 20 years (n = 10,713) were
excluded from the data set.
Diabetes status
Diabetes status was self-reported by asking whether an individual had ever been told
by a doctor or health professional that he/she had diabetes or “sugar diabetes” other than
during pregnancy (for female respondents). Because this survey question precluded
gestational diabetes, pregnant women (n = 603) were not excluded from the study. The
interview process did not discriminate between type 1 and type 2 diabetes. Survey
participants from whom diabetes status was not ascertained during the NHANES interview
were excluded from this study (n = 8). Among the remaining 10,283 adult respondents, 991
were categorized as having diabetes (including eight pregnant females), and 9292 were
categorized as not having diabetes.
Individuals who reported a previous diagnosis of diabetes were asked at which age
their diagnosis occurred. Age of diagnosis information was missing for 10 subjects in the
sample population. There were 83 subjects who reported an age of diagnosis younger than
20 years. Although type 1 diabetes typically occurs during these younger ages, there was
no definitive way to differentiate between type 1 and type 2 diabetes, and therefore we
did not exclude any subject based on age of diabetes diagnosis.
Demographics and risk factors
Sex, age, and race were self-reported during the survey interview. Age was recorded as
the subject’s age in years at the time of interview. The age categories were
20–39 years, 40–59 years, and 60 years and older (33). Race and ethnicity
were categorized in the following groups: non-Hispanic white, non-Hispanic black, Mexican
American, and “other,” which consisted of all other individual and
multiracial groups. Statistical results for the “other” category are not
described because the wide variability within the group prevents meaningful
interpretation of estimates.
Socioeconomic status was assessed by poverty income ratio (PIR) and education level of
the participants. The PIR, based on family size, is the ratio of family income to the
family’s poverty threshold level, determined by the Bureau of the Census (34).
NHANES calculated participants’ PIR values using self-reported family income data.
We used the following categories: PIR <1.00, PIR 1.00–1.85, and PIR ≥1.86.
PIR values less than 1.00 are deemed to be below the poverty threshold. Some federally
funded food assistance programs have an eligibility cut point of 1.85 (33,34). Education
level was self-reported as the highest level achieved and was categorized as less than
high school, high school or general equivalency diploma (GED), and more than high
school.
During the NHANES physical examination, survey participants had both standing height
(m) and weight (kg) measured, which were used to calculate body mass index (BMI
[kg/m2]). Healthy weight was defined as BMI <25, overweight as BMI
25–29, and obesity as BMI ≥30. Individuals who did not undergo a physical
exam or who had missing BMI information and all women who were reported as being
pregnant at the time of interview were excluded from analyses that contained BMI.
Family history
Participants were asked whether any biological member of their family, living or
deceased, had ever been told he/she had diabetes. Family history information was not
available from 216 individuals because of participant refusal (n = 2) and lack of
knowledge of family medical history (n = 214). Subjects specified the relationship of any
family member with diabetes; however, diabetes in children of the participants was not
ascertained. We defined family history as having a first-degree relative (parent and/or
sibling) with diabetes and categorized subjects according to parental and sibling
diabetes status and number of first-degree relatives with diabetes.
Statistics
Statistical analyses were conducted using SAS version 9.1.3 (SAS Institute Inc, Cary,
NC). This newest version permits analyses of complex survey designs. To achieve
sufficient sample sizes, NHANES oversamples certain populations (33,34); thus,
appropriate NHANES sample weights, stratums, and primary sampling units (PSUs) were used
to account for complex sampling design, differential probabilities of selection, and
nonresponse. Poststratification adjustments were applied by NHANES to the sample
weights based on census population controls (33-35).
Prevalence estimates for diabetes, stratified by demographics and risk factors, were
calculated using NHANES sampling weights and are extrapolated to the adult,
noninstitutionalized, civilian U.S. population. Comparisons of diabetes prevalence
between different groups were performed using F tests based on design-adjusted Rao–Scott
chi squares (χ2). Age-adjusted prevalence (not shown) for the
gender–race
groups, based on the standard U.S. Census 2000 population (36), were deemed unreliable
because of large associated standard errors and small sample sizes, especially in the
group aged 20–39 years. For subjects with diabetes, the average age at diagnosis
was examined by demographic and risk factors.
Crude and adjusted odds ratios (OR) and 95% confidence intervals (CI) for diabetes
associated with family history were calculated through logistic regression analyses,
which modeled the binary outcome of diabetes status (yes/no). Individual Wald
χ2 tests and P values for all β estimates were computed. Four
regression models were developed to first analyze family history independently, then in
combination with demographic and risk factors demonstrating significant association with
diabetes status. Variance estimates and standard errors were calculated using the Taylor
expansion method. Any estimate with a relative standard error greater than 30% was considered to
be statistically unreliable. Significance testing of interaction terms was performed to
assess potential interaction between the factors included in the models. Likelihood ratio
tests, multivariate Wald χ2 tests, and F tests were calculated to test
for overall model significance. All P values less than .05 were considered statistically
significant.
Back to top
Results
Demographics and risk factors
The frequencies and weighted percentages of adults with diabetes are stratified by
demographic and risk factors (Table 1). The overall estimated prevalence of diabetes
among adults, representative of the civilian U.S. population, was 6.5%. Among men, the
diabetes prevalence of non-Hispanic black men was significantly higher than that of
Mexican American men (P = .01). Non-Hispanic black women had the highest
prevalence of diabetes (11.4%) among all gender–race groups. The diabetes prevalence of
non-Hispanic black women was significantly higher when compared to the prevalence of
non-Hispanic white women (P < .001) and Mexican American women (P = .007).
Mexican American women had significantly higher diabetes prevalence than non-Hispanic
white women (P = .004).
The prevalence of diabetes significantly increased with age at interview (P =
.001), and individuals 60 years and older experienced the highest prevalence (15.1%).
Among the three PIR categories, adults in the group with the highest PIR level had
significantly lower diabetes prevalence than adults at poverty level (P = .008)
and in the middle PIR category (P < .001). Additionally, adults with less than
a high school education experienced significantly higher diabetes prevalence than both
those with a high school education (P < .001) and more than a high school
education (P < .001). Finally, diabetes prevalence increased significantly with higher
BMI status (P < .001). Overweight adults were almost twice as likely to have diabetes
than healthy-weight adults, and obese adults were nearly four times as likely
than healthy-weight adults.
For the individuals in the study who had diabetes, self-reported age of diabetes
diagnosis was assessed (data not shown). Among men who had diabetes, the average age of
diagnosis for the three race/ethnicity categories was similar: 46.4 years (95% CI,
43.3–49.4) for Non-Hispanic whites, 45.1 years (95% CI, 41.4–48.8) for
non-Hispanic blacks, and 45.0 years (95% CI, 42.1–47.9) for Mexican Americans. Overall,
men with diabetes had a mean age of diabetes diagnosis of 45.7 years (95% CI,
43.2–48.3). In contrast, women who had diabetes showed more striking differences in
age of diagnosis among race groups. The mean age of diagnosis was 48.8 years (95% CI,
44.6–53.0) for non-Hispanic white women, 43.6 years (95% CI, 41.6–45.6) for
non-Hispanic black women, and 40.4 years (95% CI, 37.5–43.3) for Mexican American
women. Overall, women who had diabetes had an average age at diagnosis of 46.4 years (95% CI,
43.9–49.0). In addition, individuals who had diabetes and were obese had a younger
mean age of diabetes diagnosis at 43.7 years (95% CI, 40.9–46.6) than overweight (48.6
years; 95% CI, 45.8–51.4) and healthy-weight (47.3 years; 95% CI, 44.1–50.4)
individuals with diabetes.
Family history
Table 2 displays the frequencies and percentages of individuals who had diabetes in
the study according to family history status: 3172 adult respondents reported having a
family history of diabetes in a first-degree relative (parents and siblings) within the
study population of 10,283. The diabetes prevalence for individuals with a family history was
more than four times higher than the prevalence for individuals without a family history
(P < .001). Among adults with a family history, diabetes prevalence increased
significantly with a corresponding increase in number of family members with diabetes
(P < .001). The diabetes prevalence for individuals with three or more
first-degree relatives with diabetes (44.4%) was higher than the prevalence associated
with any other demographic or risk factor measured.
Diabetes prevalence associated with parental history significantly increased with the
number of affected parents (P < .001). The diabetes prevalence for individuals
with a diabetic mother (16.5%) was higher than for individuals with a diabetic father
(12.4%). In addition, having a sibling with diabetes conferred a diabetes prevalence
approximately 4.5 times higher than the prevalence for individuals without a diabetic
sibling (P < .001).
Further assessment of age of diagnosis (data not shown) showed that among individuals
with diabetes who had a first-degree relative with diabetes, the mean age of diagnosis
was 44.5 years (95% CI, 42.4–46.6) compared with 48.5 years (95% CI, 45.4–51.6) for
individuals with diabetes who had no family history of diabetes. Moreover, there was more than an eight-year
difference in mean age of diagnosis of individuals with diabetes whose parents had
diabetes compared with individuals with diabetes whose parents did not have diabetes: 39.9
years (95% CI, 34.9–45.0) for individuals with two diabetic parents, 44.3 years (95% CI,
42.1–46.6) for individuals with one diabetic parent, and 48.3 years (95% CI,
45.7–51.0) for individuals with neither parent diabetic.
The presence of family history among adults differed by several factors and is
depicted in Figures 1–3. A significantly larger proportion of individuals with
diabetes reported having a family history of diabetes than individuals without diabetes
(P < .001). More women reported a family history than men (P = .006).
Compared with non-Hispanic whites, a higher percentage of non-Hispanic blacks (P
= .001) and Mexican Americans (P < .001) reported a family history of
diabetes. And
obese and overweight adults were more likely to have a family history of diabetes than
healthy-weight adults (P < .001 for both).
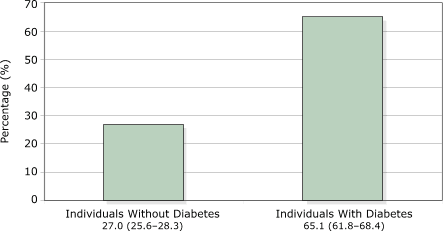
Figure 1.
Percentages (95% confidence interval) of U.S. adults aged 20 years and older reporting a
family history of diabetes, by self-reported diabetes status, NHANES 1999–2002. [A
text description of this graph is also available.]

Figure 2.
Percentages (95% confidence interval) of U.S. adults aged 20 years and older reporting a
family history of diabetes, by gender and race/ethnicity, NHANES 1999–2002. [A
text description of this graph is also available.]
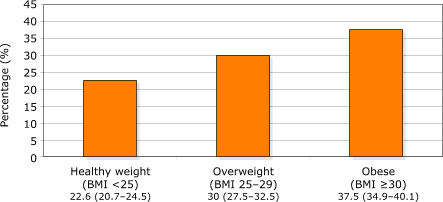
Figure 3.
Percentages (95% Confidence IntervaI) of U.S. adults aged 20 years and older reporting a
family history of diabetes, by body mass index (BMI), NHANES 1999–2002. [A
text description of this graph is also available.]
Multivariate analyses
The association of family history and diabetes was evaluated with four regression
models shown in Table 3. Each model used a different variable for family history and
analyzed these variables first independently (crude ORs), then with the addition of other
demographic and risk factors in the model (adjusted ORs). The family history variable was
statistically significant in crude analyses of each model. Adults with a family history
of diabetes had five times the odds of having diabetes compared with individuals who did
not have a family history of diabetes.
The adjusted models used the categorical factors of gender, age group, race/ethnicity, PIR, and BMI. Since PIR and education level were highly related, education level was not
included in the models. Regression analyses were also performed using age, PIR, and BMI
as continuous variables; however, this did not appreciably change the parameter estimates
corresponding to family history. In each of the four models, all additional
variables were statistically significant, with the exception of BMI 25–29, for
which the β estimate had a P value of .051 (Model 1) and .052 (Model
2).
After adjusting for the other variables, family history remained significantly
associated with diabetes status, though the adjusted ORs were slightly lower than the
crude ORs. Adults with a family history of diabetes had four times the odds of having
diabetes themselves compared with individuals without a family history (P <
.001). The odds of having diabetes were almost 15 times higher for those with three
or more diabetic relatives compared with adults with no family history (P <
.001). Parental and sibling diabetes history were also significantly associated with
increased risk of diabetes (P < .001 for both).
Back to top
Discussion
Our diabetes prevalence estimates for the gender–race groups were similar to a previous
review of data from NHANES III (1988–1994), which showed that for both men and
women, non-Hispanic blacks had a higher diabetes prevalence than non-Hispanic whites and
Mexican Americans (37). However, we did not find any studies using NHANES data that
examined family history of diabetes in relation to diabetes prevalence.
We found that family history of diabetes was a significant predictor of self-reported
diabetes among U.S. adults. We estimated that adults with a family history of diabetes in
a parent or sibling had four times the odds of having diabetes than adults
without a family history of the disease, after adjusting for gender, age, race, PIR, and BMI.
These findings are consistent with a recent summary review of 10 studies performed in
various countries, which reported that individuals with a positive family history of
diabetes had two to six times the risk of type 2 diabetes, compared with individuals
without a family history of the disease (19).
Moreover, our study demonstrated that adults with two diabetic parents had more than
twice the risk of diabetes than adults with only one diabetic parent. This additive risk
association has been described previously in a white U.S. population (22). Through
further examination of family history, an elevated diabetes risk was found to be
associated with an increased number of first-degree family members affected with
diabetes. Among all demographic and risk factors, the presence of three or more diabetic
first-degree relatives corresponded to the highest diabetes prevalence and OR for
diabetes. With the exception of a few studies, a relatively small amount of literature quantified
family history of diabetes in terms of the number of affected relatives.
Because family history was one of the strongest risks for diabetes in our study,
individuals with family members who have diabetes should be a screening priority for
diabetes. As stated previously, undiagnosed diabetes constitutes approximately 29.3% of
total diabetes prevalence (5). A current study demonstrated that the prevalence of
diagnosed diabetes has increased, and the prevalence of undiagnosed diabetes has
decreased for severely obese individuals (BMI ≥35), possibly because of a better
awareness of BMI as a risk factor among health care providers and improved screening
among these individuals (5). Similarly, the use of a family history screening tool could
capture many more of these undiagnosed individuals who would benefit from early
intervention.
Individuals who have close relatives with diabetes may be more motivated to seek early
health screening and thus more likely to be diagnosed than individuals without a
family history. Because of earlier screening, individuals with a family history would likely be younger at age of
diagnosis than individuals without a family history. This
likelihood is supported by both our study (44.5 years at diagnosis for individuals with a
family history vs 48.5 years at diagnosis for individuals without a family
history) and an Australian study, which found a trend of younger age of diabetes
diagnoses with increasing number of family members affected (24). Furthermore, research has shown
that individuals with type 2 diabetes are more likely to collect health information from
family members (38). However, our study indicated that a higher proportion of
adults who had diabetes did not know their family history of diabetes (2.7%)
when compared with adults
who did not have diabetes (2.0%), although this difference was not statistically
significant.
In addition, proportionately more women reported a father, mother, brother,
or sister
with diabetes than men, and there were more reports of female relatives with diabetes
than male relatives with diabetes. A recent study found that women were slightly more
likely than men to regard family history as very important to their own health and were
more likely to collect family medical information (38). Among men in our study,
2.2% did not know their family history of diabetes, compared with 1.8% of women.
Limitations
Limitations of our study include the inability to discriminate between cases of type 1
and type 2 diabetes. Had stratification been possible, we may have found different
relationships among diabetes, family history, and other factors. Subjects in our study
were not excluded based on age of diabetes diagnosis; such exclusion could have
eliminated many type 1 diabetes cases. It is estimated that approximately one
third of children with diabetes aged 12 to 19 years have type 1 diabetes. The prevalence of
type 1 diabetes among all ages in the United States is approximately 0.12% (39). Therefore,
the exclusion of individuals with type 1 diabetes from our study population would
probably not have affected our results appreciably.
Because diabetes diagnoses of participants and family members were self-reported and
not verified, the true diabetes prevalence may be misrepresented. Moreover, diabetes is
underdiagnosed in the United States, suggesting that the true prevalence is higher than
reported prevalence. Subjects also self-reported age of diabetes diagnosis, creating a
potential for recall bias. As previously mentioned, survey participants were not asked
about family history of diabetes in children, which limited our definition of
first-degree relatives to parents and siblings only. Also, NHANES excludes
institutionalized persons, including individuals residing in nursing homes, who are
likely to be older adults.
Implications
Our findings create several implications for public health. First, diabetes has
paralleled the obesity epidemic. Similar to a previous NHANES study (40), we found that
non-Hispanic black women had the highest prevalence of obesity (48.7%) compared
with
non-Hispanic white women (31.1%), Mexican American women (36.8%), non-Hispanic black men
(26.8%), non-Hispanic white men (27.9%), and Mexican American men (25.8%). The prevalence
of family history was also highest in women and non-Hispanic blacks among
genders and
races. Both obesity and diabetes have strong environmental components, such as diet and
physical activity. Thus, the presence of family history often reflects the shared
environment and health-related behaviors among family members in addition to hereditary
factors. The recognition of this high correlation among obesity, diabetes, and family
history can help guide population-appropriate health promotion activities.
Second, with the current striving for genetic awareness and competency in public health,
this study represents a feasible and inexpensive method of extracting genomic information
from existing population-based data sources. NHANES, a validated and well-recognized
survey, provides a substantial amount of health information on a national level. Other
population-based surveys also offer informative data that may pertain to genomics. There
are several steps public health practitioners can take now to access and use genomics and
incorporate genomics into programs. Because family history encompasses both genetic and
environmental factors, it can be applied to other chronic diseases involving multiple
complex etiologies, such as cardiovascular disease. Therefore, knowledge gained from
family history and diabetes can be translated into other public health program areas.
Finally, at the primary care and public health level, this study supports the
promotion of a family history tool for diabetes prevention and early detection strategies
as a valuable measure of diabetes risk. Family history is easily available and
inexpensive to obtain yet may be underused in health care practice (31). The following
three criteria are suggested for incorporating a family history tool into public health
screening: 1) the disease represents a significant public health burden, 2) family
history is an established risk factor, and 3) there are effective interventions for
prevention (31). Type 2 diabetes meets these criteria. It is evident that neither
diabetes nor obesity prevalence is decreasing; therefore, it is critical that we use all
available resources to quantify individual disease risk as accurately and completely as
possible.
Back to top
Acknowledgments
We thank Rebecca Malouin, Janice Bach, Corinne Miller, and Earl Watt with the Michigan
Department of Community Health for their helpful advice and resources. We also thank
Kathy Welch with the University of Michigan for guidance in using SAS programming and
analyses. Financial support was provided as part of a CDC genomics cooperative agreement
U58/CCU522826 in the Chronic Disease Prevention and Health Promotion Programs, Component
7, Genomics and Chronic Disease Prevention, Program Announcement 03022.
Back to top
Author Information
Corresponding Author: Ann M. Annis, RN, MPH, Genomics, Michigan Department of
Community Health, PO Box 30195, 3423 N MLK Jr Blvd, Lansing, MI 48909. Telephone: 517-335-9296. E-mail: annisa@michigan.gov.
Author Affiliations: Mark S. Caulder, MS, MPH, Michelle L. Cook, MPH, Debra Duquette,
MS, CGC, Michigan Department of Community Health, Lansing, Mich.
Back to top
References
- Centers for Disease Control and Prevention.
National diabetes fact sheet: general
information and national estimates on diabetes in the United States, 2003.
Rev ed. Atlanta (GA): U.S. Department of Health and Human Services, Centers for Disease Control
and Prevention; 2004.
- Centers for Disease Control and Prevention.
Prevalence of diabetes and impaired
fasting glucose in adults—United States, 1999-2000. MMWR Morb Mortal Wkly Rep
2003;52(35):833-7.
- The Expert Committee on the Diagnosis and Classification of Diabetes Mellitus.
Report of the Expert Committee on the Diagnosis and Classification of Diabetes Mellitus.
Diabetes Care 2003;26(Suppl 1):S5-S20.
- Kochanek KD, Smith BL.
Deaths: preliminary data for 2002. Natl Vital Stat Rep
2004;52(13):1-47.
- Gregg EW, Cadwell BL, Cheng YJ, Cowie CC, Williams DE, Geiss L, et al.
Trends in
the prevalence and ratio of diagnosed to undiagnosed diabetes according to obesity levels
in the U.S. Diabetes Care 2004;27(12):2806-12.
- Bishop DB, Zimmerman BR, Roesler JS. Diabetes. In: Brownson RC, Remington PL, Davis
JR, editors. Chronic disease epidemiology and control. 2nd edition. Washington (DC):
American Public Health Association; 1998. p. 421-64.
- Silverstein JH, Rosenbloom AL.
Type 2 Diabetes in Children. Curr Diab Rep
2001;1:19-27.
- American Diabetes Association.
Diagnosis and classification of diabetes mellitus.
Diabetes Care 2004;27(Suppl 1):S5-S10.
- American Diabetes Association. Screening for type 2 diabetes. Diabetes Care.
2004;27(Suppl 1):S11-S14.
- The Diabetes Control and Complications Trial Research Group.
The effect of intensive treatment of diabetes on the development and
progression of long-term complications in insulin-dependent diabetes
mellitus. N Engl J Med
1993;329(14):977-86.
- Reichard P, Nilsson BY, Rosenqvist U.
The effect of long-term intensified insulin
treatment on the development of microvascular complications of diabetes mellitus. N Engl
J Med 1993;329(5):304-9.
- Turner RC, Cull CA, Frighi V, Holman RR; UK Prospective Diabetes Study Group.
Glycemic control with diet, sulfonylurea, metformin, or insulin in patients with type 2
diabetes mellitus, progressive requirement for multiple therapies (UKPDS 49). JAMA
1999;281(21):2005-12.
- UK Prospective Diabetes Study Group.
Intensive blood-glucose control with sulphonylureas or insulin compared with conventional treatment and risk of complications
in patients with type 2 diabetes (UKPDS 33). Lancet 1998;352:837-53.
- Sherwin RS, Anderson RM, Buse JB,
Chin MH, Eddy D, Fradkin J, et al; American Diabetes Association; National Institute of Diabetes and Digestive and
Kidney Diseases.
Prevention or delay of type 2 diabetes. Diabetes Care 2004;27(Suppl
1):S47-S54.
- Knowler WC, Barrett-Connor E, Fowler
SE, Hamman RF, Lachin JM, Walker EA, et al; Diabetes Prevention Program Research Group.
Reduction in the incidence of type 2
diabetes with lifestyle intervention or metformin. N Engl J Med 2002;346(6):393-403.
- Pan XR, Li GW, Hu YH, Wang JX, Yang WY, An ZX, et al.
Effects of diet and exercise
in preventing NIDDM in people with impaired glucose tolerance. Diabetes Care
1997;20(4):537-44.
- Tuomilehto J, Lindström J, Eriksson JG, Valle TT, Hämäläinen
H, Ilanne-Parikka P, et al.
Prevention of type 2 diabetes mellitus by changes in
lifestyle among subjects with impaired glucose tolerance. N Engl J Med
2001;344(18):1343-50.
- Lee ET, Welty TK, Cowan LD, Wang W, Rhoades DA, Devereux R, et al.
Incidence of
diabetes in American Indians of three geographic areas, the Strong Heart study. Diabetes
Care 2002;25(1):49-54.
- Harrison TA, Hindorff LA, Kim H, Wines RC, Bowen DJ, McGrath BB, et al.
Family
history of diabetes as a potential public health tool. Am J Prev Med
2003;24(2):152-9.
- Matsuda A, Kuzuya T.
Relationship between obesity and concordance rate for type 2
(non-insulin-dependent) diabetes mellitus among twins. Diabetes Res Clin Pract
1994;26:137-43.
- Medici F, Hawa M, Ianari A, Pyke DA, Leslie RD.
Concordance rate for type II
diabetes mellitus in monozygotic twins: actuarial analysis. Diabetologia
1999;42:146-50.
- Meigs JB, Cupples A, Wilson PW.
Parental transmission of type 2 diabetes: the
Framingham Offspring study. Diabetes 2000;49:2201-7.
- Millar WJ, Young TK.
Tracking diabetes: prevalence, incidence and risk factors.
Health Rep 2003;14(3):35-47.
- Molyneaux L, Constantino M, Yue D.
Strong family history predicts a younger age of
onset for subjects diagnosed with type 2 diabetes. Diabetes Obes Metab
2004;6:187-94.
- Nakanishi S, Yamane K, Kamei N, Okubo M, Kohno N.
Relationship between development
of diabetes and family history by gender in Japanese-Americans. Diabetes Res Clin Pract
2003;61:109-15.
- Busch CP, Hegele RA.
Genetic determinants of type 2 diabetes mellitus. Clin Genet
2001;60:243-54.
- Klupa T, Malecki MT, Pezzolesi M, Ji L, Curtis S, Langefeld CD, et al.
Further
evidence for a susceptibility locus for type 2 diabetes on chromosome 20q13.1-q13.2.
Diabetes 2000;49:2212-6.
- Ghosh S, Watanabe RM, Valle TT, Hauser ER, Magnuson VL, Langefeld CD, et al.
The
Finland-United States investigation of non-insulin-dependent diabetes mellitus genetics
(FUSION) study. I. An autosomal genome scan for genes that predispose to type 2 diabetes.
Am J Hum Genet 2000;67:1174-85.
- Malecki MT, Moczulski DK, Klupa T, Wanic K, Cyganek K, Frey J, et al.
Homozygous
combination of calpain 10 gene haplotypes is associated with type 2 diabetes mellitus in
a Polish population. Eur J Endocrinol 2002;146:695-9.
- Mori Y, Otabe S, Dina C, Yasuda K, Populaire C, Lecoeur C, et al.
Genome-wide
search for type 2 diabetes in Japanese affected sib-pairs confirms susceptibility genes
on 3q, 15q, and 20q and identifies two new candidate loci on 7p and 11p. Diabetes
2002;51:1247-55.
- Yoon PW, Scheuner MT, Khoury MJ.
Research priorities for evaluating family history
in the prevention of common chronic diseases. Am J Prev Med 2003;24(2):128-35.
- National Center for Health Statistics.
National
Health and
Nutrition Examination
Survey [homepage on the Internet]. Hyattsville (MD): Centers for Disease
Control and Prevention [updated 2004 Sept 22; cited 2004 Nov 19].
- National Center for Health Statistics.
NHANES analytic guidelines: the
Third National Health and Nutrition Examination Survey, NHANES III (1988-1994) [monograph
on the Internet]. Hyattsville (MD): Centers for Disease Control and
Prevention; 1996 [cited 2004 Nov 19].
- National Center for Health Statistics.
NHANES 1999-2000 addendum to the NHANES III
analytic guidelines [monograph on the Internet]. Hyattsville (MD): Centers
for Disease Control and Prevention; 2002 [cited 2004 Nov 19].
- National Center for Health Statistics. Analytic and reporting guidelines: the Third National Health and Nutrition
Examination Survey, NHANES III (1988-94) [monograph on
the Internet]. Hyattsville (MD): Centers for Disease Control and Prevention;
2004 [cited 2004 Nov 19].
- Klein RJ, Schoenborn CA.
Age adjustment using the 2000 projected U.S. population.
National Center for Health Statistics. Healthy People 2010 Stat Notes 2001
Jan;(20):1-10.
- Harris MI, Flegal KM, Cowie CC, Eberhardt MS, Goldstein DE, Little RR, et al.
Prevalence of diabetes, impaired fasting glucose, and impaired glucose tolerance in U.S.
adults. The Third National Health and Nutrition Examination
Survey, 1988-1994. Diabetes Care 1998;21(4):518-24.
- Centers for Disease Control and Prevention.
Awareness of family health history as
a risk factor for disease—United States, 2004. MMWR Morb Mortal Wkly Rep
2004;53(44):1044-47.
- LaPorte RE, Matsushima M, Chang YF. Prevalence and incidence of insulin-dependent
diabetes. In: Diabetes
in America. 2nd edition. Bethesda (MD): National Institute of Diabetes and
Digestive and Kidney Diseases, National Institutes of Health; 1995. p. 37-46.
- Hedley AA, Ogden CL, Johnson CL, Carroll MD, Curtin LR, Flegal KM.
Prevalence of
overweight and obesity among US children, adolescents, and adults, 1999-2002. JAMA
2004;291(23):2847-50.
Back to top |
|
