 |
|
|
|
|
|
|
| ||||||||||
|
|
|
|
|
|
|
||||
| ||||||||||
|
|
|
|
|
Persons using assistive technology might not be able to fully access information in this file. For assistance, please send e-mail to: mmwrq@cdc.gov. Type 508 Accommodation and the title of the report in the subject line of e-mail. BioSense: Implementation of a National Early Event Detection and Situational Awareness SystemColleen A. Bradley,1,2 H.
Rolka,1 D. Walker,1 J.
Loonsk1 Corresponding author: Colleen A. Bradley, CDC, 1600 Clifton Rd., NE, MS E-06, Atlanta, GA 30333. Telephone: 404-4986312; Fax: 404498-6145; Email: Cbradley1@cdc.gov. Disclosure of relationship: The contributors of this report have disclosed that they have no financial interest, relationship, affiliation, or other association with any organization that might represent a conflict of interest. In addition, this report does not contain any discussion of unlabeled use of commercial products or products for investigational use. AbstractBioSense is a CDC initiative to support enhanced early detection, quantification, and localization of possible biologic terrorism attacks and other events of public health concern on a national level. The goals of the BioSense initiative are to advance early detection by providing the standards, infrastructure, and data acquisition for near real-time reporting, analytic evaluation and implementation, and early event detection support for state and local public health officials. BioSense collects and analyzes Department of Defense and Department of Veterans Affairs ambulatory clinical diagnoses and procedures and Laboratory Corporation of America laboratory-test orders. The application summarizes and presents analytical results and data visualizations by source, day, and syndrome for each ZIP code, state, and metropolitan area through maps, graphs, and tables. An initial proof of a concept evaluation project was conducted before the system was made available to state and local users in April 2004. User recruitment involved identifying and training BioSense administrators and users from state and local health departments. User support has been an essential component of the implementation and enhancement process. CDC initiated the BioIntelligence Center (BIC) in June 2004 to conduct internal monitoring of BioSense national data daily. BIC staff have supported state and local system monitoring, conducted data anomaly inquiries, and communicated with state and local public health officials. Substantial investments will be made in providing regional, state, and local data for early event detection and situational awareness, test beds for data and algorithm evaluation, detection algorithm development, and data management technologies, while maintaining the focus on state and local public health needs. The BioSense InitiativeBioSense is a CDC initiative to support enhanced early detection and situational awareness for possible biologic terrorism attacks and other events of public health concern on a national level. It is the primary early event detection component of CDC's Public Health Information Network (1). BioSense Initiative goals include the advancement of analytics for pre-diagnostic and diagnostic data; collaboration with state, local, and regional systems to provide data in nearreal time; increased sharing of approaches and technology among federal, state, and local levels of public health; and the promotion of national standards and specifications to ensure integration with other public health systems (2). The BioSense software application and the BioIntelligence Center (BIC) are two key components of CDC's BioSense Initiative. The BioSense application is an Internet-based software system for collecting, analyzing, and visualizing data reported to BioSense. Since June 2004, BIC has conducted monitoring and investigation of BioSense national data daily and supports state and local system monitoring and data anomaly investigations. Although the BioSense Initiative involves broader activities in the public health context, this report is primarily focuses on surveillance use of the BioSense application. The BioSense ApplicationOverviewThe purpose of the BioSense application is to provide early event detection and situational awareness critical for biologic terrorism surveillance and routine public health event management. BioSense uses near-real time reporting of health data, performing analysis and data visualization techniques on diagnostic and pre- diagnostic electronic data sources and providing the results to state and local public health departments for use in detecting and characterizing events of potential public health importance. BioSense summarizes and presents analytical results and data visualizations by source, day, and syndrome for each state and metropolitan area (MRA) through maps, graphs, and tables. States and MRA jurisdictions are defined by a set of ZIP codes. Data SourcesBioSense has implemented three national data sources: Department of Defense (DoD) Military Treatment Facilities, Department of Veterans Affairs (VA) treatment facilities, and Laboratory Corporation of American (LabCorp®) test orders. Approximately 700 DoD and 1,100 VA medical facilities report data to BioSense (3,4). LabCorp operates a nationwide network of 31 primary testing locations and more than 1,100 patient service centers (5). Data are received and analyzed daily and historical data are available; DoD data have been collected since May 2003; VA, December 2003; and LabCorp, June 2004. Since October 2004, the average number of daily records received for DoD has been 98,000; VA, 151,800; and LabCorp, 137,600. Both DoD and VA provide ambulatory-care data in the form of International Classification of Diseases, Ninth Revision, Clinical Modification (ICD-9-CM) diagnosis codes and current procedural terminology (CPT®) medical procedure codes. LabCorp provides test orders and ICD-9-CM codes associated with the reason for the orders. All data sources include additional information with each record (e.g., patient age, sex, ZIP code of residence, and facility identifier and ZIP code). Experts from different agencies participated in mapping each data source to 11 syndrome categories: botulism-like, fever, gastrointestinal, hemorrhagic illness, localized cutaneous lesion, lymphadenitis, neurologic, rash, respiratory, severe illness and death, and specific infection (6,7). Statistical AnalysisThe calculations for analytics that appear in BioSense are pre-generated daily. Small area regression and testing (SMART) is an adaptation of a generalized linear mixed modeling (GLMM) technique (8). The SMART model takes into account multiple comparisons and includes parameters for ZIP code, day of the week, holiday, and day after a holiday. The model also uses sine and cosine terms for seasonal cyclic variation. Parameters are calculated weekly for each date-source-syndrome-ZIP code combination. Predicted values are generated by the model, and the observed data counts for each combination are compared with these predicted values daily under the assumption of a Poisson distribution of events. Significant differences between the observed and predicted values are indicated in the application. The second analytical technique is an adaptation of a cumulative sum (CUSUM) approach that is used in stand-alone drop-in surveillance (9). It is used as a short-term surveillance technique to indicate recent data changes through the comparison of moving averages. Days that have variation higher than two standard deviations from the moving averages are indicated in the application. Because of high variability within the data, individual CUSUM values are calculated for each datesource-syndrome combination at the state or MRA level, rather than for individual ZIP codes. BioSense Home PageThe BioSense application home page provides analytical results to users approved to access data for their jurisdiction (Figure 1). These results indicate data anomalies that might require further investigation. On the left side of the home page, options are listed for changing the region being viewed, data transmission notes regarding the national data sources, and the Sentinel Infection Alerts section, which displays records of ICD-9 codes received that CDC has designated as potential biologic terrorism agents (10). In the center of the home page, the syndrome "punch cards" provide the jurisdictional analytical results for each syndrome across all data sources. For this display, elevated SMART or CUSUM scores for a state or MRA are indicated in the punch cards. There are elevated CUSUM scores for several syndromes (fever, lymphadenitis, neurological, and specific infection) (Figure 1). If a particular punch card is selected, detailed analytical information for that syndrome is presented in graphs, maps, and tables. Beneath the punch cards, the jurisdictional map portrays spatial results for analytics, and the time shift feature allows the user to determine temporal patterns. The table to the right of the map provides data source and ZIP code counts, with counts highlighted if associated with an elevated CUSUM or SMART score. The percentage of records received (table at the bottom of the BioSense home page) displays data receipt status, by data source, as a percentage equal to the number of records received out of the number expected to be received. The expected number is based on a historical day of week average. Low percentages indicate that full data delivery might not have occurred, whereas percentages substantially >100% indicate that 1) data might have been duplicated in the transmission process, 2) a recent increase in the number of facilities reporting data occurred, or 3) a genuine increase occurred in the number of clinic visits or laboratory tests ordered. Health Indicator PagesThe Health Indicator pages provide access to the data visualization components for the purpose of evaluating data patterns across sources, geographically, and temporally. The syndrome consolidated line graphs present data for each source on one graph so the user can determine patterns across sources for each syndrome (Figure 2). Selecting a syndrome consolidated graph allows the user to view data for that syndrome in graphic, spatial, and tabular presentations. The line graph presentation permits users to compare jurisdictional and national data patterns for each data source (although state and local users do not have access to detailed national data) (Figure 3). The patterns in the VA ambulatory-care diagnosis count data for Atlanta closely mirror the national data (Figure 3). The map presentation illustrates data by ZIP code for each source (Figure 4). The user can view detailed information regarding individual ambulatory-care visits and laboratory-test orders within the tabular presentation (Figure 5). Different data selection and display options provide flexibility when viewing the visualizations, including the option to evaluate data patterns at the ZIP code level, view up to 1 year of data, and examine data for certain age and sex combinations. BioSense Application ImplementationInitial CDC EvaluationThe BioSense application initial design, data acquisition, and system development involved several challenges. These challenges included the nontraditional nature of the surveillance system, the use of novel data sources, and the lack of pre-defined user requirements. Therefore, an initial "proof of concept" evaluation project was conducted in November 2003 before the system was made available to state and local users. This evaluation involved incorporating known embedded signals into BioSense data to determine if these data aberrations could be distinguished in the application. Such signals were identifiable in the application based on the results of the proof of concept evaluation. Evaluators provided feedback, which resulted in modifications to the initial system design that made it more useful. Implementation for State and Local Public Health OfficialsBefore BioSense was ready to release to state and local public health users in April 2004, state and local public health leaders identified appropriate BioSense administrators within each state and MRA. These administrators were program officials responsible for granting access to the application and appropriate state, metropolitan area, and ZIP code level data and were the points of contact for data aberrations observed in BioSense. State level users were granted access to view BioSense data for their state as well as any metropolitan areas within their state, whereas users at the local level were granted access only to MRA level data. Local users whose jurisdiction did not fall within a BioSense MRA were granted access to state or ZIP code level data, if the state administrator granted approval. BioSense administrators were identified for 49 states and approximately 30 major MRAs, and during April--December 2004, approximately 300 users were approved to access BioSense through the Secure Data Network. As a critical information system, BioSense leverages security services and protections for key CDC information systems. The services and protections provided by security mechanisms (e.g., Secure Data Network [SDN]) are inclusive of user identity management and authentication as well as authorization controls to ensure appropriate access to BioSense data. In addition, the security measures used by BioSense facilitate compliance with different federal laws and regulations, including: Privacy Act of 1974, Health Insurance Portability and Accountability Act of 1996 (HIPAA), Federal Information Security Management Act of 2002 (FISMA), E-Government Act of 2002, and Homeland Security Presidential Directive (HSPD) -12. In-depth training regarding the numerous system functionalities, analytics, and data visualizations was initiated. Training sessions were conducted on a bimonthly basis and an interactive telephone bridge and web-based presentation (webinars) was used. The webinars provided a general overview of the BioSense system and its functionalities, the tools users needed to begin monitoring data, a forum for addressing questions, and information regarding new system functionalities and data sources. During June--December 2004, approximately 250 BioSense users participated in one of 14 training sessions. In addition to training, user support played two major roles: 1) the provision of requested information and assistance to state and local public health officials and 2) the opportunity to obtain user feedback for incorporation into system development and enhancement. Through the BioSense help email address and the technical help desk phone line, hundreds of questions were routed to the appropriate BioSense team member for response. In an example of a state BioSense administrator request, historical influenza season respiratory syndrome data was provided for establishing baseline patterns and tracking influenza season patterns for 2004--05. In response to local user requests, customized BioSense MRA jurisdictions have been created. During the G-8 summit in June 2004, the Brunswick, Georgia, Savannah, Georgia, and Coastal Carolina, South Carolina MRA regions were created to improve surveillance during that important convention. Other requested MRA regions that were created included Pierce County, Washington, and Research Triangle, North Carolina. BioIntelligence CenterCDC initiated BIC in June 2004 to support state and local early event detection capabilities. The BIC functions were to conduct daily monitoring and investigation of BioSense national data, support state and local system monitoring and data anomaly investigations, engage in communication with state and local public health officials in all relevant data anomaly investigations, and develop standard operating procedures for data evaluation. Daily monitoring included investigating, analyzing, and tracking data aberrations (11). BIC monitors also played an active role in system troubleshooting and in generating ideas for system enhancements. Examples included improved labeling of data visualizations, increased capability to navigate between pages, and descriptions provided of ICD-9-CM codes associated with individual patient visits. BIC has actively tracked system use since its inception (Figure 6). Because BioSense monitoring by state and local public health officials varied, the BIC activities ensured that all state and MRA data were being evaluated regularly. BIC has provided state and local public health officials with surveillance support for major events (e.g., political conventions and presidential debates) and day-to-day evaluation of data to assist users to better understand monitoring methods and data aberrations. Communication with state and local BioSense users regarding data aberrations of potential concern has been a mutual learning process as CDC and state and local users work to characterize the data in BioSense. User-requested BIC reports provided a summary of jurisdictional data activity within BioSense. Monitors examined the available data and determined if particular situations might require further monitoring or investigation. An example of such a situation included increased syndrome activity for a particular ZIP code or set of adjacent ZIP codes over subsequent days, with epidemiologic patterns related to the disease diagnoses or patient age and sex (11). Reports regarding diagnoses of diseases presented in the Sentinel Infection Alerts were communicated to state and local public health officials upon request. Because BIC monitors reviewed data for a set of jurisdictions daily, they were familiar with data activity for that particular area of the country. State and local officials were able to contact BIC monitors and receive responses to questions, feedback, and requests for assistance. Data-Related ConcernsBIC has encountered multiple data-related concerns since it was established. The data include duplicate or updated records. Appropriate de-duplication methods were used to remove these records that had been previously transmitted. The data were opportunistic and noisy. For the empirical process for analysis, no sampling design existed; therefore, the potential for confounding between reporting volume and event intensity existed. Data lag between the time of the patient encounter and the time when the related data were accessible in the application was a key issue and varied among data sources and reporting facilities within the same data source. Incomplete data were available for generation of the analytical results and for evaluating data patterns, although data lag has improved. During January--June 2004, the average number of days between the patient clinical encounter and the availability of this information in the BioSense application decreased and stabilized (Figure 7). The percentage of records received table was presented to illustrate that unusual analytical results might occur because of issues related to data transmission and lag rather than because of true health activity (Figure 1). Data lag had implications for inaccuracies in producing analytical results, and methods to adjust for the potential inaccuracies in the algorithmic outputs will be evaluated. Data coverage was also an issue. Certain data sources were limited in their representation of the health status of the general population. VA patients were primarily older, whereas DoD included both service personnel and their dependents; both VA and DoD data represented subsets of the population. The data were national; however, geographic coverage varied by data source. The analysis, visualization, and reporting (AVR) ZIP code for the DoD data was the medical facility ZIP code (rather than ZIP code of patient residence) because DoD personnel might be stationed a substantial distance from their home residence. Therefore, the DoD data provided excellent coverage, but only for the ZIP codes where medical facilities were located (Figure 8). LabCorp data were analyzed and presented by the patient residence ZIP code when available. When this ZIP code was not available, either the medical facility or laboratory testing facility ZIP codes were used. LabCorp data coverage was more complete in the eastern United States and in metropolitan areas (Figure 9). The VA analysis, visualization, and reporting ZIP code was the patient residence ZIP code, so coverage was broader than for DoD. A higher number of patient visits usually occurred in the eastern United States and in areas of high population density (Figure 10). Conclusion and Future DirectionsIn using BioSense, one lesson learned was that public health officials tended to prefer varied analytic approaches and data sources. BioSense implementation provided insight into the usefulness of analytical techniques in guiding users to potentially important health activity. As a result, frequent training and data aberration monitoring support were required. Detailed information regarding the data loading performance, analytics, data sources, syndrome mappings, application functionalities, and data selection and display options were provided. Communicating with state and local system users as well as continuing training and user support were essential as the system was developed. Characterization of data aberrations has involved collaboration among members of BIC and state and local public health officials and has been a mutual learning experience. As implementation of the BioSense Initiative continues, substantial investments will be made in 1) regional, state, and local data sources for early event detection and situational awareness, 2) test beds for data source and algorithm evaluation, 3) algorithm development and advancement, and 4) data management technologies. Key considerations in providing data for early event detection and situational awareness will include adherence to Public Health Information Network Preparedness requirements and standards as well as use in local, state, and national public health systems (12). The use of test beds for data and algorithm evaluation will allow for rigorous evaluation of the use of investigational data sources, detection algorithms, and approaches. Algorithm development and advancement will include an emphasis on implementation in a standard technical environment and the importance of multiple data source integration for increased sensitivity and specificity. Implementation of a spatio-temporal scanning statistic is being planned (13). User-defined analytical thresholds and syndrome categories will also be explored. Data management approaches will include probabilistic, population-based profiles of health events or outbreaks, and text parsing. Natural language processing, data mapping capabilities for chief complaints and other data sources, and pre-analysis data processing and smoothing will also be explored. The focus on state and local public health needs will be maintained. The framework is being developed for a working group that will foster relationships and communication among local, state, and federal public health officials, and facilitate information exchange regarding data sources, analytics, monitoring practices, and other aspects of early event detection and situational awareness. The creation of additional user-requested customized MRAs and the incorporation of state and local level data will enable state and local users to better monitor the health status of their jurisdictions. BIC will contribute toward developing standard operating procedures for early event detection and anomaly investigation, notification of specific events of concern, and collaboration with state and local public health officials in monitoring BioSense data. The BioSense Initiative will continue to better prepare the public health community for biologic terrorism--related and other surveillance challenges in the 21st century. Acknowledgments The authors thank Roseanne English-Bullard and Paul McMurray for their contributions of data analyses and maps addressing data-related issues; Leslie Sokolow, for comments and the map illustrating state and local public health use of BioSense; Shirley Willson, for technical assistance; Nancy Grady, for contributing information regarding data; and Toby Slusher and David King, for information regarding CDC systems security. References
Figure 1 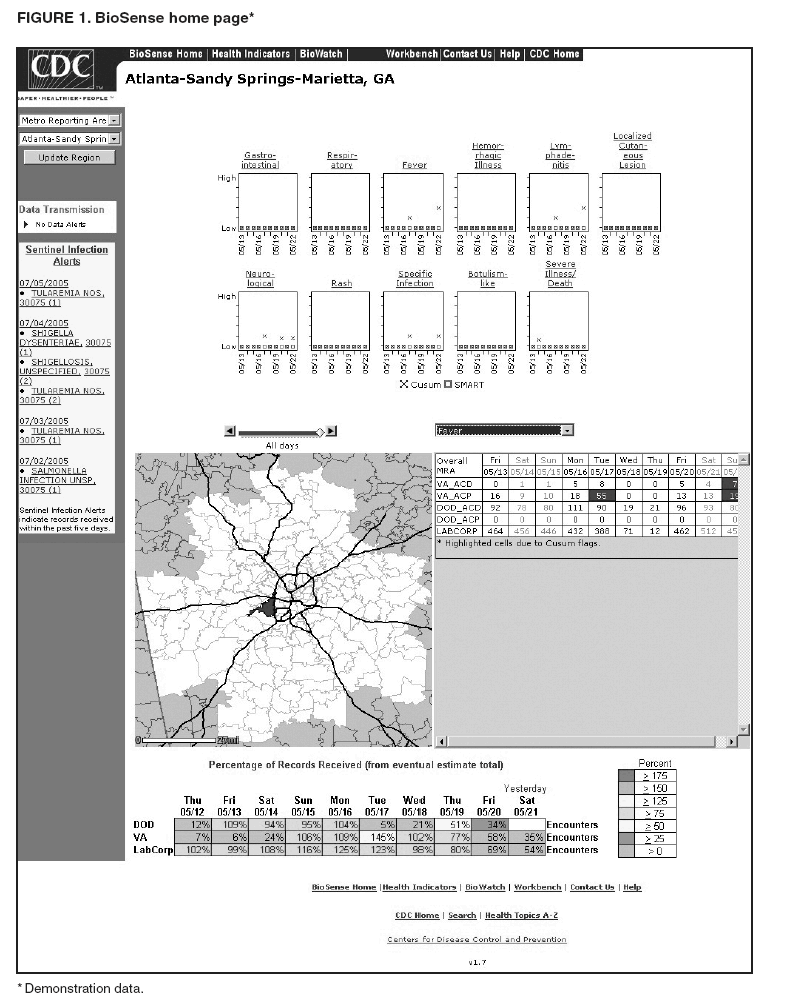 Return to top. Figure 2 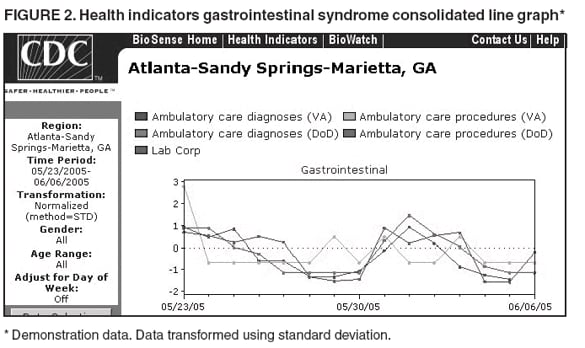 Return to top. Figure 3 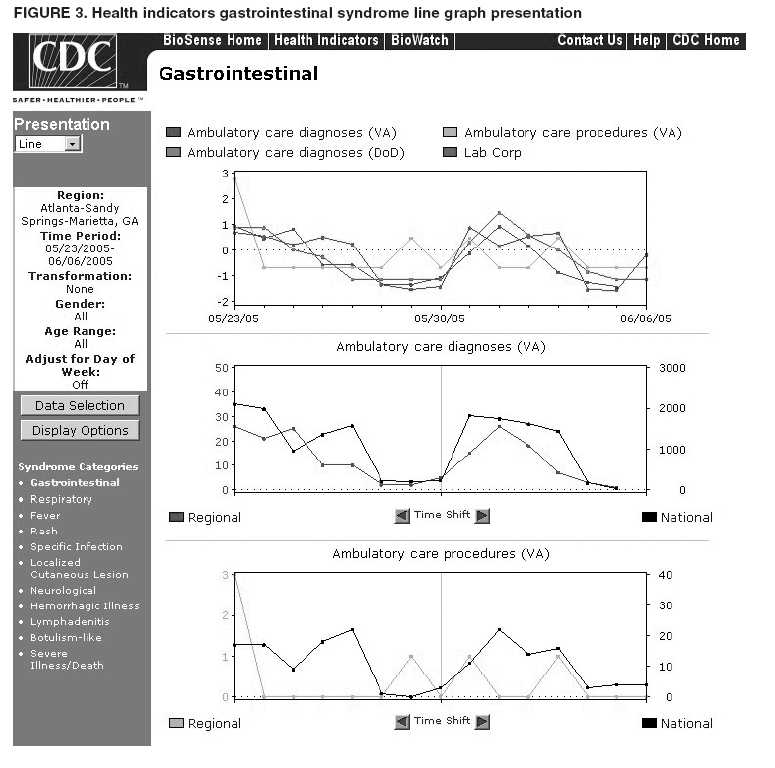 Return to top. Figure 4 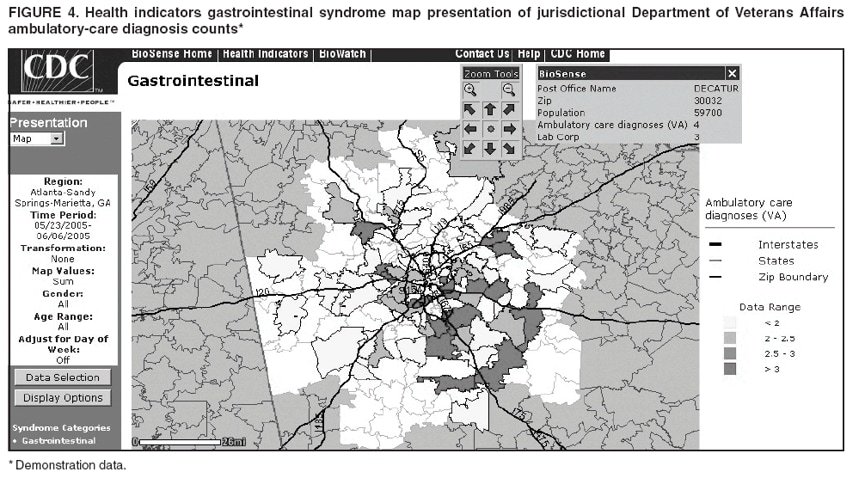 Return to top. Figure 5 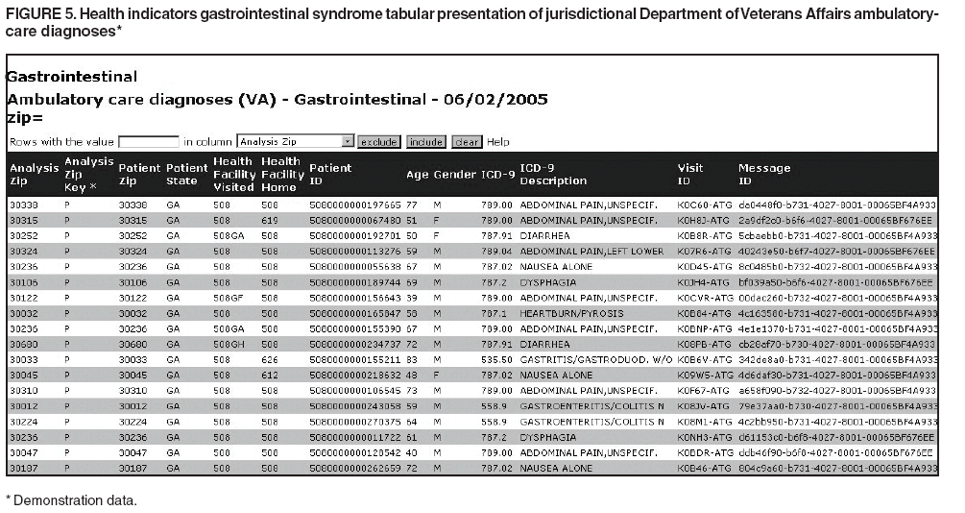 Return to top. Figure 6 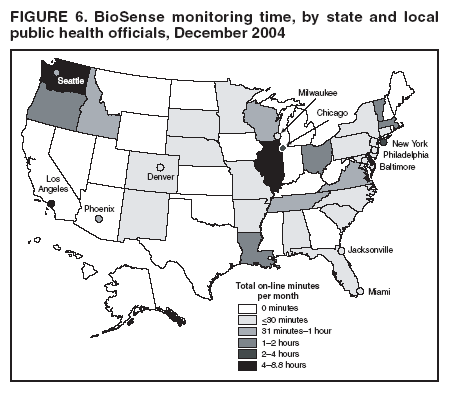 Return to top. Figure 7 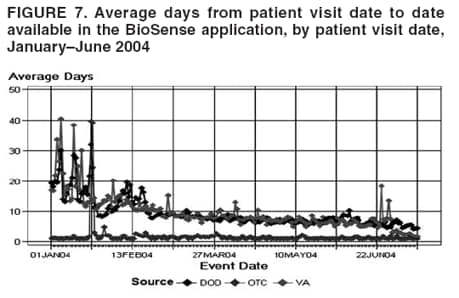 Return to top. Figure 8 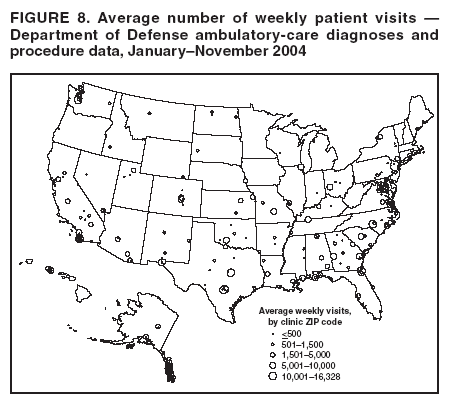 Return to top. Figure 9 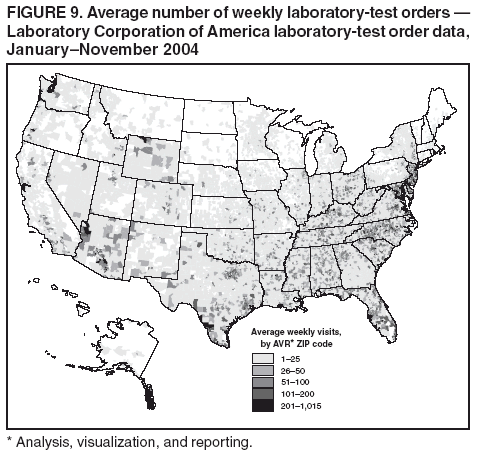 Return to top. Figure 10 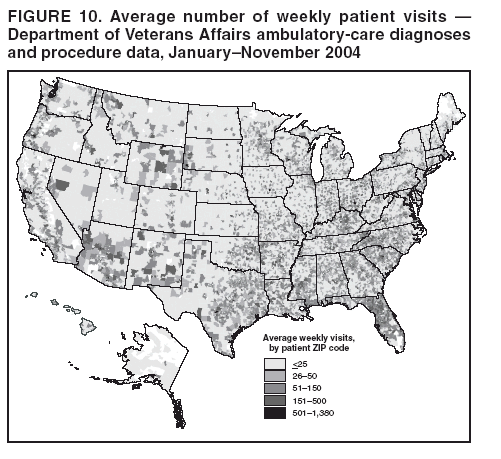 Return to top.
Disclaimer All MMWR HTML versions of articles are electronic conversions from ASCII text into HTML. This conversion may have resulted in character translation or format errors in the HTML version. Users should not rely on this HTML document, but are referred to the electronic PDF version and/or the original MMWR paper copy for the official text, figures, and tables. An original paper copy of this issue can be obtained from the Superintendent of Documents, U.S. Government Printing Office (GPO), Washington, DC 20402-9371; telephone: (202) 512-1800. Contact GPO for current prices. **Questions or messages regarding errors in formatting should be addressed to mmwrq@cdc.gov.Date last reviewed: 8/5/2005 |
|||||||||
|