 |
|
|
|
|
|
|
| ||||||||||
|
|
|
|
|
|
|
||||
| ||||||||||
|
|
|
|
|
Persons using assistive technology might not be able to fully access information in this file. For assistance, please send e-mail to: mmwrq@cdc.gov. Type 508 Accommodation and the title of the report in the subject line of e-mail. Syndromic Surveillance on the Epidemiologist's Desktop: Making Sense of Much DataKathy J. Hurt-Mullen,1 J.
Coberly2
Corresponding author: Kathy J. Hurt-Mullen, Montgomery County Department of Health and Human Services, 2000 Dennis Avenue, Silver Spring, MD 20902. Telephone: 240-777-1643; Fax: 240-777-4750; E-mail: Kathy.Hurt-Mullen@montgomerycountymd.gov. Disclosure of relationship: The contributors of this report have disclosed that they have no financial interest, relationship, affiliation, or other association with any organization that might represent a conflict of interest. In addition, this report does not contain any discussion of unlabeled use of commercial products or products for investigational use. AbstractIntroduction: Syndromic surveillance systems are becoming increasingly common in health departments. These systems represent a substantial improvement in the timeliness of ascertainment of community health status. For the value of such systems to be realized, protocols are needed for review and analysis of the findings that these systems produce. Methods: A workgroup of experienced syndromic surveillance users and developers was convened to discuss approaches to data review and analyses. The discussion was structured to include general principles of the use of syndromic surveillance; how and why specific data are reviewed; integration of multiple data sources; daily versus research uses of systems; how data anomalies are identified by users and surveillance systems; the relative merits of anomalies; how a data anomaly is investigated to determine if it warrants a public health response; and how such a public health response should be framed. Results: From this discussion, a generalized and more detailed process was documented that describes the common elements of analysis used by the workgroup participants. Conclusion: Establishment of a framework for evaluation and response to syndromic surveillance data will facilitate the implementation of these systems and standardization of procedures for validation of system findings. Careful development of an evaluation and response framework should be undertaken to assess whether use of syndromic surveillance systems requires excess work to distinguish between statistical anomalies and important public health events. IntroductionAlthough initially conceived to assist public health officials in detecting occurrence of intentional disease outbreaks (i.e., those caused by a biologic terrorist attack), syndromic surveillance systems are becoming a basic tool for public health epidemiologists. The majority of these systems employ multiple data streams (including data from hospital emergency departments [EDs] or other emergency encounters, physician office visits, overthe-counter [OTC] pharmaceutical sales, and school absenteeism records) to detect potential disease clusters in the community. The increased sensitivity provided by multiple data sources requires users to review and summarize an unprecedented amount of data daily. Clear guidelines for using these systems are needed to help epidemiologists 1) quickly identify and disregard statistically significant but epidemiologically unimportant events, 2) distinguish true disease clusters from groups of unrelated cases, 3) determine which true disease clusters warrant further evaluation or public health response, and 4) perform these tasks quickly and cost effectively. The Montgomery County (Maryland) Department of Health and Human Services (MCDHHS) has been using the Electronic Surveillance System for Early Notification of Community-Based Epidemics (ESSENCE) syndromic surveillance system continuously since spring 2001. This report describes a framework for daily evaluation of ESSENCE data that was developed jointly by staff from MCDHHS and the Johns Hopkins University Applied Physics Laboratory (JHU/APL). This framework can be generalized for use with other electronic syndromic surveillance systems. MethodsThe framework for using the ESSENCE system presented in this report is based on the experience of the authors gained through daily use of the MCDHHS ESSENCE system and on a structured discussion with 10 syndromic surveillance systems users and persons with expertise that was designed to collect qualitative information on how public health professionals use ESSENCE. Participants included representatives of state health agencies in Maryland, Virginia, and the District of Columbia; civilian and military users of ESSENCE; and members of the JHU/APL ESSENCE development team. Topics discussed included general principles of the use of syndromic surveillance; how and why specific data are reviewed; integration of multiple data sources; daily versus research uses of the systems; how data anomalies are identified by users and by the surveillance systems; the relative merits of anomalies; how a data anomaly is investigated to determine if it warrants a public health response; and how such a public health response should be framed. Comments on how and why syndromic surveillance is used were also provided by representatives of the New York City Department of Health and Mental Hygiene after a review of the meeting notes. Syndromic surveillance systems such as ESSENCE are intended to identify higher-than-expected counts of visits to EDs or physicians' offices, retail sales of pharmaceutical products, or other similar events grouped into broad syndromic categories. These increases are assumed to represent increases in disease incidence. Syndromic surveillance systems can identify certain health events that are of sufficient concern that a single occurrence warrants a public health response (e.g., the collection of additional data when certain rashes appear among persons in particular age groups or with certain neurologic complaints). Those procedures and public health responses are not considered in this report. ResultsUse of Syndromic Surveillance DataEpidemiologists use syndromic surveillance systems for multiple purposes. Because these systems collect and store longitudinal disease incidence data, epidemiologists can use them to trace disease patterns over time, describe patterns of disease in the community geographically and demographically at any given time, and determine the impact of specific targeted health interventions. These systems most commonly are used for early detection of changes in a community's health status that might represent a public health emergency. A protocol is followed to detect and analyze the importance of anomalies in the data (Figure 1). Anomaly DetectionAll syndromic surveillance systems use a statistical algorithm to determine whether the number of reports for a specific syndrome exceeds the norm for the community and then to alert the user that a statistically significant increase has occurred. However, important health events can be detected in other ways. Syndromic surveillance systems enable epidemiologists to systematically monitor disease trends and identify suspicious clusters of disease. Epidemiologists also receive information about unusual disease clusters or incidence from local health-care providers, which they then can evaluate in the surveillance system. Both system- and operator-generated alerts are considered to be of equal value. Anomaly detection presents jurisdictional challenges that should be accommodated in developing response guidelines. Although public health officials have obligations associated with defined geographic boundaries, neither the movement of persons nor the distribution of illness is so limited. Anomaly detection should be conducted at multiple levels (local, regional, state, and possibly federal) to capture anomalies that might remain undetected within any single jurisdiction. Characterization of AnomaliesAnomalies should be described fully to determine whether they are likely to represent an important public health event that requires a public health response. The anomaly should be described with respect to person, place, and time by using whatever demographic and geographic information is available. In addition, available clinical data (e.g., chief complaint and discharge diagnosis and disposition) should be evaluated and summarized. In certain cases, additional information (e.g., laboratory test requests or results or detailed ED admission data) might be available to further characterize the anomaly. Validation of AnomalyOnce the epidemiologist is convinced that an anomaly represents a true cluster of similar health events, whether the anomaly is expected or unusual should be determined. Normal seasonal and temporal syndrome and disease trends should be reviewed. Influenza-like illness is easily spotted in the majority of syndromic surveillance systems. An increase in disease causes regular statistical alerts in established syndrome groups as illness spreads through the community. Because this increase is expected each winter, the anomaly does not require further evaluation efforts. Similarly, environmental factors should be considered. For example, seasonal increases in pollen generate increases in respiratory illness, which might cause statistical alerts in surveillance systems even though these events are expected. If more than one source of data is available within a system, then part of the validation effort should be to ascertain whether corroboration is expected in those sources and whether it exists. Assessing Public Health Importance of FindingsOnce an anomaly is fully characterized, its public health importance should be considered. First, the magnitude and continuity of the increase generating the anomaly should be evaluated in the context of the particular syndrome group in question. Regardless of statistical significance, a substantial 1-day increase warrants more scrutiny than a limited one; similarly, a relatively modest increase during multiple days that deviates from known seasonal and historic patterns also should be evaluated closely. In each of these instances, the size of the actual increase is characterized by the nature of known patterns of the data source and syndrome being evaluated; these considerations require an understanding of the usual frequency distribution for the particular event of concern. Certain signals can be expected and, when detected, are of less concern, especially when the public health response is well established (e.g., the beginning of the influenza season and winter increases in cases of viral gastroenteritis). However, observations of such anomalies at other times of the year, or when frequency is much different than expected or presentations more severe, are more likely to represent important public health events. Other Factors of ImportanceThe majority of syndromic surveillance systems collect multiple streams of data to be evaluated as indicators of changes in the health status of the populations they monitor. Each data stream has unique attributes that must be understood to estimate the value of the results they produce. Chief among these attributes is the lag time between the occurrence of an event and the time it is available to the system for anomaly detection. Another critical attribute is the clinical value of the data. ED data, for example, convey important information about clinical encounters when chief complaint data are coded into syndromes. However, ED data are more clinically valid when the syndromes are coded on the basis of discharge diagnoses, as physician office visit data are coded. In determining the attributes of a system with these data sources, the user should be aware of the timing of the coding efforts and the change in lag time introduced by the coding effort. Data on OTC pharmaceutical sales can be available quickly but have less clinical value than encounter data sources. Whether the data source provides individual level data to allow scrutiny at that level to characterize and validate any changes detected also should be considered. On the basis of these attributes, identifying a single data stream within the system to serve as the principal indicator of changes in community health status might be desirable; remaining data sets can be relied on as secondary sets that are used to corroborate findings in the primary stream or to assist in refining hypotheses when indications of important changes are observed in the primary data set. A process flow chart (Figure 2) can be used to illustrate how evaluation and response might proceed with a system that has designated a primary, individual encounter--based data source. DiscussionSyndromic surveillance is emerging as a practical tool for public health epidemiologists. Procedures for evaluation of data provided to public health practitioners through syndromic surveillance systems will necessarily vary based on the system in place and the jurisdiction in which it operates. However, to facilitate identification and response to important public health events, users believe that standardized evaluation and response strategies should be developed and adopted by all public health practitioners. A step-by-step evaluation strategy (Figure 2) can be used for evaluation of any individual-encounter based surveillance data source (i.e., ED chief complaints, hospital discharge codes, and call-center encounters). The process should begin with an evaluation of data completeness and with efforts to either complete the data set or limit the analytical data set to one which is as complete as possible. Proceeding then from general evaluations of incidence and aberration patterns to more specific ones (e.g., from the all-encounter level to age-group syndrome evaluations), all anomalies should be analyzed to identify usual and expected patterns for consistency of presenting complaints; age, sex, and geographic-distribution; and severity of illness as indicated by discharge dispositions and diagnoses (when data are available). When possible, historic comparisons (e.g., with the same period in previous years or seasons) should be evaluated. Finally, consideration should be made of whether an unusual but modest change in patterns has persisted for longer than can be explained or whether an increase is simply too large to dismiss as a random occurrence. These information-gathering tasks are the same as those conducted in the early stages of conventional outbreak investigations. Although this framework is intended to assist public health practitioners in distinguishing between statistical anomalies and anomalies of public health concern, the work required parallels that of a typical outbreak investigation. Both processes have the same objective: to determine whether the appearance of an outbreak is, in fact, an outbreak (Table). The majority of the tasks in the proposed evaluation framework overlap, which is often the case in outbreak investigation as well. Ideally, the surveillance system will allow for the routine and automated collection of the data required for completion of these tasks (e.g., clarification of clinical complaints, determination of existence of the anomaly, creation of a case definition, scrutiny for other similar cases, and descriptive epidemiology work). This will serve to ease both the burden and costs of the efforts. The majority of anomalies will require no more consideration than can be made systematically by using information routinely available to users through the system. As such, the distinction between evaluation and response becomes less clear, and response can be thought of as something that, in most cases, can be determined easily from the epidemiologist's work station. The evaluation of the data is, in effect, a limited investigative response that either can support the need to proceed to field work or indicate that the anomaly is not important in a public health sense. If the results of this descriptive work fail to rule out the existence of an event of public health concern, syndromic surveillance systems can provide data to support epidemiologic studies (e.g., case-control studies) to evaluate findings further. Depending on the implementation of particular systems, cases and controls can be distinguished from one another with respect to time of the event, distribution of particular chief complaint keywords, or discharge diagnoses within interesting clusters. The move to field work also requires a considered, step-by-step approach. The level of effort required depends on the particular features of the anomaly. The response could be as simple as a telephone consultation with a health-care provider or a review of ED record face sheets. Rarely, a response might require the full effort of an outbreak investigation. Evaluation work should be conducted by staff members who have sufficient experience with the data to be familiar with fluctuations in incidence attributable to common variation and who have training to support their interpretation of the statistics employed for anomaly detection. Furthermore, evaluation work should be assigned to staff members who understand the demographic features of the community, its habits, and current activities or events because these factors can influence the appearance of anomalies in the absence of a real shift in the health status of the community. Often, responsibility for community-level evaluations should be assigned to health officials in local health departments, and responsibility for region- or statewide evaluations should be assigned to officials in those jurisdictions. Evaluation and response strategies need not be materially different at these levels, but communication of findings and required response should be communicated and monitored across all levels. ConclusionEstablishment of a framework for evaluation and response to syndromic surveillance data will facilitate the implementation of these systems and standardization of procedures for validation of system findings. The framework presented in this report was developed on the basis of the experience of a substantial number of users of multiple systems and may be generalized for use in other systems and jurisdictions. Evaluating data at the local, regional, and state levels might ensure that officials with local awareness will evaluate changes detected in the context of current events and demographics and that increases that occur across jurisdictional boundaries are detected and coordinated by appropriate officials. Finally, careful development of an evaluation and response framework should be undertaken to assess whether use of syndromic surveillance systems requires excess work to distinguish between statistical anomalies and important public health events. Acknowledgments The findings in this report are based in part on contributions by the following ESSENCE users in the National Capital Region: Sheryl Happel Lewis, Rekha Holtry, Steve Babin, and other JHU/APL staff. Financial support for portions of this work was provided by the National Association of City and County Health Officials Advanced Practice Center program. Figure 1  Return to top. Figure 2 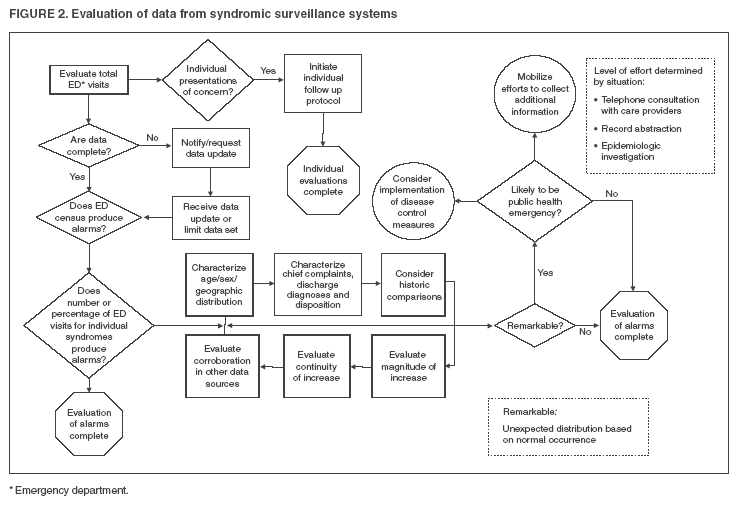 Return to top. Table 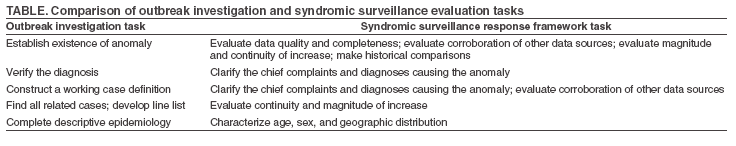 Return to top.
Disclaimer All MMWR HTML versions of articles are electronic conversions from ASCII text into HTML. This conversion may have resulted in character translation or format errors in the HTML version. Users should not rely on this HTML document, but are referred to the electronic PDF version and/or the original MMWR paper copy for the official text, figures, and tables. An original paper copy of this issue can be obtained from the Superintendent of Documents, U.S. Government Printing Office (GPO), Washington, DC 20402-9371; telephone: (202) 512-1800. Contact GPO for current prices. **Questions or messages regarding errors in formatting should be addressed to mmwrq@cdc.gov.Date last reviewed: 8/5/2005 |
|||||||||
|