 |
|
|
|
|
|
|
| ||||||||||
|
|
|
|
|
|
|
||||
| ||||||||||
|
|
|
|
|
Persons using assistive technology might not be able to fully access information in this file. For assistance, please send e-mail to: mmwrq@cdc.gov. Type 508 Accommodation and the title of the report in the subject line of e-mail. An Evaluation Model for Syndromic Surveillance: Assessing the Performance of a Temporal AlgorithmDavid L. Buckeridge,1,2 P. Switzer,3 D. Owens,1,2,4 D. Siegrist,5 J. Pavlin,6 M. Musen2 1Palo Alto Veterans Health Care, Palo Alto, California; 2Stanford Medical Informatics, Stanford University, Stanford, California; 3Department of Statistics, Stanford University, Stanford, California; 4Departments of Medicine and Health Research and Policy, Stanford University, Stanford, California; 5Potomac Institute, Arlington, Virginia; 6Walter Reed Army Institute of Research, Silver Spring, Maryland Corresponding author: David L. Buckeridge, Stanford University, Medical School Office Building, Rm. X-215, 251 Campus Drive, Stanford, CA 94305-5479. Telephone: 650-723-6979; Fax: 650-725-7944; E-mail: david.buckeridge@stanford.edu. Disclosure of relationship: The contributors of this report have disclosed that they have no financial interest, relationship, affiliation, or other association with any organization that might represent a conflict of interest. In addition, this report does not contain any discussion of unlabeled use of commercial products or products for investigational use. AbstractIntroduction: Syndromic surveillance offers the potential to rapidly detect outbreaks resulting from terrorism. Despite considerable experience with implementing syndromic surveillance, limited evidence exists to describe the performance of syndromic surveillance systems in detecting outbreaks. Objectives: To describe a model for simulating cases that might result from exposure to inhalational anthrax and then use the model to evaluate the ability of syndromic surveillance to detect an outbreak of inhalational anthrax after an aerosol release. Methods: Disease progression and health-care use were simulated for persons infected with anthrax. Simulated cases were then superimposed on authentic surveillance data to create test data sets. A temporal outbreak detection algorithm was applied to each test data set, and sensitivity and timeliness of outbreak detection were calculated by using syndromic surveillance. Results: The earliest detection using a temporal algorithm was 2 days after a release. Earlier detection tended to occur when more persons were infected, and performance worsened as the proportion of persons seeking care in the prodromal disease state declined. A shorter median incubation state led to earlier detection, as soon as 1 day after release when the incubation state was <5 days. Conclusion: Syndromic surveillance of a respiratory syndrome using a temporal detection algorithm tended to detect an anthrax attack within 3--4 days after exposure if >10,000 persons were infected. The performance of surveillance (i.e., timeliness and sensitivity) worsened as the number of persons infected decreased. IntroductionSyndromic surveillance offers the potential to rapidly detect a change in the health status of a population. The main motivation for conducting syndromic surveillance has been to detect disease outbreaks resulting from an act of terrorism (1). Despite implementation of syndromic surveillance (2) and promulgation of evaluation guidelines (3), limited evidence exists that describes the performance of syndromic surveillance systems in detecting outbreaks from terrorism (4). Published evaluations of syndromic surveillance have focused on the ability of a system to detect influenza outbreaks compared with traditional means of influenza surveillance (5,6). These evaluations provide useful information, but this proxy disease approach to evaluation has limitations. Most notably, the performance of syndromic surveillance in detecting influenza outbreaks might not be generalizable to detecting other types of outbreaks. Outbreaks resulting from intentional releases will likely have different characteristics than influenza outbreaks, including a different disease agent and means of introducing the agent into the population. These characteristics can change the presentation of an outbreak and the ability of a surveillance system to detect an outbreak. For example, an outbreak attributed to inhalational anthrax might have a faster increase in cases than an influenza outbreak, and the anthrax cases can also occur in tighter spatial clusters. Another option for evaluating a syndromic surveillance system is to superimpose outbreak cases (i.e., an epidemic curve) directly onto an existing data source and then use the combination of the superimposed outbreak data and real baseline data to evaluate a surveillance system. One method for producing the outbreak cases is to specify an epidemic curve, which is the distribution of time until patients seek health care after exposure. Specifying the epidemic curve is appealing because of its simplicity, but the epidemic curve is essentially a black box. Predicting how changes in the many factors that might influence an outbreak would affect the epidemic curve is not possible. Such factors include the progression of disease within infected persons and the propensity for symptomatic persons to seek medical care. The ability to examine the influence of these factors on the evolution and detection of an outbreak is important because uncertainty exists about these factors in medical literature (7), and debate continues about the influence of these factors on surveillance (8). This report describes the implementation and application of a model for simulating cases that might result from an exposure to inhalational anthrax. Design of the model has been described previously (9); in this report, detailed components of the model for simulating disease progression and health-care--service use by persons with symptoms are described. The model is then used to evaluate the ability of syndromic surveillance to detect an outbreak of inhalational anthrax after an aerosol release. MethodsSimulation ModelA model of the processes underlying the biological and medical sequelae of an anthrax attack was developed (9). This model included components for the dispersion of spores after a release, the infection of persons, disease progression within infected persons, and health-care use by symptomatic persons. Evaluation of syndromic surveillance was conducted by using a temporal algorithm; thus, the dispersion and infection components of the model, which are necessary only for evaluating spatial algorithms, were not used. Simulation, therefore, began with disease progression and the number of infected persons. The components of the simulation model used were the disease and the health-care--seeking components. The disease component simulates a path through three disease states (i.e., incubation, prodromal, and fulminant) for each infected person. The health-care--seeking component then simulates the occurrence and timing of health-care visits in each disease state and the syndrome assigned to a person who seeks care. Disease Component Using previous studies modeling anthrax (10), disease progression was modeled through the three disease states: incubation, prodromal, and fulminant. Disease progression was modeled as a semi-Markov process (11), with lognormal holding time functions. The incubation times for inhalational anthrax fit a lognormal distribution (12--14), and the parameter's values for the lognormal holding time functions used in the base case are indicated (Table 1) (10). The log time in a state is normally distributed with mean µ and variance s2, log(t) ~ N(µ, s2). Similar to previous studies (12), the parameter d = es is referred to as the dispersion factor, and the median and dispersion factor are used to describe lognormal distributions. In simulating disease, an infected person begins in the incubation state, progresses to the prodromal state, and then to the fulminant state. A distinct path was simulated through the disease model for each infected person. Health-Care--Seeking Component Because detailed data on the probability of seeking care and the delay to seeking care given an illness are not readily available in medical literature, a single state semi-Markov process was used to model the probability of and time to seeking care. Consumer panel research was used for the probability of seeking care (A. Kress, Surveillance Data Inc., personal communication, 2004), and a right triangular distribution (15) fit to the time spent in the disease state was used to model the time to seeking care. For persons that sought care, the instantaneous probability of seeking care increased linearly over the time in a state. Persons were limited to a single episode of care in each state, and care-seeking was modeled independently for the prodromal and fulminant states. When a person sought health care, the syndrome assigned was simulated using the probabilities (Table 1) that reflect the distribution of clinical presentations for inhalational anthrax (16,17). The time to seeking care was modeled as a continuous variable, and surveillance analysis was performed daily. Simulation StudyThe simulation study examined the ability of syndromic surveillance conducted with a temporal algorithm to detect a simulated anthrax outbreak. A temporal algorithm follows the aggregate incidence of events throughout the surveillance region and does not examine the spatial distribution of events. The impact of the size of the outbreak on detection performance was examined and the sensitivity of findings to assumptions about disease progression and healthcare--seeking behavior was also determined. The study design simulated outbreaks and then combined data from each outbreak with real health-care use data to form multiple test data sets. Each test data set was the union of authentic data with a set of records from a simulated outbreak. A detection algorithm was then applied to each test data set, and outbreak-detection performance was measured. The authentic surveillance data and simulation region, the approach to generating simulated outbreaks, the outbreak detection algorithm, and the technical implementation are described below. Surveillance Data and Region Records of ambulatory-care visits were acquired in Norfolk, Virginia, from the TRICARE health maintenance organization (HMO). This HMO finances health care for active duty military personnel and their dependants. Syndromic surveillance systems, including the ESSENCE (18) and BioSense systems, routinely use these data. Data were available for 2001--03. The simulation region includes 17 clinical facilities that services approximately 158 ZIP codes from two states. During 2001--03, a total of 427,634 persons made approximately 7 million visits for syndromes routinely followed in syndromic surveillance. Records were classified into syndromes by using the International Classification of Diseases, Ninth Revision, Clinical Modification codes to syndrome mapping defined by the ESSENCE system. Generation of Simulated Outbreaks In generating simulated outbreaks, four parameters in the simulation model were varied: number of infected persons, median time in the incubation state, median time in the prodromal state, and the proportion seeking care in the prodromal state. For each parameter, eight settings were used and ten runs were performed at each setting, resulting in 320 simulated outbreaks. Eight dates were then randomly selected for the beginning of an outbreak, and each simulated outbreak was superimposed onto the authentic data beginning on each of the outbreak dates, resulting in 2,560 test sets (Table 2). Outbreak Detection Method An autoregressive seasonal integrated moving average (SARIMA) model (19) was used to calculate one-step-ahead daily forecasts of respiratory syndrome counts, and a cumulative sum (20) was applied to detect positive deviations in the forecast residuals. Researchers have employed this approach to outbreak detection in a surveillance setting (21). The respiratory syndrome was used because this is the syndrome an anthrax attack will likely affect and the temporal surveillance algorithm only considers a single syndromic category). To fit the SARIMA model, the first 2 years of data for respiratory syndromes were used, and a procedure published previously was followed (22). This entailed subtracting the overall mean, day-of-week means, month means, and holiday means from the original count data to give a series centered on zero. Trimmed means (alpha = 0.1) were used for both day-of-week and month to minimize the influence of outliers. The temporal autocorrelation in this series was assessed, and a SARIMA model was fit to the series by using a standard approach to model specification (19). The fit of the SARIMA model was evaluated to the training and test data by using the mean absolute percentage error (MAPE), which is the average of the absolute difference between the daily forecast and the visit count, divided by the visit count. The standardized residual was calculated for each day as the observed count minus the one-step-ahead forecast from the SARIMA model, divided by the standard error of the forecast. To fit the cumulative sum, the parameters of the test were adjusted to achieve an alarm rate on the training data that was approximately one per month, which is intended to reflect a reasonable workload for a public health agency. To evaluate outbreak detection, sensitivity and timeliness were calculated at a set alarm rate. Sensitivity was defined as the proportion of simulated outbreaks detected before or at the peak of the epidemic curve; timeliness was defined as the number of days until an alarm, given that an outbreak was detected. ResultsDuring 2001--03, the syndrome mapping classified 351,749 (6.6%) of the 5,319,347 visits as respiratory syndromes. The average was 321 respiratory visits per day (range: six to 963 visits), with lower counts on weekends (mean: 168 visits) than on weekdays (mean: 382 visits). Examination of the time series of respiratory counts revealed systematic variation by day-of-week, month, and holidays (Figure 1). After subtracting the overall mean and means for day-of-week, month and holiday, the zero-centered series exhibited temporal autocorrelation at short lags on the order of days and cyclical lags of order seven. A SARIMA model (2,0,1) x (2,0,1)7 had the best fit to the zero-centered series. One-step-ahead forecasts from this model resulted in a MAPE of 15.8% on the training data (2001--02), indicating that the forecast values were, on average, within 15.8% of the true value. This fit is similar to or better than the fit reported in previous research using the same algorithm and similar data (23). The cumulative sum was calibrated to a specificity of 97%, by setting the shift parameter to 1 and the threshold to 1.5. This is an alarm rate of approximately 1 in 4 weeks (3.5%), which other researchers have used to evaluate outbreak detection through syndromic surveillance (24). Detection by Number InfectedSurveillance with a temporal algorithm detected an outbreak 2 days after release at the earliest, with a trend towards earlier detection as the number of persons infected increased (Figure 2). When >40,000 persons were infected, the median time to detection was 3 days, and the maximum time to detection was 5 days. At lower release amounts, the median time to detection increased, reaching a maximum of 6 days when 5,000 were infected. Sensitivity was 100% when >30,000 persons were infected, decreased to 90% (95% confidence interval [CI] = 82%--95%) when 20,000 were infected, to 75% (CI = 65%--84%) when 10,000 were infected, and to 56% (CI = 45%--67%) when 5,000 were infected. Sensitivity to Disease and Behavior AssumptionsIn the base case, 40% of persons sought care in the prodromal disease state. Increasing the proportion of persons who sought care in the prodromal state resulted in temporal surveillance detecting the outbreak faster, but the change was minor. In contrast, the performance of temporal surveillance declined as the proportion seeking care decreased. With 10% of persons seeking care, syndromic surveillance detected the outbreak on median in 5 days. Varying the proportion seeking care had a similar effect on detection to varying the number infected (Figure 2). In the base case, the median duration of the incubation state was 11 days. Some researchers have suggested that the performance of temporal surveillance is likely to decline as the incubation period becomes shorter (8); however, the findings in this report suggest the opposite. As the median duration of the incubation state decreased, temporal surveillance tended to detect the outbreak faster, with detection after 2 days for a median incubation of <5 days. Increasing the median duration of the incubation period to >11 days tended to increase the time to detection, but not markedly. In the base case, the median duration of the prodromal disease state was 2.5 days. A shorter median duration did not change considerably the time to detection for syndromic surveillance. As the median duration of the prodromal state increased above 2.5 days, temporal surveillance tended to take longer to detect the outbreak, but this trend was not pronounced. Implications for Performance of Syndromic SurveillanceTo determine the implications of findings for syndromic surveillance, the timing of detection was considered with a release of anthrax that infected 20,000 persons. Within the simulation area, the population that was covered by the TRICARE HMO was approximately 400,000, thus 20,000 infected persons represented 5% of the covered population. If 40% of those infected sought care in the prodromal state, that would amount to 8,000 visits, representing 2% of the covered population. These visits would be spread over the duration of the outbreak, and of greater interest than the total number is the number seeking care each day over the first few days of the outbreak. For an outbreak that infects 20,000 persons, the distribution of the additional visits is illustrated (Figure 3). The median time to detection with 20,000 infected persons was 4 days after release (Figure 2), which corresponds to an additional 56 visits, on average, on the day of detection. The daily average number of visits in this test data was 321, thus the additional 56 visits represented an increase of 17% over baseline for an average day. If the fourth day of an outbreak occurred on a weekend day, when the average visit count was 168, then the increase in visits would be 33% over baseline. Variation in the background occurs by season, and the maximum number of daily visits in the 1 year of test data (2003) was 963. An additional 56 visits is an increase in visits of 6% over baseline on a day with a baseline count of 963. DiscussionThis report describes a simulation model of the processes underlying the biological and medical sequelae of an anthrax attack; the model was used to evaluate the ability of syndromic surveillance to detect an outbreak of inhalational anthrax. In the base case (i.e., 50,000 infected, 11 days incubation period, 2.5 days prodrome, and 40% seeking care in prodromal stage), the earliest detection using a temporal algorithm was 3 days after a release. Earlier detection tended to occur when more persons were infected, and surveillance tended to detect an aerosol anthrax attack in a median of 3 to 4 days when >10,000 persons were infected. Median time to detection increased to 6 days when 5,000 persons were infected. The sensitivity analysis demonstrated that the proportion of persons seeking care in the prodromal disease state affected the performance of syndromic surveillance. As the proportion seeking care declined, temporal surveillance took longer to detect an outbreak. This was similar to the effect observed when the number of persons infected in an attack was decreased. The median duration of the prodromal disease state had little influence over the performance of surveillance, but the median duration of the incubation state affected the performance of surveillance. Syndromic surveillance detected an outbreak sooner as the median duration of the incubation state decreased, with detection occurring 2 days after release when the median duration of the incubation state was <5 days. In examining the implications of these findings for syndromic surveillance, for a release that infected 20,000 persons, detection through surveillance occurred 4 days after release when 56 persons in the outbreak used health-care services. Health-care providers could have possibly identified these 56 additional cases with nonspecific symptoms as an extraordinary increase in the absence of syndromic surveillance. Seventeen clinical sites were in the simulation area, with a number of physicians at each site. If the cases distributed themselves across multiple sites and physicians, then an additional 56 cases in 1 day might not appear unusual. If persons reported to a small number of locations and physicians, then the same number of additional cases might raise concern. The location of seeking care was not modeled for this study, but will be considered for future research. Another factor to consider is whether some infected persons are likely to progress rapidly to a fulminant state and be diagnosed with inhalational anthrax before the fourth day after the release. This is another factor that was not considered in this study, but will be in future research. The evaluation method described in this report has advantages over other approaches. This method models disease and behavior processes at a level of detail sufficient for examining the influence of assumptions about these processes on outbreak detection performance, thus allowing thorough examination of how characteristics of disease and health-care--seeking behavior influence the performance of syndromic surveillance. Even with the few assumptions examined, the findings offer insight into the role of syndromic surveillance in a diseasecontrol strategy. Another advantage of this approach is that authentic surveillance data were used as the basis for the evaluation, and simulated outbreaks were superimposed onto these authentic data. Hence, detection algorithms must be robust to vagaries in real data, and these results are to some extent influenced by the characteristics of the underlying population and the authentic data. In this report, syndromic surveillance conducted with a univariate temporal algorithm and operating on a single syndrome was examined. Following multiple syndromes with spatial algorithms might improve performance. The sensitivity of these results in relation to four parameters varied one at a time. A multi-way sensitivity analysis of a greater proportion of the parameters might prove more informative; this study is now under way. The evaluation described here looked at outbreak detection assuming that data are available in real time. In practice, this is rarely the case and the methods used to correct for reporting delay might influence detection. If the distribution of reporting was known, the simulation model could be modified to evaluate methods that account for reporting delay. To assess the true impact of syndromic surveillance on time until intervention, it will be necessary to extend the model to encompass outbreak detection through other routes such as clinical case-finding and to assess the timing of intervention decisions with information from syndromic surveillance. ConclusionEvaluation of outbreak detection through syndromic surveillance is difficult for many reasons, including the limited amount of data for outbreaks of interest. Multiple evaluation approaches exist, and the simulation method described in this report provides useful insight. Syndromic surveillance of a respiratory syndrome using a temporal detection algorithm tends to detect an anthrax attack within 3 to 4 days after exposure if >10,000 persons are infected. The performance of surveillance (i.e., timeliness and sensitivity) worsens as the number of persons infected decreases, and as the proportion seeking care in the prodromal stage declined. References
Table 1 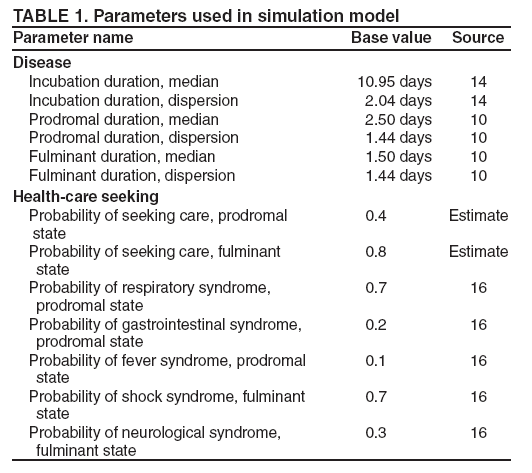 Return to top. Figure 1 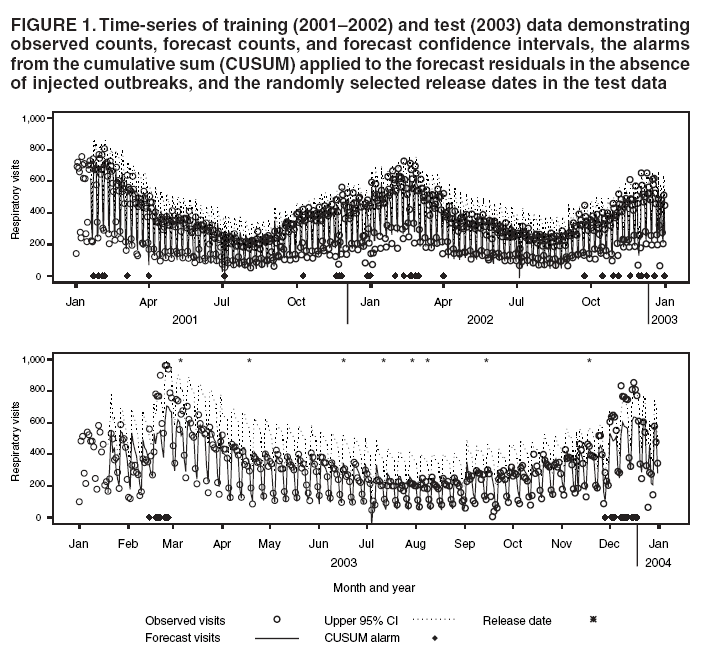 Return to top. Table 2 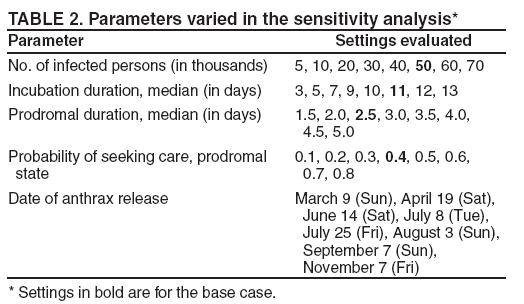 Return to top. Figure 2 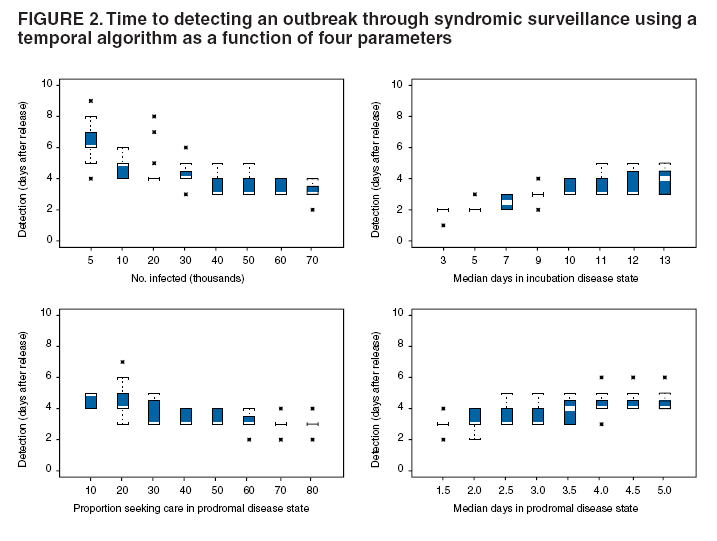 Return to top. Figure 3 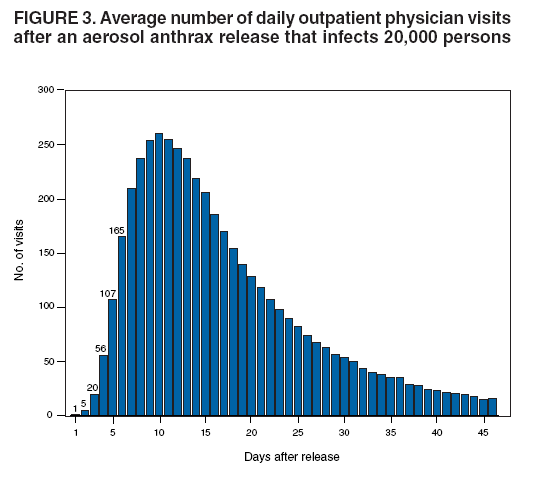 Return to top.
Disclaimer All MMWR HTML versions of articles are electronic conversions from ASCII text into HTML. This conversion may have resulted in character translation or format errors in the HTML version. Users should not rely on this HTML document, but are referred to the electronic PDF version and/or the original MMWR paper copy for the official text, figures, and tables. An original paper copy of this issue can be obtained from the Superintendent of Documents, U.S. Government Printing Office (GPO), Washington, DC 20402-9371; telephone: (202) 512-1800. Contact GPO for current prices. **Questions or messages regarding errors in formatting should be addressed to mmwrq@cdc.gov.Date last reviewed: 8/5/2005 |
|||||||||
|