 |
|
|
|
|
|
|
| ||||||||||
|
|
|
|
|
|
|
||||
| ||||||||||
|
|
|
|
|
Persons using assistive technology might not be able to fully access information in this file. For assistance, please send e-mail to: mmwrq@cdc.gov. Type 508 Accommodation and the title of the report in the subject line of e-mail. INFERNO: A System for Early Outbreak Detection and Signature ForecastingElena N. Naumova,1 E. O'Neil,1
I. MacNeill2 Corresponding author: Elena N. Naumova, Department of Public Health and Family Medicine, Tufts University School of Medicine, 136 Harrison Avenue, Boston, MA 02111. Telephone: 617-636-2462; Fax: 617-636-4017; E-mail: elena.naumova@tufts.edu. Disclosure of relationship: The contributors of this report have disclosed that they have no financial interest, relationship, affiliation, or other association with any organization that might represent a conflict of interest. In addition, this report does not contain any discussion of unlabeled use of commercial products or products for investigational use. AbstractObjective: Public health surveillance systems that monitor daily disease incidence provide valuable information about threats to public health and enable public health authorities to detect enteric outbreaks rapidly. This report describes the INtegrated Forecasts and EaRly eNteric Outbreak (INFERNO) detection system of algorithms for outbreak detection and forecasting. Methods: INFERNO incorporates existing knowledge of infectious disease epidemiology into adaptive forecasts and uses the concept of an outbreak signature as a composite of disease epidemic curves. Results: Four main components comprise the system: 1) training, 2) warning and flagging, 3) signature forecasting, and 4) evaluation. The unifying goal of the system is to gain insight into the nature of temporal variations in the incidence of infection. Daily collected records are smoothed initially by using a loess-type smoother. Upon receipt of new data, the smoothing is updated; estimates are made of the first two derivatives of the smoothed curve, which are used for near-term forecasting. Recent data and near-term forecasts are used to compute a fivelevel, color-coded warning index to quantify the level of concern. Warning algorithms are designed to balance false detection of an epidemic (Type I errors) with failure to correctly detect an epidemic (Type II errors). If the warning index signals a sufficiently high probability of an epidemic, the fitting of a gamma-based signature curve to the actual data produces a forecast of the possible size of the outbreak. Conclusion: Although the system is under development, its potential has been demonstrated through successful use of emergency department records associated with a substantial waterborne outbreak of cryptosporidiosis that occurred in Milwaukee, Wisconsin, in 1993. Prospects for further development, including adjustment for seasonality and reporting delays, are also outlined. IntroductionDaily disease monitoring through public health surveillance systems provides valuable information about threats to public health. Substantial outbreaks can be caused by emerging new pathogens (e.g., Severe Acute Respiratory Syndrome and West Nile virus) and evolving well-known ones (e.g., cryptosporidiosis). Modern surveillance systems require efficient statistical tools for early detection of rapid changes in disease incidence and forecasting the extent of an outbreak, and more rigorous methodology is needed (1,2). Such tools should accommodate vital features of surveillance data that relate to the nature of diseases, their etiology and epidemiology, and characteristic properties of the data. For example, seasonal patterns of diseases should be considered in outbreak detection algorithms, potential reporting delays should be taken into account in estimating the size of the infected population, and appropriate adjustments should be made in outbreak-detection and forecasting algorithms. This report describes an innovative approach for outbreak detection and forecasting outbreaks, the INtegrated Forecasts and EaRly eNteric Outbreak (INFERNO) detection system. INFERNO is a system of adaptive algorithms for early outbreak detection and forecasting the extent of detected infectious disease outbreaks (3). The system uses the concept of an outbreak signature (i.e., a composite of elementary distributions of incubation times associated with exposure and population characteristics) and an adaptive forecasting approach. This report discusses the INFERNO system by using as examples retrospective evaluation of a daily time series of physician-diagnosed cases of nonspecific gastroenteritis that occurred in Milwaukee, Wisconsin, in 1993, in association with a well-documented waterborne outbreak of cryptosporidiosis (4). MethodsInfectious disease is initiated by the introduction of a pathogen into a susceptible population. For the majority of exposed persons, a certain incubation period exists between the time a pathogen is acquired and the time of its clearance. In certain cases, exposure results in clinical manifestation. The period between exposure and onset of clinical signs and symptoms is referred to as the incubation period. Duration of incubation time depends on host immune reactivity. Typically, a case of infection is recorded as disease symptoms are developed and confirmed tests are performed. From a modeling point of view, reported cases of infections are the realization of a random process that can include both observable and unobservable parts. The observable part of a process depends on the size of the population in which exposure results in a symptomatic event and on detection and recording of such events. For a substantial class of waterborne and foodborne enteric infections, symptoms typically are mild and selflimiting; the observable part might be substantially smaller than the part that is unobservable and will vary over time. For example, epidemiologic studies of cryptosporidiosis incidence demonstrate that although approximately 70% of a population might exhibit markers of recent infection, typically only 2%--5% have reported symptoms (5). Waterborne and foodborne enteric infections often manifest by alternating periods of low and high incidence. Daily cases of infection might represent two distinct modes: 1) an endemic mode, in which incidence is low and observed disease incidence normal; and 2) an epidemic mode, in which increased incidence of waterborne or foodborne enteric infections is caused primarily by an increase of either a fraction of the susceptible subpopulation or the dose of the exposure. Infectious disease events occur in the form of a series of dependent observations. A sequence of daily cases of infection reflects a temporal composition of recorded events. Any outbreak comprises time of onset, magnitude, and duration. A time series of daily cases can be illustrated schematically as a simple single point-source exposure outbreak (Figure 1). In a single point-source exposure outbreak, all subjects are assumed to have been exposed to the same dose at the same time. An outbreak starts at time tA, when the mean of an infectious process begins to change. An outbreak reaches its maximum at time tB, l-days after a spike in exposure, where l is the mean latent period. The mean of an infectious process declines to a preoutbreak level at time tC , k-days after a spike in exposure, where k is a maximum incubation period. A dark blue line is used to reflect the temporal pattern of mean disease incidence with respect to 1) time of onset, tA, 2) duration, tC -- tA, and 3) peak time of disease incidence (Figure 1). The actual data from which this temporal pattern is observed are the realization of an infectious disease process, often referred to as an epidemic curve. The temporal pattern of mean disease incidence closely approximates the distribution of incubation times in the symptomatic population only if 1) every person with a recorded case is exposed at the same time and to the same dose, 2) the reported time is the latent time, and 3) the latent period is proportional to the incubation period. For outbreaks caused by sources of infection other then person-to-person transmission (i.e., intentional or environmental outbreaks), this statement might be valid, but to expect these three conditions to be satisfied in real-life settings seems impractical (4,6). Nevertheless, if a temporal pattern of mean disease incidence is assumed to be a composite of elementary distributions of incubation times associated with exposure and population characteristics, the knowledge of pathogen-specific incubation times can be used to detect an outbreak and forecast its magnitude and duration. Such composites form a unique signature. For monitoring systems, a signature has two potential uses. First, when a signature is applied to streamline data in real time, it produces a long-term forecast. Second, a signature allows retrospective identification and quantification of similar temporal patterns from historic data. ResultsINFERNO is a system of adaptive algorithms for outbreak detection and forecasting that is based on the concept of outbreak signature forecasting. This section discusses the four components of the system (training, warning and flagging, signature forecasting, and evaluation) by using a retrospective daily time series of cases of nonspecific gastroenteritis associated with a 1993 waterborne outbreak of cryptosporidiosis that occurred in Milwaukee, Wisconsin. TrainingThe purpose of this component is to gain insight into the nature of endemic temporal variations in the incidence of infection. As in any other outbreak detection system or algorithm, this component includes examination of retrospectively collected data and provides estimates for baseline parameters (7). In this system, daily cases of infection represent two modes of the process: endemic and epidemic. Although this distinction is somewhat artificial, it is useful for modeling purposes. In this analysis, training is limited to a 7-week period during which the infection is assumed to be in endemic mode, which is supported by visual inspection and posthoc analysis using INFERNO. This set of data is used to determine the average rate of gastroenteritis events and the extent of their variability. Using the standard deviation of the training set as a multiplier, four levels of departure from the mean are estimated (Figure 2). The training component currently contains the algorithms to assess potential temporal fluctuations associated with seasonal fluctuations. The training for the epidemic mode is also important for refining the signatures to detect different patterns and to develop a library of observed epidemic curves. A loess smooth is superimposed on all available daily counts of nonspecific gastroenteritis (Figure 2). The issue of selecting a proper smoothing technique deserves special attention. The span of the smoother must be long enough that random fluctuations in the background infection rates are not chased, yet short enough to react to the onset of an outbreak. To achieve such balance for a year of data, the selected span ratio of the nonparametric smoother is equal to 25/365. This span ratio implies a window size of 25 days, an arbitrary but reasonable choice to cover the duration of an incubation period for cryptosporidiosis, which might be up to 21 days. The data indicate an outbreak associated with cryptosporidiosis infection during the period starting at 75 days and ending at 130 days. As an indication of the effectiveness of the smoothing in capturing the essentials of the daily counts, cumulative data sums are compared with the smoothed function (3). Warning and FlaggingThe purpose of this component is to quantify the level of concern in the streamlined (i.e., frequently updated) data to switch from endemic to epidemic mode in forecasting procedure. Daily collected reports are smoothed by using a loess-type smoother. Smoothing is updated daily, and estimates are made of the first two derivatives of the smooth curve indicating the gradient of change in mean incidence. These loess- and derivative-based estimates are used to build a nearterm forecast (Figure 3). Three marks indicate the prediction for the next day during 3 consecutive days, if the records are only available up to day 80, 81, 82. Next, a long-term forecast is built by extending the nearterm forecast to almost 1 month in advance as if the records are available only up to a day 80, 81, 82 (Figure 3). To produce the forecasts, a trajectory is created of the mean between two points: the time of the last observation (point A) and 1 month in advance (point B) (3). The trajectory is estimated by using the first two derivatives of the smoothed function at point A and the values of a truncated version of the Taylor's series expansion of the function for the point B. The forecasts are quite different from the actual observations, indicating that a switch should be made from the endemic to the epidemic mode that is essential for modeling. The recent data and the near-term forecasts are used to quantify a switch point. The warning algorithm uses four severity indexes: 1) actual counts at the given day, 2 the mean estimate 1 week before the given day, 3) the estimate of the mean at the given day, and 4) the maximum of the forecast for the next 7. The sum of four severity indexes for a given day forms a basis for flagging. A given day is flagged by using five color-coded categories, and depending on the flag value, either the attenuated forecasts or the signature forecasts are performed. A time series of cases is transformed to a time series of flag values, which in any given day contains past, present, and predicted future information (Figure 4). During the outbreak, the daily flag values clearly exceed the red code, indicating the period in which signature forecasting is used. Signature ForecastingIf the flag value signals a sufficiently high probability of an epidemic mode, then a forecast of the possible size of the outbreak is made. Currently, a model for the mean value function implemented in the system is: Equation 1.
where ƒ(t) is a function representing the mean of the endemic counts of cases at time t, S(.) is a function characterizing the shape of an outbreak and is referred to as the base signature function for disease outbreaks, Si(.) is S(.) amplified to accord with the extent of the ith outbreak, t1i is the date of the onset of the ith outbreak, t2i is the date of termination or resolution of the ith outbreak, and d(t1i,t2i) is a function that assumes the value 1 during the period of the ith outbreak and otherwise is zero (3). Examples of the background, or endemic, function, ƒ(t), are: Equation 2. ƒ(t) = µ,t > 0 for the case of constant background infection rates, and Equation 3.
for the case of seasonal fluctuations in the background infection rates. As a possible model for the random process generating the time series of daily counts for a particular infection, a time-dependent Poisson process with intensity function m(t) defined by Equation 1 is chosen. To build a signature forecast, a family of gamma distributions is chosen. This nonnegative, rightskewed distribution is used to approximate a distribution of incubation times and can be easily generated by using statistical software. Depending on the level of concern, an appropriate curve is selected from a library of distributions and serves as a signature base (Figure 5). A signature curve also can be simulated as a set of incubation time distributions according to an intensity function given by Equation 1, which on the average gives the signature shape. For streamlined data, the fitting is updated daily. The fitted signature curve is the long-term forecast. EvaluationThe purpose of this component is to quantify uncertainty associated with the predicted size of the outbreak. The algorithms for computing the warning index have to be designed to balance false prediction of an epidemic (Type I errors) with failure to correctly predict an epidemic (Type II errors). Initiation of the signature forecast and selection of the signature base are determined by the daily flag value. In the example, five separate week-long sets of data selected from the raw time series that appear to have a similar pattern to the week that launched the outbreak of cryptosporidiosis during day 75--130 are highlighted (Figure 6). If the same signature forecasting procedure were applied to each of the four other sequences, a Type I error would be committed in each case. To avoid potential error, the warning index has to be corrected. A data-driven inflator was developed to balance Type I and Type II errors. The price for the use of this data-driven inflator is a significant delay in making a definitive forecast of the extent of an outbreak when flag values are yellow or blue. However, this delay would be considerably less when flag values are orange or red. ConclusionLibrary of Signature CurvesThe effectiveness of the forecast depends upon the extent to which the signature curve captures the shape of outbreaks of the infection under consideration. In the system under discussion, epidemiologic observations for incubation periods of cryptosporidiosis are considered. The lag between the time of exposure and the time of emergency department visit for gastroenteritis symptoms is assumed to be approximately 8 days (8). However, this period might vary among sensitive subpopulations; for example, it might decrease among children or the elderly (9). Different strains of a pathogen might have different incubation times. Acquired immunity to a pathogen might shorten the incubation period and reduce the number of symptomatic cases. Theoretically, mean incubation time might be inversely proportional to the inoculum dose at low doses. A library of signature base curves for infections with various epidemic properties should be developed. A period between exposure and an outcome of interest (e.g., disease onset, emergency department visit, or hospitalization time) can be thought of as a random variable. Although a lognormal distribution, a classic model for incubation time of infectious disease, has been shown to be robust to many biological factors; multiple distributional forms (e.g., Gamma, Weibull, inverse Gaussian, exponential, and Poisson) for a continuous or discrete random variable of time to event have been applied for investigating waterborne cryptosporidiosis (10--13). Provisional Data and Reporting DelayIn the proposed system, retrospectively collected data are used, but the reporting mechanism is assumed to make data available the day after an event occurs. Certain delays in reporting are inevitable. Time-consuming testing or report submission procedures might cause systematic delays in the streamline surveillance data. The INFERNO framework allows users to correct for a systematic reporting delay. For example, the warning index that uses an actual record on a given day and three estimates (weekly mean for a week before a given day, a predicted mean for a given day, and a maximum of forecasts for next few days) could be adjusted for a lagged systematic delay. A small simulation study was conducted to initiate an analysis of systematically delayed reporting. On any given day, i, a report was assumed to contain a number of time-distributed cases, Yi = {y0i, y1i, …, yKi}, so the number consists of y0-cases occurring on a given iday, y1-cases occurring 1 day before the i-day, y2-cases occurred 2 days before, etc. Thus, Zi = Σ αi-k Yik. For demonstration purposes, an exponential weighting αi-k = 0.5(k+1), where k = 0 -- K, and K = 8 be the maximum length of delay in days, was used. A 31-day long-time series was simulated, with 10 cases each day for an endemic background level (the first 10 and the last 14 days) and 7 days of outbreak by using Poisson-distributed multipliers of 1.25, 1.45, 1.68, 1.55, 1.38, 1.2, and 1.1. The results of the simulation were presented by using the three-dimensional temporal exposure-response surface (TERS) (5,9), in which the x-axis reflects the delay in reporting in days, the y-axis imitates the simulated time series obtained as provisional data, and the z-axis reflects restored daily counts with an 8-day lag-distributed scheme (Figure 7). The TERS plot depicts the speed in reporting recovery. On day 1, the simulated provisional daily counts would consist of 10/2 = 5 cases for endemic level. On day 2, counts would consist of five cases for a second day and 10/4 = 2.5 for the previous day, the number of cases for day 1 would be equal to 7.5. By day 8, completed reporting is 99% for an endemic level and 96% for an outbreak. This simple simulation study suggests an approach for a detailed analysis of provisional data that might be helpful in assessing delays, developing adjusting schemes, and quantifying potential duration for a training period in the surveillance systems. Better understanding of reporting barriers and better adjusting for delays in outbreak detection and forecasting are needed. Seasonality AdjustmentAlthough the algorithms for warning and forecasting of an outbreak size in this system do not rely on extensive historical recording, a long training period is needed for a proper seasonality adjustment. The Milwaukee outbreak occurred in the spring, an unusual time for cryptosporidiosis, which typically exhibits a seasonal increase during late summer-early fall (14). The detection of an outbreak close to or during a disease seasonal peak is a difficult task. The forecasting might be sensitive to a degree of seasonal adjustment. Currently, the system offers certain algorithms to assess potential temporal fluctuations associated with seasonal increases using parametric and nonparametric approaches. Additional studies are needed to investigate the effect of seasonality adjustment on forecasting. Integration of additional information obtained from other components of the surveillance (e.g., drug sales, water quality parameters, meteorological information) into the forecasting algorithms might provide better results. Forecasting might also be improved by considering additional factors that might influence incidence and reporting of waterborne infections (e.g., environmental factors [15], boil-water orders, media effects, television and radio announcements, day-of-the-week effects, school vacations, and holidays). Terminology RefinementThe concept of what constitutes an outbreak should be refined. In public health literature, the term is used inconsistently and often imprecisely. For example, in certain situations, an outbreak can mean an increase in incidence over the endemic level (i.e., the term is used to refer to the onset of some observed change). In another meaning, the term can signify a degree of magnitude over a period of time that generates a public health concern. In a third context, risk communication, the term can serve as a synonym for epidemic, often with the intention of reducing the public's level of fear. The more is learned about the process of infectious diseases, exposure, and manifestation, the clearer the concept of outbreak will become, allowing it to be used with more rigor. Both the efficiency and the accuracy of outbreak forecasting using the mathematical modeling will depend on clarity and rigor in the use of key terms. With more attention paid to the precision of the common language shared by mathematicians and epidemiologists, forecasting will enable public health authorities not merely to record experiences but also to influence the future (16). AcknowledgmentSupport for this research was provided by a grant from the National Institutes of Health (R01 434315). References
Figure 1 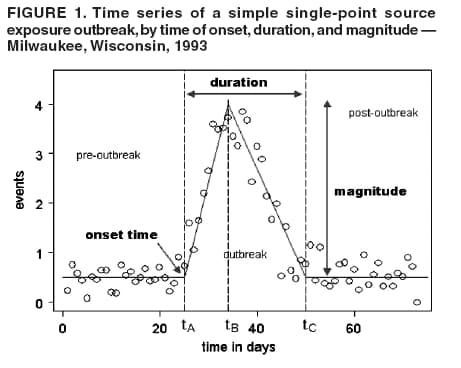 Return to top. Figure 2  Return to top. Figure 3  Return to top. Figure 4 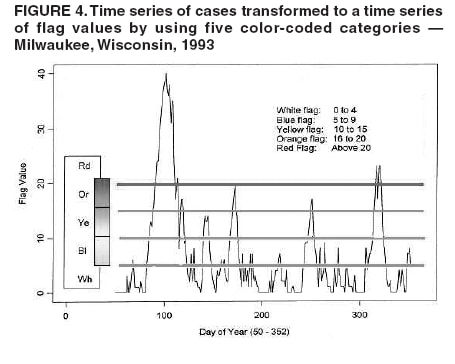 Return to top. Figure 5 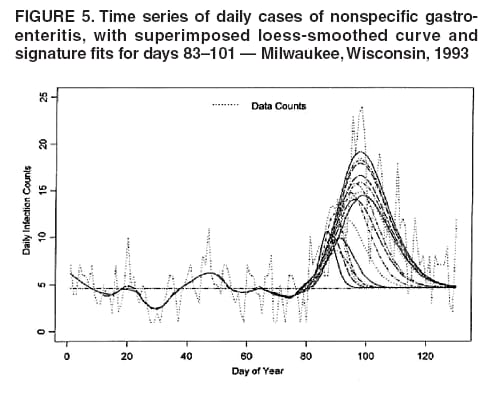 Return to top. Figure 6  Return to top. Figure 7 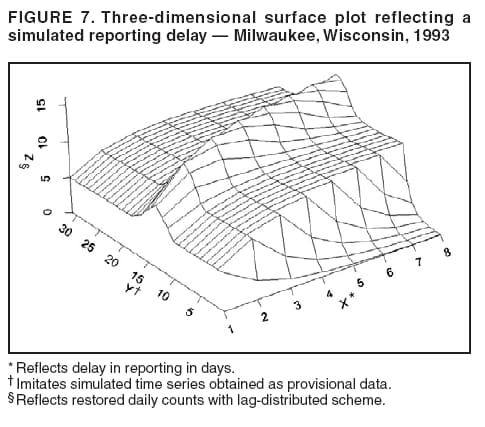 Return to top.
Disclaimer All MMWR HTML versions of articles are electronic conversions from ASCII text into HTML. This conversion may have resulted in character translation or format errors in the HTML version. Users should not rely on this HTML document, but are referred to the electronic PDF version and/or the original MMWR paper copy for the official text, figures, and tables. An original paper copy of this issue can be obtained from the Superintendent of Documents, U.S. Government Printing Office (GPO), Washington, DC 20402-9371; telephone: (202) 512-1800. Contact GPO for current prices. **Questions or messages regarding errors in formatting should be addressed to mmwrq@cdc.gov.Date last reviewed: 8/5/2005 |
|||||||||
|