|
|
|
|
|
|
|
| ||||||||||
|
|
|
|
|
|
|
||||
| ||||||||||
|
|
|
|
|
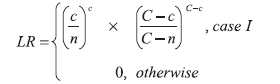
Persons using assistive technology might not be able to fully access information in this file. For assistance, please send e-mail to: mmwrq@cdc.gov. Type 508 Accommodation and the title of the report in the subject line of e-mail. Space-Time Clusters with Flexible ShapesVijay S. Iyengar Corresponding author: Vijay S. Iyengar, IBM Research Division, Thomas J. Watson Research Center, P.O. Box 218, Yorktown Heights, NY 10598. Telephone: 914-945-3407; Fax: 914-945-2141; Email: vsi@us.ibm.com. Disclosure of relationship: The contributors of this report have disclosed that they have no financial interest, relationship, affiliation, or other association with any organization that might represent a conflict of interest. In addition, this report does not contain any discussion of unlabeled use of commercial products or products for investigational use. AbstractIntroduction: Detection of space-time clusters plays an important role in epidemiology and public health. Different approaches for detecting space-time clusters have been proposed and implemented. Many of these approaches are based on the spatial scan statistic formulation. One key aspect of these cluster detection methods is the choice of cluster shape. Objectives: In this report, the effect of using flexible shapes for clusters is explored by discussing the issues that need to be considered and evaluated. Methods: The first issue is the flexibility of the shape and its ability to model the disease cluster being studied. Another subtle and related factor is that with a more flexible shape, clusters can appear more often by chance, which will be reflected in the p value obtained through Monte Carlo hypothesis testing. Choosing more complex cluster shapes can affect the computational requirements and also constrain the cluster detection approaches that could be applied. Results: The New Mexico brain cancer data set is used to illustrate the tradeoffs. The analysis of these data should not be construed as a comprehensive investigation from the public health perspective. The data set is used to illustrate and compare clusters with two different shapes, cylinder and square pyramid. The results indicate the insights that can be gained from these shapes, individually and collectively. Conclusion: The domain expert should choose the cluster shape, being aware of the disease being modeled and the analysis goals. For example, a flexible shape like the square pyramid can model either growth or shrinkage and movement of the disease and might provide insights on its origin. In addition, performing the analyses with more than one shape can lead to increased insights regarding the disease cluster. IntroductionThe spatial scan statistic (1--3) has been applied to both retrospective and prospective applications (4) in epidemiology and public health. A family of analysis methods has been developed for different models of the underlying disease cluster (e.g., Bernoulli model and Poisson model). Examples of the Poisson model are used to illustrate the concepts presented. For the Poisson model, events are allowed to be generated by an inhomogeneous Poisson process (e.g., the number of disease events in a region over a time interval can be expected to be proportional to the corresponding population, assuming that no other factors are relevant). These models have been implemented in SaTScan™, a software used to detect space-time clusters (5). SaTScan detects space-time clusters by using cylindrical windows (Figure 1) with a circular geographic base and the height of the cylinder corresponding to a certain interval in time. Geographic locations are specified discretely (e.g., centers of counties) to SaTScan. Input data to SaTScan include the number of cases and population information at these discrete locations at different times. SaTScan evaluates a set of cylindrical windows by considering all those spatially centered at any point in a user-specified grid and exhaustively varying the cylinder's radius and time duration. The evaluation computes the likelihood ratio of the alternative hypothesis (an elevated event rate within the cylindrical window) and the null hypothesis (the rate is the same inside and outside the window). For the Poisson model, this likelihood function (1) is proportional to
where C is the total number of cases over the entire space and time, c is the number of cases within the window, and n is the expected number of cases within the window under the null hypothesis. Case I refers to the condition when the window has more cases than expected under the null hypothesis, and LR is zero when this condition is not true. The cylindrical window with the highest value of the likelihood function is the resulting cluster R. The multiple hypotheses testing problem is overcome in SaTScan by using Monte Carlo methods by generating synthetic datasets for the entire space-time region in which the event counts are independently generated, conforming to the Poisson model for each location and time. Each of these synthetic datasets is analyzed to determine its most dominant cluster and its likelihood function value. The likelihood that the cluster R could have occurred by chance under the null hypothesis (p value) can be determined by using these Monte Carlo experiments. The use of cylindrical space-time windows for the clusters examined can limit the fit to the disease being analyzed. For example, the cylindrical shape cannot model growth or shrinkage of a disease cluster over time nor can it model movement over time. The square pyramid shape was proposed as an approach to overcome these limitations (6). This cluster shape is illustrated (Figures 2 and 3) in three dimensional and two dimensional views. The three dimensional view (Figure 2) is a cluster growing with time. The axis of the pyramid does not need to be orthogonal to the two spatial axes, allowing the cluster to model movement of the disease. This attribute is clear from the two dimensional view (Figure 3), where the squares represent the geographic extent at discrete times in the cluster time interval. The use of this flexible shape results in substantially increased computational requirements. The computational issue can be addressed by using a randomized search heuristic for the strongest cluster instead of the grid-based pseudoexhaustive approach used in SaTScan (6). This report explores the issues related to the choice of the shape used for space-time clusters. MethodsChoice of Cluster ShapeThe first criterion to consider when choosing the cluster shape is the fit to the disease cluster being modeled. All of the available information about the disease cluster can be used to determine which characteristics are important to model. For example, if modeling the growth of the disease cluster over time is important, using a shape that can represent this behavior is preferable. Choosing a shape arbitrarily that allows more flexibility than is needed also has shortcomings. As discussed previously, the goal is to detect strong clusters that are also significant when compared with those that can occur by chance under the null hypothesis. An arbitrarily complex shape will increase the chances that the detected cluster is not significant, because the chance of finding strong clusters in the synthetic data of the Monte Carlo experiments also increases. The fit of the shape to the disease cluster also needs to be balanced with the computational need for the shape being considered. This second criterion, namely the computational need, has to be considered in conjunction with the search algorithm used. A search algorithm can be exhaustive by considering all possible clusters of the chosen shape. For example, in the retrospective analysis of the New Mexico brain cancer data (7), cylindrical space-time clusters were used. The disease occurrences and population counts were provided for each of the 32 counties included in the data. In an exhaustive analysis of cylindrical time-space clusters, all possible circular cross-sections would have to be considered, with each circular cross-section represented uniquely by the subset of counties included. Using a regular grid for the centers of the circular cross-sections and then exhaustively considering all possible radii might not be exhaustive, depending on the positions of the county centers and the choice of the grid. For cylindrical clusters, choosing a grid fine enough to be spatially exhaustive for a given data set might be practical. However, this approach might not be computationally effective for all data sets, and efficient algorithms that guarantee exhaustive exploration by cylindrical clusters need to be developed. Exhaustive methods might not be practical for more complex shapes. For example, the computational need is significantly higher for the square pyramid shape (6). One practical solution to detect square pyramid clusters is to use heuristic search, based on randomized algorithms (6). However, the p value computed by any method that is not guaranteed to be exhaustive needs to be validated (6). The use of these criteria is illustrated by evaluating the applications of two different cluster shapes to the New Mexico brain cancer data (7). This data set was analyzed by using cylindrical clusters with cross-sections restricted to having one of the 32 county locations as its center (2). To extend the analysis by using a more complex shape that can model either growth (or shrinkage) and movement over time, the consideration would be restricted to convex three dimensional shapes because allowing nonconvex shapes is too general for the modeling goal. The three dimensional convex hull would be the least restrictive convex shape, but it is still too general for the goal at hand, which is to model either growth or shrinkage, but not both. Truncated pyramids are adequate to model growth (or shrinkage) over time. The pyramid can model movement if its axis is not restricted to be orthogonal to the spatial plane. The degrees of freedom can be limited by choosing a regular polygon for the pyramid cross-section. Whereas the square cross-section is used as an example in this report, similar analysis can be performed with other regular polygons for the cross-section. The flexibility could have increased by allowing irregular polygons for the cross-sections. However, an attempt to use an irregular polygon (rectangle) for the crosssection of the pyramid was not successful. Obtaining effective convergence behavior for the randomized algorithm was substantially more difficult with this extra degree of freedom. As mentioned previously, the p values would also be expected to worsen if the cross-sections were not restricted to regular polygons. The truncated cone was also considered to be another cluster shape candidate. A regular polygon was chosen over the circle for the cross-section, because the computations with planes in the case of the polygon were simpler when they involved linear equations. In the next section, the New Mexico brain cancer data (7) are used to compare the results of the analyses by using two shapes, the cylindrical and square pyramid clusters. The intent of the analysis is not to conduct a public health investigation but to simply use this data set to illustrate the effect of cluster shape. ResultsThe data set (7) contains occurrences of 1,175 cases of brain cancer in 32 counties in New Mexico during 1973--1991. Occurrences are aggregated at the temporal granularity of a year. Population information is provided for each year. Three covariates are provided: age group, sex, and ethnicity. First, only the first two covariates will be considered. The third covariate, ethnicity, will be added, and the effect of this addition will be discussed. The inclusion and exclusion of covariates are not based on domain knowledge of their effect on cancer but are designed to merely illustrate the effect of the cluster shape in two different situations. Considering Covariates: Age Group and SexThe Poisson formulation for the spatial scan statistic provides adjusting for covariates by using indirect standardization (1). The two covariates, age group and sex, are adjusted for, and it is assumed that both covariates are relevant to the disease being analyzed. And the analysis is intended to find clusters that cannot be explained by these two covariates. First, results for the cylindrical clusters detected by using the SaTScan system will be presented (3). The results in the first column (Table 1) are generated by using the default mode in SaTScan without an explicit grid. The strongest cluster detected in this mode had a log likelihood ratio of 11.07 and a p value of 0.013; it includes 16 counties over a 5-year period, 1985--1989. This mode misses analyzing multiple potential cylindrical clusters and can be illustrated by using an explicit fine grid of size 1 Cartesian coordinate to perform the analysis. A fine grid is used to better approximate an exhaustive analysis for cylindrical clusters. The characteristics of the strongest cluster detected in this mode are included in the second column (Table 1). The cluster detected in this mode is stronger, with a log likelihood ratio of 13.70, and has a smaller spatial extent that included only 12 counties over the same 5-year period (1985--1989). The significant differences in the clusters detected by these two modes demonstrate the effect of approaching exhaustive analysis with the fine grid. Only the cylindrical clusters detected by using the fine grid will be considered in the rest of this report. Second, the results for the square pyramid cluster are presented (6). The characteristics of the strongest cluster detected by this heuristic search are presented in the last column (Table 1). The number of cases included in this square pyramid cluster (284) is larger than the number in the cylindrical cluster (265), which was detected by using a fine grid; it also extends over a longer period (1982--1989). The p value of 0.038 computed by using 999 Monte Carlo replications is higher than the 0.004 value for the cylindrical cluster (Table 1), but the cluster is significant using the threshold of 0.05. The cylindrical and square pyramid clusters can be compared by using the three dimensional and two dimensional views (Figures 4 and 5). In the two dimensional view (Figure 5), the county locations are indicated by an asterisk. This view also illustrates the square cross-sections of the pyramid for each of the 8 years. For the 5 years (1985--1989) common to both clusters, the square cross-sections of the pyramid are indicated with solid lines. The first 3 years (1982--1984) of the square pyramid cluster are not included in the cylindrical cluster and are marked with dashed lines. The square pyramid cluster originates with six counties during the beginning of 1982 but expands to include 15 counties during the end in 1989. In contrast, the cylindrical cluster with a spatial extent is marked by the circle covering 12 counties for the 5year period, 1985--1989. The square pyramid cluster also indicates movement over time in addition to the growth as certain counties at the right of the two dimensional view get dropped in the latter years. Together, the two dimensional and three dimensional views provide visualization of the cylindrical and square pyramid clusters, indicating key aspects (e.g., overlap). The visualization suggests that the detected cylindrical cluster could be viewed as a reasonable approximation of the detected square pyramid, given the constraints of its shape. Therefore, the analyses with these two shapes can be viewed as supporting each other. Adding Covariate: EthnicityIn this section, the covariate ethnicity is included in this analysis. This covariate can take one of three values: white, black, or other. The spatial distribution of the covariate in 1987 is illustrated (Figure 6). The bar chart (Figure 6) indicates the population fractions for the ethnicity values, black and other, for each of the 32 counties. The figure illustrates wide variation of the ethnicities over the counties. Analyzing this distribution for each year included in the cluster also indicates shifts in the distribution over time. Therefore, factoring out this covariate can be expected to affect the cluster detected. The results for both cluster shapes are presented (Table 2). The strongest cylindrical cluster is the same as in the two covariate cases in the section, Considering Covariates: Age Group and Sex. The log likelihood ratio of the strongest cylindrical cluster is lower (12.86) and the p value higher (0.01), with this additional covariate factored out. The analysis with cylindrical clusters differs in multiple aspects from the comprehensive public health perspective described in the literature (2). The temporal trend is not factored out, and the explicit fine grid in the analysis is also used. These factors affect the results and prevent a direct comparison. However, the set-up to a direct comparison between the two cluster shapes will be used. The square pyramid cluster detected in the previous subsection is not the strongest cluster any more when this additional covariate is factored out. The log likelihood ratio for the square pyramid cluster decreases to 16.05. Moreover, even the strongest square pyramid cluster detected with a log likelihood ratio of 16.208 is not significant with a p value estimate of 0.054 (using the earlier threshold of 0.05). Further investigation is needed to determine if the lack of a significant square pyramid cluster in this case is a result of the increased flexibility of the shape or a result of slow convergence of the randomized heuristic. Computational Issues and UsageThe implementation of the prototype took approximately 40 hours on an IBM Intellistation M-Pro computer with an Intel P4 processor running at 2.2 Ghz to perform each square pyramid analysis discussed previously. This high computational cost of the heuristic approach can limit its usage in a surveillance application where the analysis has to be performed frequently. However, when the computational cost is not an issue, clusters with complex shapes can be used in a surveillance application by using the methodology described in the literature (3). ConclusionThe purpose of considering the different sets of covariates in this report was to illustrate and compare the behavior of cluster detection methods with different underlying shapes. The actual set of covariates that needs to be adjusted for in any data set should be determined by the domain expert performing the analysis. The domain expert should also choose the cluster shape, keeping in mind the disease being modeled and the analysis goals. For example, a flexible shape like the square pyramid can model either growth (or shrinkage) and movement of the disease cluster and might provide certain insights into its origin. However, computational considerations might limit the analysis to use heuristic approaches that can only estimate the strongest cluster and, more importantly, its p value. Performing the analyses with more than one shape can lead to greater insights about the disease cluster. Moreover, more confidence is gained in these insights when the results of the analyses with different shapes support each other as illustrated in the previous example. Acknowledgments This work is supported by the Air Force Research Laboratory (AFRL)/Defense Advanced Research Projects Agency (DARPA) under AFRL Contract No. F30602-01-C-0184. Any opinions, findings, conclusions, or recommendations expressed in this material are those of the author and do not necessarily reflect the views of AFRL or DARPA. References
Table 1  Return to top. Figure 1 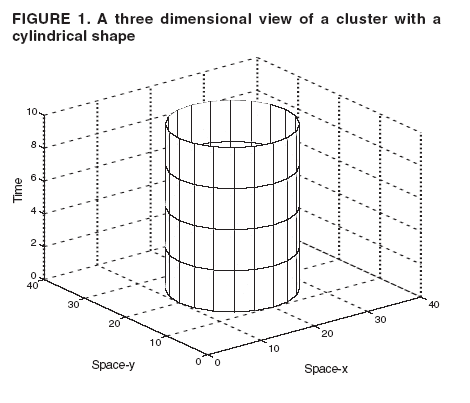 Return to top. Table 2  Return to top. Figure 2 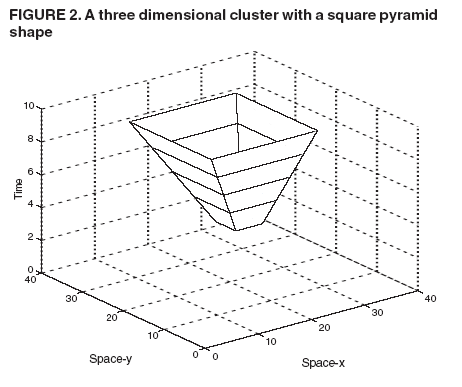 Return to top. Figure 3  Return to top.
Disclaimer All MMWR HTML versions of articles are electronic conversions from ASCII text into HTML. This conversion may have resulted in character translation or format errors in the HTML version. Users should not rely on this HTML document, but are referred to the electronic PDF version and/or the original MMWR paper copy for the official text, figures, and tables. An original paper copy of this issue can be obtained from the Superintendent of Documents, U.S. Government Printing Office (GPO), Washington, DC 20402-9371; telephone: (202) 512-1800. Contact GPO for current prices. **Questions or messages regarding errors in formatting should be addressed to mmwrq@cdc.gov.Date last reviewed: 8/5/2005 |
|||||||||
|