Persons using assistive technology might not be able to fully access information in this file. For assistance, please send e-mail to: mmwrq@cdc.gov. Type 508 Accommodation and the title of the report in the subject line of e-mail.
Analytic Methods
Public Health Monitoring Tools for Multiple Data Streams
Howard S. Burkom,1 S. Murphy,1 J.
Coberly,1 K. Hurt-Mullen2
1Johns Hopkins Applied Physics Laboratory, Laurel, Maryland; 2Montgomery County Department of Health and Human Services, Silver Spring, Maryland
Corresponding author: Howard S. Burkom, Johns Hopkins Applied Physics Laboratory, 11100 Johns Hopkins Rd., MS 8-220, Laurel, MD 20723. Telephone: 240-228-4361; Fax: 240-228-5950; E-mail: Howard.Burkom@jhuapl.edu.
Disclosure of relationship: The contributors of this report have disclosed that they have no financial interest, relationship, affiliation, or other association with any organization that might represent a conflict of interest. In addition, this report does not contain any discussion
of unlabeled use of commercial products or products for investigational use.
Abstract
Introduction: In concert with increased concerns regarding both biologic terrorism and new natural
infectious disease threats (e.g., severe acute respiratory syndrome [SARS] and West Nile virus), as a result of advances in medical
informatics, various data sources are available to epidemiologists for routine, prospective monitoring of public health. The synthesis of this evidence requires tools to find anomalies within various data stream combinations while maintaining manageable false alarm rates.
Objectives: The objectives of this report are to establish statistical hypotheses to define the compound multivariate problem of surveillance systems, present statistical methods for testing these hypotheses, and examine results of applying these methods to simulated and actual data.
Methods: Canonical problems of parallel monitoring and consensus monitoring are considered in this report. Modified Bonferroni methods are examined for parallel monitoring. Both multiple univariate and multivariate methods are applied
for
consensus monitoring. A multivariate adaptation of Monte Carlo trials, using the injection of epidemic-curve-like signals in the multiple data streams of interest, is presented for evaluation of the various tests.
Results: The Monte Carlo test results demonstrate that the multiple univariate combination methods of Fisher
and Edgington provide the most robust detection performance across the scenarios tested. As the
number of data streams increases, methods based on Hotelling's
T2 offer added sensitivity for certain signal scenarios. This potential advantage
is clearer when strong correlation exists among the data streams.
Conclusion: Parallel and consensus monitoring tools must be blended to enable a surveillance system with distributed sensitivity and controlled alert rates. Whether a multiple univariate or multivariate
approach should be used for consensus monitoring depends on the number and distribution of useful data sources and also on their covariance structure
and stationarity. Strong, consistent correlation among numerous sources warrants the examination of multivariate control charts.
Introduction
In concert with increased concerns regarding both biologic terrorism and new natural infectious disease threats (e.g., severe acute respiratory syndrome [SARS] and West Nile
virus), as a result of advances in medical informatics, data sources
are available to epidemiologists for routine, prospective monitoring of public health. Persons who daily monitor these data sources must synthesize recent, disparate evidence to make decisions about possible public health concerns. To synthesize evidence, tools must be used that can find anomalies
in single data streams and in various stream combinations while
maintaining manageable false alarm rates. In this report, a framework is proposed for this synthesis; basic epidemiologic hypotheses for routine testing are presented and standard algorithms
from other fields are adapted for testing them.
Implementation principles are offered, but derived multivariate strategies depend on the available data streams, on their individual and covariate behavior, and on the goals and resources
of the monitoring organization.
Objectives
Two prototype health monitoring problems are considered. The first problem, the parallel monitoring
problem, is
the monitoring of time series representing different physical locations (e.g., counties or treatment facilities) that are possibly stratified by other covariates (e.g., syndrome type or age group). The issue is how to maintain sensitivity
while limiting the number of alerts that arise from testing the multiple resulting time series. Empirical thresholds can
be chosen to
achieve expected background alert rates of
m per week or per month, where m depends on the investigation capacity and tolerance
of the monitoring system. The second problem, the consensus monitoring problem, is the testing of a single hypothesis by using multiple sources of evidence. For example, suppose that the null hypothesis is that no current outbreak of gastrointestinal disease exists in the monitored population. Usually, evidentiary time series available to test this hypothesis are syndromic counts of emergency department visits, outpatient clinic office appointments, and sales of overthe-counter remedies.
The question is how to make decisions based on all available data sources
(i.e.,whether to combine results of tests applied to
the individual time series or to apply a multivariate algorithm to the collection of visits, appointments, and sales) and how
to implement the chosen strategy most effectively.
The purview and resources of a group performing surveillance will determine the importance of these two monitoring problems. This report discusses statistical hypothesis tests specific to these problems, presents an approach for evaluating and comparing these tests, and applies this approach to gain preliminary insights. Algorithms used to implement some of
these tests are either implemented or being reviewed in the Electronic Surveillance System for the Early Notification of Community-Based Epidemics (ESSENCE) biosurveillance systems
(1).
Methods
Multiple methods that are presented combine the results of separate hypothesis tests. The computed p values provide
test results amenable to these methods in the interval [0, 1]. Whereas a typical null hypothesis is that the current value(s) belong to
some assumed probability distribution, the epidemiologic null hypothesis is that disease incidence is at expected levels. Even for tests of clinical diagnosis data, the rejection of the statistical hypothesis might not imply rejection of the epidemiologic one. In examples in this report, nominal thresholds of p = 0.05 and
p = 0.01 are used, but in practical circumstances with unknown time series distributions from various data sources, the probabilistic interpretation is frequently unclear,
and empirical threshold choices might be necessary for robust detection performance. Historical data sets or simulations can be used to make such threshold choices. Statistical properties of the methods (i.e., parallel monitoring methods,
consensus methods, multiple univariate methods, and multivariate methods) depend on constant data variance (and on
constant covariance for the multivariate methods); therefore, estimates of variance and other baseline parameters should be
updated regularly to adapt to nonstationary behavior. The term "alert" is used to denote a threshold crossing, whereas false "alert" will refer to a threshold crossing unrelated to an increase in incidence of the disease type of
concern.
Parallel Monitoring Methods
Multiple testing can lead to uncontrolled alert rates as the number of data streams increases. For example, suppose
that
a hypothesis test is conducted on a time series of daily diagnoses of influenza-like illness. In a one-sided test, this test results in a statistical value in some distribution that yields a probability
p that the current count is as large as observed. For a desired
Type I error probability of α, the probability is then
(1-α) that an alert will not occur in the distribution assumed for data with
no underlying aberrations. Therefore, for the parallel monitoring problem of interest, if such tests are applied to n independent data streams, the probability that no background alerts occur is
(1-α)n, which increases quickly for practical error rates
a (exceeding 0.5 for α = 0.05 and n >13).
A common method of controlling this multiple testing problem is to replace the probability threshold "a" with
the Bonferroni bound α / N, where N is the number of monitored data streams
(2). The resulting criterion is sufficient
but usually not necessary for ensuring an overall Type I error rate of at most a, and it frequently
results in an increased loss of sensitivity. Several published modifications
(3--6) of the Bonferroni procedure maintain the error rate of "a" with less
stringent rejection criteria. Let P(1),…,
P(N) be the p-values sorted in ascending order. In a
stagewise rejective multiple test
(3), combined null hypothesis was used if for any j, j = 1...N, i.e.:
P(j) < j · a / C · N, where C =
Σ 1/j.
This criterion provides an overall error rate of "a" for C = 1 if the tests are independent
(4), and this relaxed criterion has been demonstrated to maintain this error rate for multiple common multivariate data sets with positive correlation (6). These improvements were applied when it was demonstrated
(7) that they control the false discovery rate (FDR), or expected
ratio of false alerts to the total alert count. For
example, FDR methods have been used to monitor CUSUM results of hospital
data streams from multiple districts in the National Health Service of the United Kingdom
(8).
For a large number of data streams and a well-defined signal, Bonferroni modifications might substantially
improve detection performance (9). However, for a limited number of data streams (e.g., 24--36 counties or treatment facilities) these criteria yield alert rates within approximately 0.1 of the rates from the Bonferroni bound, unless the data are highly correlated.
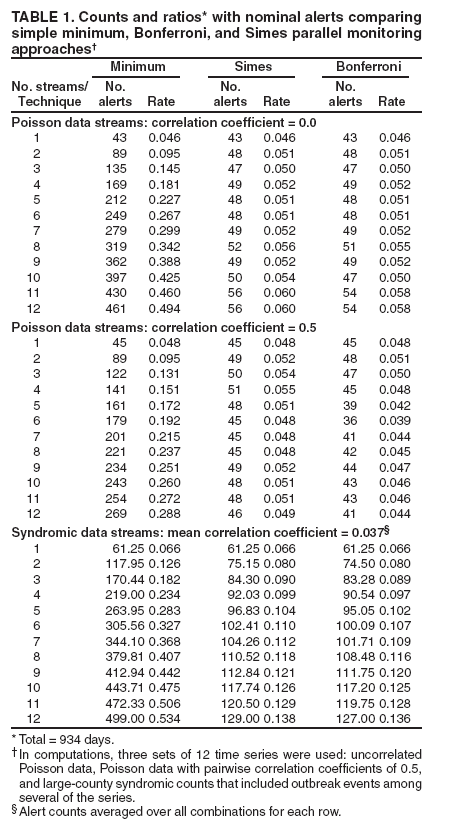
The manner in which the number of alerts increase with the number of simultaneous tests is presented (Table 1).
The columns are alert rates obtained by combining p values from a control chart method applied to a data set containing 934 days of daily counts. The first two data sets represent independent and correlated background noise. The first
was a set of 12 independent Poisson-distributed time series with a mean value of 50. The second data set consisted of 12 series that
were similar except that each pairwise correlation coefficient was approximately 0.5. The third data set contained 12 series of syndromic counts from a large (median count: >10 per day) county that
included outbreak events among several of the series. Data use agreements prevent disclosure of the
actual values, but individual time series were Poisson-like, with
variance/mean ratios (excluding one 6-week influenza season) >1.5 in only two of the series and with a mild dayof-week effect present in only one. The mean pairwise correlation coefficient was 0.037, whereas the median was 0.023; therefore, they can be
viewed as independent. An exponentially weighted moving average (EWMA) control chart appropriately scaled to
return values (10) was applied to all three sets of time
series. Such charts have been applied widely for hospital surveillance
(11--13). The first column (Table 1) indicates the number of series combined in each row, increasing from a single series in the top row to all 12 at the bottom. The three columns for each data set indicate the daily alert rates as the fractions of days on which the combined values decline below a = 0.05, computed by three methods. If the p values for the day in ascending order are P(1)…P(N), then
Minimum method: alert if P(1) <
α,
Simes method: alert if Mininum ( N · P(j) / j ) <
α, j = 1…N,
Bonferroni method: alert if P(1) / N <
α.
The multiple-testing problem is illustrated for each data set by the rapid increase in the alert rate using the minimum p value. For the two simulated data sets, the Simes and Bonferroni alert rates are comparable to formerly published values
(6). The columns computed from the actual syndromic counts indicate realistic alert rates in the presence of scattered signals.
The combination methods control the increase in alert rates with the number of data streams, and for these nearly independent streams, the Simes alert rates are only slightly (Table 1) above the Bonferroni rates. This difference increases as data streams are added, as their correlation increases, and as the alerting threshold "a" is increased. These factors should be considered in the choice of a parallel monitoring method intended
to control alert rates.
Regarding the Simes method, only p values below the nominal threshold "a" affect the result. No consensus effect exists
(see Consensus Monitoring Methods);the method applied to 10 p values of 0.06 returns 0.06. The Simes criterion (3--5) does not specify which of the data streams is anomalous; a procedure
(4) is to reject the null hypothesis for all streams with p
values below the largest one that satisfies the Simes method inequality. More conservative closed-form criteria (5) have been developed that indicate which component hypotheses to reject, and the designers of large, complex systems with hundreds of simultaneous data streams should consider these criteria.
Consensus Monitoring Methods
The consensus problem is the combination of clinical and nonclinical evidence to gain sensitivity in disease monitoring.
The scope of this report is restricted to prospective monitoring with daily or more frequent syndromic data so
that hypothesis testing can apply. The data streams can be combined at more than one level. Multiple univariate and multivariate strategies are considered.
Multiple Univariate Methods
The multiple univariate methods resemble those of the Parallel Monitoring section except that the p values
are combined to produce a single p value p* = f(
p1,…,pn ) with the consensus property that multiple near-critical values can produce
a
critical one. Multiple such functions are possible; two methods adapted from use in independent, sequential clinical trials are considered. The first method is Fisher's rule
(14), a function of the product of the p values. The statistic is
For independent tests, values of this quantity form a
χ2 distribution with 2n degrees of freedom. As a
multiplicative method, it is more sensitive to a few small p values than to a broader number of moderate values. The recommendation is to use the Fisher's Ruleif the objective is to extract a single decision on whether to avoid the overall null hypothesis and avoid considering the individual pj,.
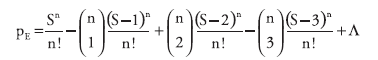
The second statistic is Edgington's method
(15), an additive method that calculates the resultant p value as
where S is the sum of the n p values. The summation continues until (S-j) is no longer positive. This additive method is more sensitive to multiple, near-critical values. For approximately 24--36 data
streams, this formula cannot be computed accurately. In such cases, the expression
(mean(p) -- 0.5 ) / ( 0.2887 /
√ n)
gives a z-score with a Gaussian probability that is a close
approximation to this formula (16).
If the data streams are independent, Edgington's method gives fewer alerts than Fisher's method at nominal thresholds but is more sensitive to data correlation. Edgington's method is recommended if the number of data streams is modest (e.g.,
<12 data streams) and the user wants a sensitive consensus indicator in addition to the individual test results.
This need has been expressed by epidemiologist users of the ESSENCE biosurveillance systems and is common among large system users
who require some summarization but are skeptical of bottom-line results that hide the contributions of individual evidence sources.
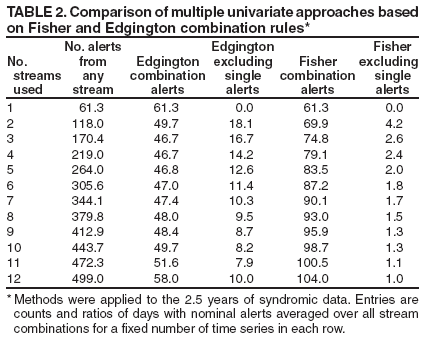
An example (Table 2) of the performance of these methods applied to the 2.5 years of syndromic data (Table 1) is
presented. Again, the multiple-testing problem is evident, and both the Fisher and Edgington methods control the alert rate growth with the number of data streams. Each entry in the row representing r data streams is the mean of the alert rates computed for
all
combinations of the 12 streams taken r at a time. Mean alert counts indicate the number of the combination alerts that are picked up by the individual tests. Edgington's method gives smaller alert rates because of the independence of the data streams, and the majority of the alerts found with Fisher's
method are also individual
stream alerts. However, because it is an additive method, small single p values do not necessarily cause alerts in Edgington's method; therefore, if the system is not also monitoring single streams, the use of Fisher's method or both methods is recommended.
Multivariate Methods
The motivation to use fully multivariate methods is that they can detect distributed faint outbreak evidence that might be lost in the individual hypothesis tests, and strong correlation among the data sources might also be exploited. Efforts have been confined to multivariate statistical process control (MSPC) charts based on Hotelling's T2 as applied in surveillance efforts
in related fields (17). The T2 statistic can be written as
(X- µ) S-1 (X- µ)
where
X = multivariate data from the test interval,
µ = vector mean estimated from the baseline interval, and
S = estimate of covariance matrix calculated from the baseline interval.
Whereas T2 can be viewed as a multidimensional z-score, this method has been generalized to
obtain other multivariate control charts. A multivariate EWMA chart (MEWMA) has demonstrated
improved run length characteristics (18) with health surveillance data
(19). In MEWMA, the data vector is replaced by the exponentially weighted moving average:
Zj = R X + (1-R) Zj-1
where R is a diagonal matrix of smoothing coefficients, and the covariance matrix is a scalar multiple of the data covariance matrix S in the usual application where equal smoothing coefficients are used
(18). This method is demonstrated in the Results section. Analogous multivariate CUSUMs have also been applied to surveillance data, with the
Crosier's multivariate cumulative sum (MCUSUM) method (20)
applied to syndromic data from multiple hospitals
(21) and Pignatiello's MCUSUM (22) applied to yearly, spatially distributed counts of breast cancer incidence (23). Whereas the attraction of these multivariate methods is their signal sensitivity, they are also sensitive to noise background changes. Hotelling's T2 has been described (24) as "particularly bad at distinguishing location shifts from scale shifts." Combined univariate methods are directional in that they might be quick to detect shifts in just a few data sources but less sensitive to shifts in more
general directions (23). These methods are omnidirectional, a property that can be useful in detecting an earlier signal, but can
also cause false alerts if a change in the covariance matrix occurs that is irrelevant to any outbreak signal of interest.
Results
Evaluation Methodology
In this section, simulation is used to test the detection performance of some of the consensus monitoring methods
discussed previously. In this testing, direct choice of the minimum p value was compared with the Fisher and
Edgington multiple univariate methods and with Hotelling's
T2 and Lowry's MEWMA among the multivariate methods.
For background data, eight time series simulating 700 days of syndromic data counts were formed by random draws from
a Poisson distribution with a mean of 100. The individual and consensus alerting methods were applied to the unaltered background data to find threshold p values corresponding to three alert rates considered practical for public health monitoring: one alert every 2 weeks, every 4 weeks, and every 6 weeks.
For the signal to be detected, injected cases attributable to a presumed outbreak were added to the background data.
These data epicurves were stochastically drawn from an ideal incubation period distribution to test the ability of each method to detect outbreak-like signals (10). This procedure differs from the standard method of adding a fixed quantity to the process mean to find the average run length of a control chart
(1).
The incubation period distribution (25) was used to estimate the idealized curve for the expected number of
new symptomatic cases on each outbreak day. The lognormal parameters were chosen to give a median incubation period of 3.5
days, consistent with the symptomatology of known weaponized diseases (26) and a temporal case dispersion consistent
with previously observed outbreaks (25).
The stochastic epicurves were drawn from the resulting lognormal distribution. To challenge the algorithms, the number of attributable cases on the peak day of the outbreak was set at one
standard deviation of the background data. The
total outbreak size N was this peak value divided by the maximum of the lognormal probability
density function.
Individual incubation periods were then chosen with a set of N random lognormal draws and rounded to the nearest day. The number of cases to add for each day after onset was then the number of draws that were rounded to that day. The evaluation process
was to add one of these stochastic epidemic curves to the background time series at a randomly chosen start day beyond an 8-week start-up period for the alerting method and then to run the alerting methods on the time series
to determine whether the thresholds were exceeded for each practical alert level. Algorithm performance can be precisely measured in this process because the start and duration of each simulated outbreak are known.
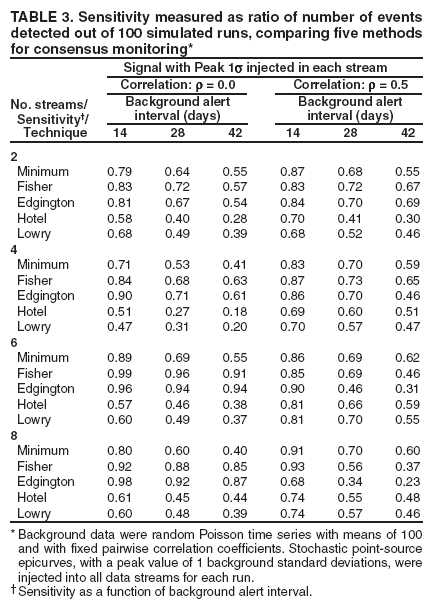
This process was repeated for 100 trials; for each alert level, algorithm sensitivity was measured as the ratio of the trials for which the algorithm output exceeded threshold for that level during the outbreak injection interval.
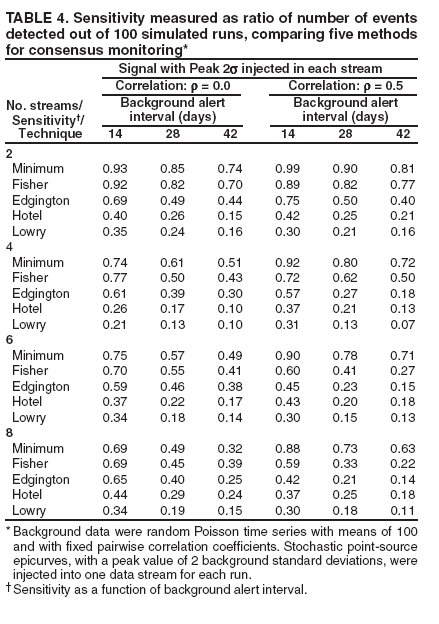
Tables of sensitivity calculations are indicated for sets of 2, 4, 6, and 8 background data streams in which simultaneous stochastic signals were added to all streams in a set (Table 3). The table represents two background data
sets: the three left-hand columns are results for a set with independent data streams, and the three right-hand columns are for a set computed
so that each pairwise correlation coefficient among the eight streams was 0.5. Key features among the method comparisons exist.
The multiple univariate methods indicate uniformly better sensitivity than the multivariate methods
among
the independent data streams for this transient signal type. For the correlated data, the multivariate methods have
better sensitivity for six and eight data streams, an advantage that should continue to increase with the number
of streams.
For the independent data streams, the controlled alert rates of the Fisher and Edgington methods yield sensitivity advantages over the simple minimum method, increasing with
the number of
data streams.
Whereas the Edgington method has effective sensitivity for independent data, the correlation
degrades its
performance critically at the stricter alert levels. The Fisher method indicates the same effects
to a lesser degree.
These observations suggest that the choice of multiple univariate or multivariate methods should
depend on
the number
of data streams monitored and on their correlation characteristics. For a large enough collection
of highly correlated data streams, the alert rate for even the Fisher method would suffer, but multivariate methods might retain sensitivity.
The same comparisons are demonstrated (Table 4) but with the signal injected into only one
stream (i.e., the
consensus factor in these methods offers no advantage). For the single signal results in this table, the peak value was increased to twice the standard deviation of the background data. The multivariate methods fared poorly in these runs, even in the
correlated data. For the consistently correlated data, the sustained sensitivity of the simple minimum suggests two principles for system designers. First, attempts to remove cross-correlation with modeling of known features (seasonal, day-of-week effects)
should be tried in the univariate algorithms so that the combination methods will be more robust. Second, the
parallel monitoring methods should be employed to remain aware of individual algorithm outputs.
Conclusion
This report presents and examines statistical tools for systematizing the prospective monitoring of public
health by using various spatially distributed time series data. The modeled multiple-stream scenarios illustrate the need to blend the parallel and consensus monitoring tools to achieve a system with distributed sensitivity and controlled alert rates.
Parallel monitoring methods in which modified Bonferroni criteria are used are important to retain detection power
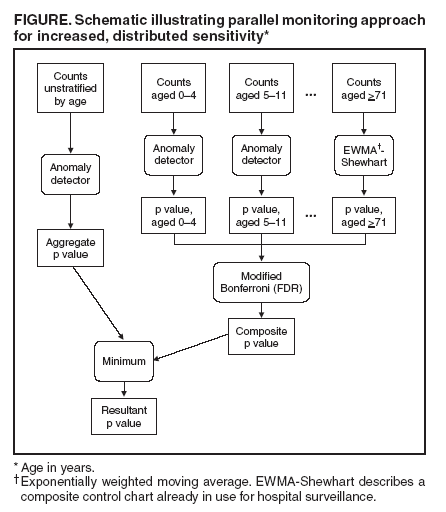
at controlled alert rates. A flowchart (Figure) is presented, envisioned as part of a distributed, syndromic monitoring system diagram, for a method to combine agestratified and unstratified monitoring methods for increased sensitivity to localized outbreaks, which have proven difficult (27) for large systems to detect.
The choice of a multiple univariate or multivariate approach for consensus monitoring depends on the number
and distribution of useful data sources and also on their covariance structure and stationarity. Strong, consistent correlation among multiple sources warrants the examination of multivariate control charts. However, whereas explicitly multivariate
methods offer the possibility of increased sensitivity, careful attention must be given to data interrelationships when using them. These
charts must be proven sufficiently robust to customary variation in the correlation among data streams to ensure that the signals are not overwhelmed by multivariate noise.
Ryan TP. Statistical methods for quality improvement. New York, NY: John Wiley & Sons; 1989:64.
Hommel G. A stagewise rejective multiple test procedure based on a modified Bonferroni Test. Biometrika
1988;75:383-
-6.
Simes RJ. An improved Bonferroni procedure for multiple tests of significance. Biometrika 1986;73:751--
4.
Hochberg Y. A sharper Bonferroni procedure for multiple tests of significance. Biometrika 1988;75:800--2.
Sarkar SK, Chang C-K. The Simes method for multiple hypothesis testing with positively dependent test statistics. J Amer
Stat Assoc
1997;92:1601--8.
Benjamini Y, Hochberg Y. Controlling the false discovery rate: a practical and powerful approach to multiple testing. J
Royal Stat Soc
B 1995;57:289--300.
Marshall C, Best N, Bottle A, Aylin P. Statistical issues in prospective monitoring of health outcomes across multiple
units. J Royal
Stat Soc
A 2004;167(Pt 3):541--59.
Miller CJ, Genovese C, Nichol RC, et al. Controlling the false discovery rate in astrophysical data analysis. Astronomical
Journal
2001;122:3492.
Burkom H, Hutwagner L, Rodriguez R. Using point-source epidemic curves to evaluate alerting algorithms for
biosurveillance. In:
Proceedings
of the 2004 American Statistical Association, Statistics in Government Section [CD-ROM]; 2004. Toronto, Canada: American Statistical Association; January 2005.
Morton AP, Whitby M, McLaws M-L, et al. The application of statistical process control charts to the detection and
monitoring of
hospital-acquired infections. J Qual Clin Prac 2001;21:112--7.
Benneyan JC. Statistical quality control methods in infection control and hospital epidemiology: introduction and basic
theory.
Infect Control
Hosp Epidemiol 19;4(Pt 1):194--214.
Benneyan JC. Statistical quality control methods in infection control and hospital epidemiology: chart use, statistical
properties,
and research
issues. Infect Control Hosp Epidiology 19;4(Pt 2):265--83.
Bauer P, Kohne K. Evaluation of experiments with adaptive interim analyses. Biometrics 1994;50:1029--41.
Edgington ES. An additive method for combining probability values from independent experiments. J Psychol 1972;80:351--
63.
Edgington ES. A normal curve method for combining probability values from independent experiments. J Psychol
1972;82:85--9.
Ye N, Cheng Q, Emran S, Vilbert S. Hotelling's
T2 multivariate profiling for anomaly detection. In: Proceedings of the 2000 IEEE Workshop
on Information Assurance and Security; 2000. West Point, NY:
IEEE; June 2002.
Lowry CA, Woodall WH. A multivariate exponentially weighted moving average control chart. Technometrics
1992;34:46--53.
Hong B, Hardin M. A report of the properties of the multivariate forecast-based processing scheme. In: Proceedings of
the Joint
Statistical
Meetings; 2004. Toronto, Canada: American Statistical Association; August 2004.
Crosier RB. Multivariate generalizations of Cumulative Sum Quality-Control Schemes. Technometrics 1988;30:291--303.
Stoto M. Multivariate methods for aberration detection: a simulation report using the District of Columbia's syndromic
surveillance
data.
In: Proceedings of the 2004 National Syndromic Surveillance Conference [Oral Presentation]. Boston, MA; 2004.
Pignatiello JJ, Runger GC. Comparisons of multivariate CUSUM charts. J Qual Technol 1990;22:173--86.
Rogerson PA, Yamada I. Monitoring change in spatial patterns of disease: comparing univariate and multivariate
Cumulative Sum
Approaches. Stat
Med 2004;23:2195--214.
Hawkins D. Multivariate quality control based on regression-adjusted variables. Technometrics 1991;33:61--75.
Sartwell PE. The distribution of incubation periods of infectious disease. Amer J Hyg 1950;51:310--8. Am J Epidemiol
1995(Reprint);
141:301--18.
US Army Medical Research Institute of Infectious Diseases. Medical Management of Biological Casualties. 4th ed. Ft. Detrick, MD: US
Army
Medical Research Institute of Infectious Diseases; September 2000.
Balter S. Three years of emergency department gastrointestinal syndromic surveillance in NYC: what have we found? In:
Proceedings
of the
National Syndromic Surveillance Conference; 2000 [Oral Presentation]. Boston, MA; 2004.
Use of trade names and commercial sources is for identification only and does not imply endorsement by the U.S. Department of
Health and Human Services.References to non-CDC sites on the Internet are
provided as a service to MMWR readers and do not constitute or imply
endorsement of these organizations or their programs by CDC or the U.S.
Department of Health and Human Services. CDC is not responsible for the content
of pages found at these sites. URL addresses listed in MMWR were current as of
the date of publication.
Disclaimer
All MMWR HTML versions of articles are electronic conversions from ASCII text
into HTML. This conversion may have resulted in character translation or format errors in the HTML version.
Users should not rely on this HTML document, but are referred to the electronic PDF version and/or
the original MMWR paper copy for the official text, figures, and tables.
An original paper copy of this issue can be obtained from the Superintendent of Documents,
U.S. Government Printing Office (GPO), Washington, DC 20402-9371; telephone: (202) 512-1800.
Contact GPO for current prices.
**Questions or messages regarding errors in formatting should be addressed to
mmwrq@cdc.gov.