 |
|
|
|
|
|
|
| ||||||||||
|
|
|
|
|
|
|
||||
| ||||||||||
|
|
|
|
|
Persons using assistive technology might not be able to fully access information in this file. For assistance, please send e-mail to: mmwrq@cdc.gov. Type 508 Accommodation and the title of the report in the subject line of e-mail. Improving Outbreak Detection by Signal Integration*Paola Sebastiani,1,2 L.
Wang,1,2 K.D. Mandl,2,3 M.
Ramoni2,3
Corresponding author: Paola Sebastiani, Department of Biostatistics, Boston University School of Public Health, 715 Albany Street, Boston MA 02118. Telephone: 617-638-5877; Fax: 617-638-6484; E-mail: sebas@bu.edu. AbstractIntroduction: A critical problem of surveillance systems is the trade-off between true and false detections. Integration of different monitors and information from exogenous sources can increase the true-detection rate by limiting the false-detection rate. Objective: The authors introduce a probabilistic architecture able to achieve a substantial detection rate while keeping false detections low. Methods: The architecture is a Bayesian network that encodes probabilistic information through a directed graph. The nodes and arrows represent variables and stochastic dependencies quantified by probability distributions. The integration of two systems for syndromic surveillance at a pediatric and adult hospital is illustrated by using a respiratory illness outbreak (Figure). Empirical evaluations have demonstrated that true and false-alert rates are affected by influenza epidemics, by air quality as measured by pollen level, and by whether the alert day is a holiday. The network integrates the sources of information to compute the probability of an outbreak (given that one or both systems generate alerts) and what is known about the other variables. The probability tables quantifying the network were obtained from data contaminated with different simulated outbreaks. The integrator was validated on 84 simulated outbreaks. Results and Conclusions: This study indicates that the integration of the two monitoring systems with exogenous information has a 73% true-detection rate with an 8% false-detection rate in limited outbreaks (i.e., an average of four ill persons/day), and 97% true-detection rate with 10% false-detection rate in more substantial outbreaks (i.e., an average of eight ill persons/day). * This work was supported by the Alfred P. Sloan Foundation (Grant 2002-12-1). Figure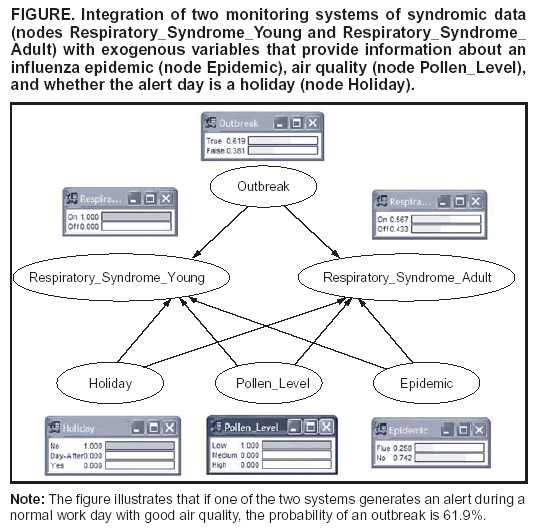 Return to top.
Disclaimer All MMWR HTML versions of articles are electronic conversions from ASCII text into HTML. This conversion may have resulted in character translation or format errors in the HTML version. Users should not rely on this HTML document, but are referred to the electronic PDF version and/or the original MMWR paper copy for the official text, figures, and tables. An original paper copy of this issue can be obtained from the Superintendent of Documents, U.S. Government Printing Office (GPO), Washington, DC 20402-9371; telephone: (202) 512-1800. Contact GPO for current prices. **Questions or messages regarding errors in formatting should be addressed to mmwrq@cdc.gov.Page converted: 9/14/2004 |
|||||||||
This page last reviewed 9/14/2004
|