Persons using assistive technology might not be able to fully access information in this file. For assistance, please send e-mail to: mmwrq@cdc.gov. Type 508 Accommodation and the title of the report in the subject line of e-mail.
Should We Be Worried? Investigation of Signals Generated by
an Electronic Syndromic Surveillance System ---
Westchester
County, New York
William Terry, B. Ostrowsky, A. Huang
Westchester County Department of Health, New Rochelle, New York
Please note:
An
erratum has been published for this article. To view the erratum, please
click here.
Corresponding author: William Terry, Westchester County Department of Health, 145 Huguenot Street, 8th floor, New Rochelle, NY 10801. Telephone: 914-813-5203; Fax: 914-813-5182; E-mail:
wwt1@westchestergov.com.
Abstract
Introduction: In January 2003, the Westchester County Department of Health (WCDH) began conducting
electronic syndromic surveillance of hospital emergency department (ED) chief complaints. Although methods for data collection and analysis used in syndromic surveillance have been described previously, minimal information exists regarding the responses
to and investigations of signals detected by such systems. This paper describes WCDH's experience in responding to syndromic surveillance signals during the first 9 months after the system was implemented.
Objectives: The objectives of this analysis were to examine WCDH's responses to signals detected by the county's syndromic surveillance system. Specific goals were to 1) review the actual complaints reported by hospital EDs to determine
whether complaint data were accurately identified and classified into syndrome categories, and provide feedback from this review to data collection and analysis staff to refine text terms or filters used to identify and classify chief complaints; 2)
develop procedures and response algorithms for investigating signals; 3) determine whether signals correlated with
reportable communicable diseases or other incidents of public health significance requiring investigation and intervention; and 4) quantify the staffing resources and time required to investigate signals.
Methods: During January 27--October 31, 2003, electronic files containing chief-complaint data from seven of the
county's 13 EDs were collected daily. Complaints were classified into syndrome categories and analyzed for statistically significant increases. A line listing of each complaint comprising each signal detected was reviewed for exact complaint, number, location, patient demographics, and requirement for hospital admission.
Results: A total of 59 signals were detected in eight syndrome categories: fever/influenza (11), respiratory (6), vomiting (11), gastrointestinal illness/diarrhea (8), sepsis (7), rash (7), hemorrhagic events (3), and neurologic (6). Line-listing review indicated that complaints routinely were incorrectly identified and included in syndrome categories and that as few as three
complaints could produce a signal. On the basis of hospital, geographic, age, or sex clustering of complaints, whether the complaint indicated a reportable condition (e.g., meningitis) or potentially represented an unusual medical event, and whether rates of hospital admission were consistent with medical conditions, 34 of 59 signals were determined to require further investigation
(i.e., obtaining additional information from ED staff or medical providers). Investigation did not identify any reportable communicable disease or other incidents of public health significance that would have been missed by existing
traditional surveillance systems. Nine staff members spent 3 hours/week collectively investigating signals detected by syndromic surveillance.
Conclusions: Standardized sets of text terms used to identify and classify hospital ED chief complaints into
syndrome categories might require modification on the basis of hospital idiosyncrasies in recording chief complaints. Signal
investigations could be reasonably conducted by using local health department resources. Although no communicable disease events were identified, the system provided baseline and timely objective data for hospital visits and improved communication
among county health department and hospital ED staff.
Introduction
Westchester County (2000 population: 923,459) is located directly north of New York City and is served by 13 acute-care hospitals with emergency departments (EDs). Existing communicable disease surveillance systems include passive
surveillance based on notification by physicians or laboratories of reportable communicable diseases and reports from schools and health-care facilities. WCDH has routinely conducted active surveillance for specific diseases or situations (e.g., telephoning hospitals to identify possible cases of West Nile virus after the advent of this disease in 1999). Increasing concern about
potential incidents of biologic terrorism has highlighted the need for surveillance systems to permit the earliest possible detection of such an incident. Efforts to develop an electronic syndromic surveillance system in Westchester County were initiated
before the September 11, 2001, terrorist attacks; the system was implemented in January 2003. Although methods for data collection and analysis used in syndromic surveillance systems have been described
previously(1,2), minimal information exists
about the responses to and investigations of signals detected by such surveillance systems. This paper describes responses by WCDH disease investigative staff to syndromic surveillance signals. The data collection and analysis methods used have been described previously (1,3).
Westchester County's Syndromic Surveillance System
On the basis of similar systems developed and implemented by other local health departments
(2,4), WCDH implemented an electronic syndromic surveillance system in January 2003 in four of the county's 13 hospital EDs. By October 2003, the system had been expanded to include seven hospitals. Data from the seven EDs captured approximately 600 daily ED
visits, which represented approximately 70% of total daily ED visits to all 13 county hospitals. Data collected on
each patient included the chief complaint for which the patient was seeking medical attention, hospital name, patient age,
sex, medical record number, municipality and zip code of residence, ED visit date, and whether the patient was
subsequently
discharged from the ED or admitted to the hospital. On the basis of text search terms and syndrome categories developed
by other local health departments and CDC
(5), chief complaints were classified into eight syndrome categories:
1) fever/influenza in patients aged >13 years, 2) respiratory complaints in patients aged >13 years, 3) vomiting, 4)
gastrointestinal illness/diarrhea, 5) sepsis, 6) rash, 7) hemorrhagic events, and 8) neurologic events.
For each syndrome category, the number of complaints or visits for each category was analyzed to identify any
statistically significant increases in visits. The
cumulative sum method (CUSUM) was used for statistical analysis
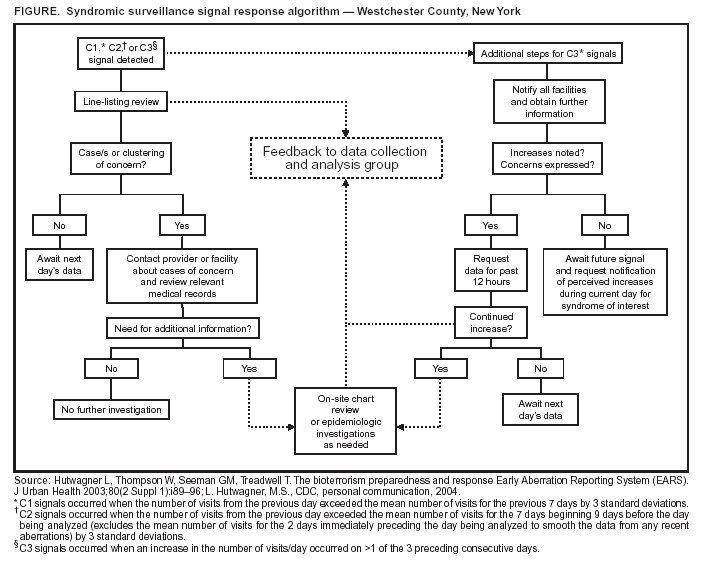
(1); three possible signal types (C1, C2, or C3) could be generated for each of the eight syndrome categories
(3). A C1 signal was generated when the number of visits from the previous day exceeded the mean number of visits for the previous 7 days by 3 standard deviations. A C2 signal was generated when the number of visits from the previous day exceeded the mean number of visits for the 7
days beginning 9 days before the day being analyzed (excluding the mean number of visits for the 2 days immediately preceding
the day being analyzed to smooth the data from any recent aberrations) by 3 standard deviations. A C3 signal was generated when an increase in the number of visits/day occurred on >1 of the 3 preceding consecutive days
(1, L. Hutwagner, M.S., CDC,personal communication, 2004). Each time a signal was
detected, WCDH disease investigative staff were notified
and provided with a line listing of complaints comprising the signal and containing the data elements listed previously.
Objectives
The objective of this analysis was to examine WCDH's
responses to signals detected by a syndromic surveillance
system. Specific goals were as follows:
review the actual complaints submitted by reporting hospital EDs to determine whether complaints were
accurately identified and classified into syndrome categories;
provide feedback from this review to data collection and analysis staff to refine text terms or filters used to identify and classify chief complaints into syndrome categories;
develop procedures and response algorithms for investigating signals;
determine whether signals correlated with reportable communicable disease or other incidents of public health significance requiring investigation and intervention; and
quantify the staffing resources and time required to
investigate signals.
Methods and Results
Signals Detected and Initial Response
During January 27--October 31, 2003, electronic files containing chief-complaint data from participating hospital
EDs were collected daily (four EDs in January, expanding to six EDs in April and seven in July). On eight occasions, data
transfers were not received from the hospitals but were transmitted the following day, and analyses were performed
retrospectively. During the 277-day study period, 59 statistically significant increases or signals were detected on 57 separate days (two signals occurred on 2 days) in eight different syndrome categories (Table). The number of complaints or visits required to produce
a signal varied by syndrome category. For the sepsis and neurologic categories, the number of complaints required to generate a signal ranged from three to 10. For other syndrome categories (e.g., gastrointestinal illness/diarrhea and fever/influenza), the number of complaints
required to generate a signal ranged from 12 to 20.
Each time a C1, C2, or C3 signal was generated in any of the eight syndrome categories, disease-investigation staff (including an infectious-diseases physician and a nonphysician epidemiologist) reviewed a line listing of the
individual complaints comprising the signal. This line listing contained the absolute number of visits comprising the signal, the chief-complaint text for which the patient was seeking medical
attention, hospital name, patient age, sex, municipality and zip
code of residence, ED visit date, and whether the patient was subsequently discharged from the ED or admitted to the
hospital. The number of complaints resulting in a signal and thus contained in line listings varied by
syndrome(range: 3--103).
Terms Used To Identify and Classify Complaints into Syndrome Categories
By using a system developed by the New York City Department of Health and Mental Hygiene
(2,4), WCDH staff collected data files from hospital EDs containing fields of free text describing the patient's chief complaint. These text fields were searched for specific terms that were then used to classify complaints by syndrome category. For example, terms used
to identify and classify ED visits into a fever/influenza syndrome category included
fever, temp, hot, and
aches, among others. Specific terms were also designated for exclusion from a syndrome category (e.g., chief complaints of nausea or vomiting including the terms pregnant or
pregnancy were excluded from the vomiting syndrome category).
An infectious-diseases physician and a nonphysician epidemiologist compared text terms used to identify and
classify complaints into syndrome categories with the actual text submitted by hospital EDs. Although they were not
systematically quantified, the majority of terms used to identify and classify complaints into syndrome categories and terms used to
exclude complaints from syndrome categories were determined to be correct. For example, the terms
temp and hot correctly identified and classified the majority of complaints into a fever/influenza syndrome category, but such terms as attempted suicide and gunshot were also identified and included in the complaints for a fever/influenza syndrome category because they each contain the text of interest (temp and
hot) within the larger text. Detection of the first 10--15 signals and subsequent
line-listing reviews of complaints comprising these signals indicated that
<3 complaints could result in a signal (C1 or C2, as
described previously) for certain syndrome categories, meaning that incorrect identification of a limited number of complaints
could result in a false-positive signal and trigger additional investigation. During reviews of line listings comprising signals, at least one term that could result in a complaint being classified incorrectly into one of the syndrome categories was identified
in every line listing. Whenever this occurred, the data collection and analysis staff were instructed to exclude such terms to prevent future false-positive signals. Line-listing reviews also indicated that certain EDs recorded chief complaints
by specifying complaints that patients did
not have (e.g., denies shortness of
breath or denies fever). As a result, certain
chief-complaint terms detected by the system did not represent true cases of a particular syndrome. With repeated reviews, the number of complaints incorrectly identified or classified into syndrome categories decreased. On the basis of this limited experience, a standard set of text terms might not be universally applicable for syndromic surveillance systems but
might require modifications based on idiosyncrasies in the text or words used to record chief complaints by individual hospital ED staff.
Investigation of Detected Signals
An algorithm was developed for responding to different types of signals detected by the syndromic surveillance
system (Figure). In addition to determining whether patient visits might have been incorrectly included in a syndrome category in response to a C1, C2, or C3 signal, an infectious-diseases physician and a nonphysician epidemiologist reviewed the
line listing of complaints comprising a signal to determine the need for additional investigation based on any clustering by hospital, patient municipality or zip code of residence, age, or sex, or whether the specific nature of a complaint was reportable in New York State. The complaints comprising a signal
occurred in at least two to three hospitals and municipalities; in
no instances did all of the complaints originate from a single hospital or municipality. To determine the need for
further investigation, staff also assessed complaints for their potential to represent an unusual medical event and examined whether hospital-admission rates were consistent with the medical condition. For example, urosepsis in an elderly resident of a nursing home would be less an indication for further investigation than altered mental status in a young adult requiring hospital admission. Similarly, the percentage of visits requiring hospital admission varied depending on the complaint and
the absolute number of visits. Hospital-admission rates not consistent with the medical condition were also an indication
for further investigation. For example, three or four complaints or ED visits for seizures requiring hospital admission would be less of an indication for further investigation than 70--80 visits for diarrhea, of which 25% required hospital admission. No standard threshold percentage of visits requiring hospital admission could be used to determine the need for
additional investigation; review and clinical judgment were
required to make this assessment.
If the line-listing review identified no obvious cases or clusters of concern or cases potentially representing a reportable or unusual medical event, disease-investigation staff awaited results of the next day's data analysis to determine whether the
signal was sustained and whether investigation was needed. If any cases or clustering of concern were noted, disease investigative staff obtained further information. On the basis of the line-listing review, 29 of the 56 C1 or C2 signals detected by
syndromic
surveillance required further investigation. All C3 signals were investigated further. Follow-up investigation was conducted
by telephone calls to hospital ED physicians,
infection-control practitioners, or treating physicians and by requesting facsimiles
of relevant laboratory and diagnostic tests results or medical records. The information obtained was sufficient to assess
each situation, and no on-site hospital ED visits or chart reviews were conducted.
Because increases in ED visits in a given syndrome category on a single day could result in a C1 or C2 signal but
an increase in ED visits in a given syndrome category on >1 of 3 consecutive days was required to generate a C3 signal, a
C3 signal was believed to have an increased potential for an event of concern. Therefore, in response to the three C3
signals detected, all the investigative procedures described previously were followed, but further investigation was conducted regardless of the results of the line-listing
review. WCDH staff contacted ED and infection-control staff at all 13 hospitals
to notify them that the syndromic surveillance system had
detected an increase in a particular syndrome (e.g.,
gastrointestinal illness/diarrhea) and to ask whether any
increase in the syndrome of interest had been noted during or since the
time encompassed by the most recent complaint data submitted, or whether any concern existed. If hospital ED or
infection-control staff perceived no increases and expressed no concern, they were asked to report any perceived increase in ED visits for the syndrome of concern for the current day, and results of data analysis of complaints for the subsequent day were
reviewed. Hospital staff perceived no increases or need for concern after any of the three C3 signals. Had such increases or concern been perceived, data collection and analysis staff were instructed to request, from all hospital EDs participating in
syndromic surveillance, electronic files containing chief-complaint data encompassing the 12 hours subsequent to the last routine file transfer. None of the three C3 signals warranted
this level of response.
Correlation of Signals with Reportable Communicable Disease or Other
Incidents of Public Health Significance
After the response and investigation of syndromic surveillance signals, no events of concern or that were detected
through other existing surveillance mechanisms were identified. On one occasion a complaint of encephalitis and on 11
occasions complaints of meningitis were noted on line listings comprising a signal. Because all types of meningitis and encephalitis are notifiable diseases in New York State and cases of meningococcal meningitis usually require intervention (e.g.,
postexposure prophylaxis of contacts), these cases were investigated by contacting the treating physician or hospital staff. In all cases, patients had received alternate diagnoses. Because line listings were reviewed only when a signal was detected, persons
with meningitis might have reported to EDs on days on which no signal was detected and therefore would not have been detected through this mechanism. Although other clusters or reportable events were detected through telephone calls from medical providers or affected facilities during the
9-month period, the affected hospitals were not participating in
syndromic surveillance, making correlation impossible. No cases of meningitis or other reportable diseases or events that had not
been detected through otherwise existing surveillance mechanisms (typically telephone notification from hospital ED
staff, infection-control staff, or treating physician, or by a New York State electronic laboratory reporting system) were detected through syndromic surveillance.
Efforts Required for Signal Follow-Up
Nine disease-investigation staff members spent a portion of their time responding to syndromic surveillance signals.
An infectious-disease physician and a communicable-disease epidemiologist routinely reviewed the line listings, and seven public health nurses participated in follow-up investigations as described previously. The time and effort required for these activities varied depending on the number of signals received on a given day (1--2 signals/day) and the number of complaints on
the line listing for each signal requiring additional investigation (range: 1--10 complaints/signal). Staff were asked to track for 1 month the time spent on follow-up. Signal and line-listing reviews typically required approximately 15 minutes and
were performed by a physician and an epidemiologist. Telephone calls to medical providers and reviews of medical records received by facsimile for a single complaint typically required 30 minutes, including the time needed to reach and speak with a knowledgeable hospital staff member or for such staff to obtain relevant information. On average, disease-investigation staff collectively spent approximately 3 hours/week to investigate signals generated by the syndromic surveillance system, not including time required by data collection and analysis staff
(3). Because information obtained through telephone calls
and
review of faxed medical records was sufficient to assess each of these situations, no on-site hospital ED visits or chart reviews were necessary.
Discussion and Conclusions
The information presented in this paper is primarily
descriptive and encompasses only 9 months, during which time
only four to seven of 13 hospital EDs in the county participated in syndromic surveillance. Despite these limitations, the research identified areas that might benefit from further evaluation, and Westchester County's experiences might be useful for others implementing syndromic surveillance.
Complaints identified by text terms developed for use in syndromic surveillance
(5) routinely were incorrectly identified
and classified into syndrome categories of interest. Standardized text terms to identify and classify hospital ED chief
complaints into syndrome categories might not be broadly applicable but might require modification because of hospital idiosyncrasies in recording chief complaints. Assessment of signals by medical or clinical professionals was required to determine the need
for further investigation.
The procedures used to assess and investigate syndromic surveillance signals could be reasonably conducted by using
the resources of a local health department. No reportable or other disease events or events that required further investigation
or intervention in addition to those detected by existing traditional surveillance systems were identified through the
59 syndromic surveillance signals detected and investigated during this 9-month period. Because
<3 complaints were required to generate a signal, a limited number of incorrectly identified complaints could result in a signal and trigger additional investigation.
Further evaluation is required to establish the conditions in which syndromic surveillance is most useful. A jurisdiction
of the size and complexity served by WCDH might represent the smaller end of the spectrum in which such systems are likely
to be useful, and the disease events that occurred were not the type of events intended to be detected by syndromic surveillance.
Finally, the implementation of this system and investigation of detected signals provided additional
benefits. Communications, working relationships, and personal familiarity among WCDH and hospital ED staff improved. ED
staff awareness that WCDH staff were available 24 hours/day, 7 days/week as a resource increased. Physicians and hospital staff expressed appreciation for feedback provided by WCDH
regarding potential disease activity of concern. A substantial
number of the reportable or unusual events that occurred during the 9-month study period were detected through telephone calls from ED staff. This fact underscores the importance to disease surveillance of communication with local ED staff and indicates that syndromic surveillance should complement and not replace traditional reporting and surveillance systems. The
system provided baseline and timely objective data for hospital visits and might provide a basis for future monitoring of other conditions of interest.
References
Hutwagner L, Thompson W, Seeman GM, Treadwell T. The bioterrorism preparedness and response Early Aberration Reporting System
(EARS). J Urban Health 2003;80(2 Suppl 1):i89--96.
Das D, Weiss D, Mostashari F, et al. Enhanced drop-in syndromic surveillance in New York City following September 11, 2001. J Urban Health 2003;80(2 Suppl 1):i76--88.
Cho S, Hackmyer S, Li J, et al. Establishing an automated surveillance system [Abstract]. MMWR 2004;53(Suppl):232.
Mostashari F, Fine A, Das D, Adams J, Layton M. Use of ambulance dispatch data as an early warning system for community-wide influenza like illness, New York City. J Urban Health 2003;80(2 Suppl 1):i43--9.
Use of trade names and commercial sources is for identification only and does not imply endorsement by the U.S. Department of
Health and Human Services.References to non-CDC sites on the Internet are
provided as a service to MMWR readers and do not constitute or imply
endorsement of these organizations or their programs by CDC or the U.S.
Department of Health and Human Services. CDC is not responsible for the content
of pages found at these sites. URL addresses listed in MMWR were current as of
the date of publication.
Disclaimer
All MMWR HTML versions of articles are electronic conversions from ASCII text
into HTML. This conversion may have resulted in character translation or format errors in the HTML version.
Users should not rely on this HTML document, but are referred to the electronic PDF version and/or
the original MMWR paper copy for the official text, figures, and tables.
An original paper copy of this issue can be obtained from the Superintendent of Documents,
U.S. Government Printing Office (GPO), Washington, DC 20402-9371; telephone: (202) 512-1800.
Contact GPO for current prices.
**Questions or messages regarding errors in formatting should be addressed to
mmwrq@cdc.gov.