Persons using assistive technology might not be able to fully access information in this file. For assistance, please send e-mail to: mmwrq@cdc.gov. Type 508 Accommodation and the title of the report in the subject line of e-mail.
Assisted Reproductive Technology Surveillance --- United States, 2006
Abstract
Problem/Condition: Assisted Reproductive Technology (ART) includes fertility treatments in which both eggs and sperm are handled in the laboratory (i.e., in vitro fertilization and related procedures).Patients who undergo ART procedures are more likely to deliver multiple-birth infants than women who conceive naturally. Multiple births are associated with increased risk for mothers and infants (e.g., pregnancy complications, premature delivery, low-birthweight infants, and long-term disability among infants). This report presents the most recent national data and state-specific results.
Reporting Period Covered: 2006.
Description of System: In 1996, CDC initiated data collection regarding ART procedures performed in the United States, as mandated by the Fertility Clinic Success Rate and Certification Act of 1992 (FCSRCA) (Public Law 102-493 [October 24, 1992]). Beginning with 2004, CDC has contracted with Westat, Inc., a statistical survey research organization, to obtain data from ART medical centers in the United States. Westat, Inc., maintains the National ART Surveillance System (NASS), CDC's web-based data collection system.
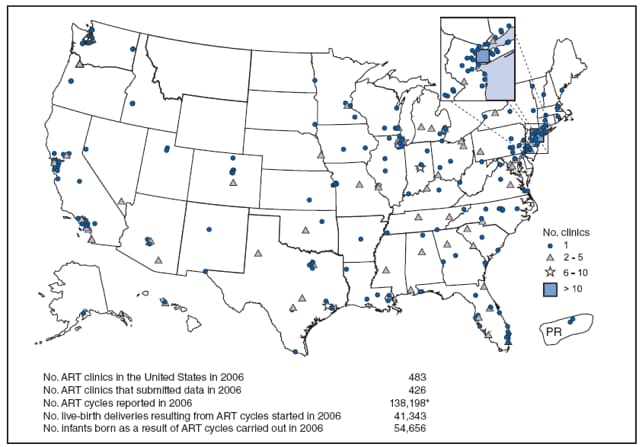
Results: In 2006, a total of 138,198 ART procedures were reported to CDC. These procedures resulted in 41,343 live-birth deliveries, and 54,656 infants. ART procedures are categorized into four major procedure types: procedures that used embryos from freshly fertilized eggs (fresh embryos) from the patient's eggs (72%); procedures that used thawed embryos from the patient's eggs (16%); procedures that used fresh embryos from donor eggs (8%); and procedures that used thawed embryos from donor eggs (4%). Overall, 44% of ART transfer procedures resulted in a pregnancy, and 36% in a live-birth delivery (delivery of one or more live-born infants). Live-birth rates were generally higher among ART procedures that used fresh embryos from donor eggs (54%) than among other types. The highest numbers of ART procedures were performed among residents of California (18,886); New York (13,259); Illinois (9,594); New Jersey (9,237); and Massachusetts (8,305). All five states reported the highest number of live-birth deliveries as a result of ART. Of 54,656 infants born through ART, 48% were multiple-birth deliveries. The risk for a multiple-birth delivery was highest for women who underwent ART transfer procedures that used fresh embryos from either donor eggs (39%) or their own eggs (31%). Approximately 1% of U.S. infants born in 2006 were conceived through ART. Those infants accounted for 18% of multiple births nationwide. Approximately 9% of ART singletons, 57% of ART twins, and 96% of ART triplets or higher-order multiples were low birthweight. Similarly, 14% of ART singletons, 65% of ART twins, and 97% of ART triplets or higher-order multiples were born preterm.
Interpretation: Whether an ART procedure resulted in a pregnancy and live-birth delivery varied, according to different patient and treatment factors. ART poses a major risk for multiple births associated with adverse maternal and infant outcomes (e.g., placenta previa, preterm delivery, cesarean delivery, low birthweight, and infant mortality). This risk varied according to the patient's age, the type of ART procedure performed, the number of embryos available for transfer to the uterus, the number transferred, and the day of transfer (day 3 or 5).
Public Health Actions: ART-related multiple births represent a sizable proportion of all multiple births nationwide and in selected states. To minimize the adverse maternal and child health effects associated with multiple pregnancies, ongoing efforts to limit the number of embryos transferred in each ART procedure should be continued and strengthened. Adverse maternal and infant outcomes (e.g., low birthweight and preterm delivery) associated with ART treatment choices should be explained thoroughly when counseling patients considering ART.
Introduction
Since 1978, assisted reproductive technology (ART) procedures have been used to overcome infertility. The procedures include those infertility treatments in which both eggs and sperm are handled in the laboratory to establish a pregnancy (i.e., in vitro fertilization [IVF] and related procedures). Since the birth of the first U.S. infant conceived with ART in 1981, use of these treatments has increased dramatically. The number of medical centers providing ART services and procedures performed annually in the United States have steadily increased (1).
In 1992, Congress passed the Fertility Clinic Success Rate and Certification Act (FCSRCA),* which requires each medical center in the United States that performs ART procedures to report data to CDC annually on every ART procedure initiated. CDC uses the data to report medical center specific pregnancy success rates. In 1997, CDC published the first annual ART Success Rates Report under this mandate (2). The report was based on ART procedures performed in 1995. Since then, CDC has continued to publish the ART Success Rates Report annually. The report contains a national summary and details each medical center's success rates. CDC also has used this surveillance data file to perform more in-depth analyses of infant outcomes (e.g., multiple births) (3--10). Multiple-infant births are associated with greater health problems for mothers and infants, including higher rates of caesarean deliveries, prematurity, low birthweight, and infant death and disability (11,12). In the United States, ART has been associated with a substantial risk for multiple gestation pregnancy and multiple birth (3--10). In addition to the multiple-birth risks, certain studies suggest an increased risk for low birthweight among singleton infants conceived through ART (13,14). This report is based on ART surveillance data provided to CDC's National Center for Chronic Disease Prevention and Health Promotion, Division of Reproductive Health, regarding procedures performed in 2006. A report of these data, according to the medical center where the procedure was performed, was published separately (1). In this report, emphasis is placed on presenting state-specific and more detailed data regarding risks associated with ART (e.g., multiple birth, low birthweight, and preterm delivery).
Methods
CDC contracted with Westat, Inc., to collect data on ART procedures performed in 2006 from medical centers in the United States and its territories. Data collected include patient demographics, medical history, and infertility diagnoses; clinical information pertaining to the ART procedure; and information regarding resultant pregnancies and births. The data file is organized with one record per ART procedure performed. Multiple procedures from single patients are not linked. Eighty-eight percent of ART medical centers reported their 2006 data (1). The names of nonreporting programs were published as prescribed by the FCSRCA.
ART data and outcomes from ART procedures are presented by the patient's state of residence at time of treatment. If the patient's state of residency was missing, the state of residency was assigned as the state where the procedure was performed. In addition, data regarding the number of ART procedures in relation to the total population for each state are indicated.† Data regarding number of procedures also are presented by procedure type and stage of procedure. ART procedures are classified into four types based on the source of the egg (patient or donor) and the status of the embryos (freshly fertilized or thawed): fresh embryo from the patient's eggs or fresh embryos from donor eggs (fresh embryo cycles), or thawed embryos from the patient's eggs, and thawed embryos from donor eggs (thawed embryo cycles). Because live-birth rates and multiple-birth risk vary substantially among these four procedure groups, data are presented separately for each type.
Within a given procedure, different stages of treatment exist. A typical ART procedure begins when a woman starts taking drugs to stimulate egg production or her ovaries are monitored with the intent of transferring embryos to her uterus. If eggs are produced, the procedure progresses to the egg retrieval stage. After the eggs are retrieved, they are combined with sperm in the laboratory (in vitro fertilization [IVF]). If IVF is successful, the most viable embryos are selected for transfer. If an embryo implants in the uterus, a clinical pregnancy is diagnosed by the presence of a gestational sac detectable by ultrasound. Depending on the age of the mother, 13%--55% of clinical pregnancies are lost at a later point, mostly during the first 12 weeks (16). Beyond 12 weeks of gestation, the pregnancy usually progresses to a live-birth delivery, which is defined as the delivery of one or more live-born infants. Only ART procedures involving fresh embryos include an egg-retrieval stage. ART procedures that use thawed embryos do not include egg retrieval because the eggs were fertilized during a previous procedure, and the resulting embryos were frozen until the current procedure. An ART procedure can be discontinued at any step for medical reasons or by patient choice.
While a single measure of success is not sufficient to evaluate ART efficacy, this report presents four outcome measures of success: pregnancy, birth of one or more live-born (the delivery of multiple infants is counted as one live birth), birth of a singleton live-born infant, and birth of two or more infants (multiple birth), at least one of which was live-born. The reported pregnancies were all diagnosed through the detection of a gestational sac by ultrasound. Because the ART surveillance system collects information on deliveries, it can identify deliveries in which stillborn fetuses were delivered together with live-born infants. A delivery of a live-born infant with one or more stillbirths is classified as a multiple birth, according to the definitions provided above. The National Center for Health Statistics uses similar definitions but bases its statistics only on the live birth records. National statistics classify the delivery of a single live-born infant with one or more stillbirths as a singleton birth. Sensitivity analyses were performed on ART data excluding information on stillbirths and did not yield results substantially different from those presented in this report.
Success rates are typically computed based on all cycles initiated (per-cycles success rates), and the annual ART Success Rates Report emphasizes per-cycle live birth rates as the primary measures of outcome. This report presents data on all cycles initiated (Tables 1--2); however, most analyses are based on cycles in which embryos were obtained and transferred. This method is necessary to compare outcomes among the four major procedure types (thawed embryo cycles are by definition cycles that progressed to the transfer stage).
In addition to the overall live-birth rate, the report presents a second measure of success based on the delivery of a live singleton. Singleton live births are a key measure of ART success because they carry a much lower risk than multiple-infant births for adverse health outcomes, including prematurity, low birthweight, disability, and death.
This report addresses multiple birth as a separate outcome measure. First, each multiple-birth delivery is evaluated as a single event, defined as the delivery of two or more infants, at least one of which was live-born. The multiple-birth risk was calculated as the proportion of multiple-birth deliveries among total live-birth deliveries. In additional analyses, each multiple-birth infant was considered separately to compute the proportion of all infants born from multiple deliveries and the proportion of all live-born infants who were multiples.§ Each measure represents a different focus. The multiple-birth risk, which is based on the number of deliveries or infant sets, provides an estimate of the risk for multiple births posed by ART to the woman. The proportion of infants born in a multiple-birth delivery provides a measure of the impact of ART procedures on children in the population. The report presents both measures by type of ART procedure and by maternal age for births conceived with the patient's eggs, and provides details on the multiple-birth risk by patient's age, number of embryos transferred, and whether additional embryos were available and frozen for future use. Embryo availability (an indicator of embryo quality) is an independent predictor of the number of embryos transferred (3,6). The report also presents the multiple-birth risk for embryos cultured through day 3 and day 5 by patient's age, number of embryos transferred, and whether additional embryos were available and frozen for future use. The proportion of infants born in a multiple-birth delivery is presented separately by patient's state of residency during ART treatment.
A typical ART procedure includes IVF of gametes, culture of the embryos for ≥2 days, and embryo transfer into the uterus (i.e., transcervical embryo transfer). However, in certain cases, unfertilized gametes (eggs and sperm) or zygotes (early embryos [i.e., a cell that results from fertilization of the egg by a sperm]) are transferred into the fallopian tubes within 1--2 days of retrieval. These are known as gamete and zygote intrafallopian transfer (GIFT and ZIFT). Another variation is intracytoplasmic sperm injection (ICSI), in which IVF is accomplished by selection of a single sperm that is injected directly into the egg. This technique was developed originally for couples with male factor infertility but now is commonly used for many diagnostic groups.
This report presents data for each of the four procedure types: fresh embryos from the patient's eggs, fresh embryos from donor eggs, thawed embryos from the patient's eggs, and thawed embryos from donor eggs. In addition, it provides detailed data for the most common procedure type, those that use fresh embryos from the patient's eggs. These procedures account for approximately 70% of ART procedures performed each year. For procedures that progressed to the embryo-transfer stage, the report presents the percentage distribution of selected patient and treatment factors and the success rates (defined as live-birth deliveries per ART-transfer procedure), according to the same patient and treatment characteristics.
Patient factors included the age of the woman undergoing ART, whether she had previously given birth, the number of previous ART attempts, and the infertility diagnosis of female and male partners. The patient's age at the time of the ART procedure was grouped into five age groups: age <35 years, 35--37 years, 38--40 years, 41--42 years, and >42 years. Infertility diagnoses ranged from one factor in one partner to multiple factors in one or both partners. They include:
- tubal factor --- the woman's fallopian tubes are blocked or damaged, causing difficulty for the egg to be fertilized or for an embryo to travel to the uterus;
- ovulatory dysfunction --- the ovaries are not producing eggs normally; dysfunctions include polycystic ovarian syndrome and multiple ovarian cysts;
- diminished ovarian reserve --- the ability of the ovary to produce eggs is reduced; reasons include congenital, medical, or surgical causes or advanced age;
- endometriosis --- involves the presence of tissue similar to the uterine lining in abnormal locations; this condition can affect egg fertilization and embryo implantation;
- uterine factor --- a structural or functional disorder of the uterus that results in reduced fertility;
- male factor --- a low sperm count or problems with sperm function that cause difficulty for a sperm to fertilize an egg under normal conditions;
- other causes of infertility --- immunologic problems or chromosomal abnormalities, cancer chemotherapy, or serious illnesses;
- unexplained cause --- no cause of infertility was detected in either partner;
- multiple factors, female --- diagnosis of one or more female cause; or
- multiple factors, male and female --- diagnosis of one or more female cause, and male factor infertility.
Treatment factors included:
- the number of days the embryo was cultured;
- the number of embryos transferred;
- whether the procedure was IVF-transfer only, IVF with ICSI, GIFT, ZIFT, or a combination of IVF with or without ICSI and either GIFT or ZIFT;
- whether extra embryos were available and frozen; and
- whether a gestational carrier (i.e., surrogate) received the transferred embryos with the expectation of gestating the pregnancy.
The number of embryos transferred in an ART procedure was categorized as 1, 2, 3, 4, or ≥5. The number of days of embryo culture was calculated using dates of egg retrieval and embryo transfer and was categorized as 1, 2, 3, 4, 5, 6 or ≥7. Because of limited sample sizes, live-birth rates are presented only for the two most common days, day 3 and day 5. For the same reason, live-birth rates are presented for IVF with and without ICSI and not for GIFT and ZIFT. ICSI was subdivided as to whether it was used among couples receiving a diagnosis involving male factor (the original indication for ICSI treatment) or not.
Chi-square tests evaluated the significance of differences in live-birth rates by select patient and treatment factors within each age group. Multivariable logistic regression models evaluated the independent effects of patient factors (diagnosis, number of previous ART procedures, and number of previous births) influencing the chances of having a live birth as a result of an ART procedure. Because patient age is a strong predictor for live birth, separate models were constructed for each age group. Those models provide an indication of the variability in live-birth rates based on patient factors separately for each age category. For these analyses, the referent groups included patients with a tubal factor diagnosis, no previous ART procedures, and no previous births. Multivariable models did not include treatment factors because of multicollinearity between certain treatment factors and multiple potential effect modifications. Detailed stratified analyses were performed to elucidate additional details related to associations among different treatment factors and the live-birth rate.
Additional analyses evaluated the impact of ART procedures on total births in the United States in 2006. Because the goal of the analysis was to assess the effect of ART on the 2006 U.S. birth cohort and the ART surveillance system is organized according to the date of the ART procedure rather than the infant's date of birth, these analyses employed data drawn from two different ART reporting years. They covered: 1) infants conceived from ART procedures performed in 2005 and born in 2006 (approximately two thirds of the live-birth deliveries reported to the ART surveillance system for 2006); and 2) infants conceived from ART procedures performed in 2006 and born in 2006 (approximately one third of the live-birth deliveries reported to the ART surveillance system for 2006). The U.S. natality files from CDC's National Center for Heath Statistics provided data on the total number of live births and multiple births registered in the United States in 2006 (17). The report presents the results of these analyses by plurality of birth.
Additional analyses addressed adverse infant health outcomes, including low birthweight, very low birthweight, and preterm delivery. Because ART providers do not provide continued prenatal care after a pregnancy is established, birthweight and date of birth were collected via active follow-up with ART patients (85%) or their obstetric providers (15%). Although ART clinic staff collects limited information on infant outcomes, maternal health outcomes are not investigated systematically. Low birthweight and very low birthweight were defined as <2,500 grams and <1,500 grams, respectively. The exact gestational age was estimated as date of birth minus date of egg retrieval (and fertilization). If the date of retrieval was missing, and for procedures that used thawed embryos, gestational age was estimated as date of birth minus date of embryo transfer. For comparability with the general population, where gestational age is based on the date of the last menstrual period (LMP), the exact gestational age estimate was adjusted by adding 14 days. Preterm delivery was defined as gestational age <37 weeks. Preterm low birthweight was defined as gestational age <37 weeks and birthweight <2,500 grams. Term low birthweight was defined as gestational age ≥37 weeks and birthweight <2,500 grams. The rates for low birthweight, very low birthweight, preterm, preterm low birthweight, preterm very low birthweight, term low birthweight, and term very low birthweight among ART infants born in 2006 are presented by plurality of birth. In addition, data for each of the seven outcomes are presented for ART singletons born in 2006 by type of procedure. For the most common procedure type, those using fresh embryos from the patient's eggs, the rates for each outcome also are presented according to maternal age and number of previous live births. Chi-square tests evaluated the significance of differences in these five outcomes by type of ART procedure, maternal age, and number of previous births. All analyses were performed using the SAS(r) software system (18).
Results
Of 483 medical centers in the United States and surrounding territories that performed ART procedures in 2006, a total of 426 (88%) provided data to CDC (Figure 1). The majority of medical centers that performed ART procedures were in the eastern United States, in or near major cities. The number of medical centers performing ART procedures varied by state. States with the largest number of ART medical centers reporting data for 2006 were California (63), New York (34), Texas (30), Illinois (28), Florida (27), and New Jersey (22). Two states (Montana and Wyoming) and three U.S. territories (Guam, the Federated States of Micronesia, and the U.S. Virgin Islands) had no ART medical centers performing ART procedures.
Number and Type of ART Procedures
In 2006, a total of 138,198 ART procedures were reported to CDC (Table 1). This number excludes 69 ART procedures (<0.05%) performed in 2006 that involved the evaluation of a new treatment procedure. The largest number of ART procedures occurred among patients who used their own fresh embryos (99,199 [72%]). Of the 138,198 procedures started, 115,875 (84%) progressed to embryo transfer. Overall, 44% of ART procedures that progressed to the transfer stage resulted in a pregnancy, 36% in a live-birth delivery; 25% in a singleton live birth, and 11% in a multiple birth live birth. Pregnancy and live-birth rates varied according to type of ART. ART procedures that used donor eggs and fresh embryos had the highest success rates (63% pregnancy rate, 54% live-birth rate, and 33% singleton live-birth rate), but also the highest multiple delivery rate (21%). Procedures using the patient's eggs from thawed embryos had the lowest (37% pregnancy rate, 29% live-birth rate, 22% singleton live-birth rate, and 7.0 % multiple live-birth rate).
The 41,343 live-birth deliveries from ART procedures performed in 2006 resulted in 54,656 infants (Table 1). The number of infants born was higher than the number of live-birth deliveries because of multiple-infant births. ART contributed to the birth of 28,689 singleton infants. The largest proportion of infants born (37,610 or 69%) resulted from ART procedures in which patients used fresh embryos from their own eggs. A total of 9,770 infants were born from ART procedures using fresh and thawed donor eggs. This corresponds to 18% of all infants born in 2006.
The two states that had the most ART medical centers (California and New York) also had the highest numbers of ART procedures performed (Table 2). The largest numbers of ART procedures performed in 2006 were among residents of California (18,886), New York (13,259), Illinois (9,594), New Jersey (9,237), and Massachusetts (8,305). The five states with the largest number of ART procedures performed also ranked highest for numbers of live-birth deliveries as a result of ART. ART procedures were performed for residents of certain states and territories without an ART medical center (Montana, Guam, Federated States of Micronesia, U.S. Virgin Islands, and Wyoming). However, each accounted for a limited percentage (<0.1%) of total ART usage in the United States. Non-U.S. residents accounted for 1% of ART procedures, live-birth deliveries, and infants born.
The number of ART procedures per million population ranged from 68 in Puerto Rico to 1,291 in Massachusetts, with an overall average of 463 ART procedures started per million persons. In addition, the number of ART procedures performed per million women in the reproductive age group (15--44 years) is reported in each state. This ratio approximates the proportion of women of reproductive age who used ART in each state. However, some women who used ART might fall outside the age range of 15--44 years, and some women might have had more than one procedure during 2006. The number of ART procedures per million women in the reproductive age group (15--44 years) varied from 314 in Puerto Rico to 6,080 in Massachusetts, with an overall average of 2,198 per million women in that age group. The two ratios, the number of ART procedures per million population and the number of ART procedures per million women in reproductive age group, were highly correlated (Spearman's rank correlation = 0.99).
Characteristics of Patients and ART Treatments Among Women Who Used Fresh Embryos from Their Own Eggs
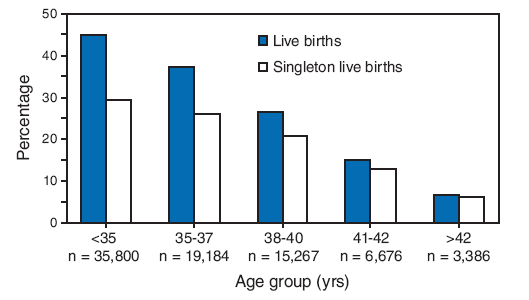
Forty-five percent of ART transfer procedures that used fresh embryos from the patient's eggs were performed on women aged <35 years, 24% on those aged 35--37 years, 19% on those aged 38--40 years, 8% on those aged 41--42 years, and 4% on women aged >42 years. Patient and treatment characteristics of these women varied by age (Table 3). Tubal factor and male factor infertility were reported more commonly among women aged ≤40 years who underwent ART procedures compared with women aged >40 years. In contrast, among women who underwent ART, diminished ovarian reserve, was reported for only 2% of women aged <35 years, for 22% of women aged 41--42 years, and 32% of women aged >42 years. Unexplained infertility was reported in 7%--14% of women who underwent ART transfer procedures, multiple female factors in 9%--16%, and both male and female factors in 18%--19%.
Approximately 66% of ART procedures among women aged <35 years were reported as the first for that patient. Only 42% of procedures among women aged >42 years were reported as the first procedure for that patient. The percentage of ART procedures among women who had undergone at least one previous procedure increased with age. The percentage of procedures performed in a woman who had had a previous birth¶ also increased with age, from 22% in women aged <35 years to 37% in the oldest age group.
The majority of ART procedures used IVF, and <1% used GIFT or ZIFT. Use of ICSI was common among couples with or without a diagnosis of male factor infertility, and varied by patient age. Despite variation among all age groups, the total proportion of procedures using ICSI was greater than the proportion of IVF without ICSI. The majority of procedures included embryo culture for three days; the next most common procedure involved embryo culture to day 5. Culture to day 5 often coincides with development of the embryo to the blastocyst stage. This technique was performed more frequently among younger women, possibly because ART procedures performed in younger women yielded more embryos that can survive in culture through day 5.
Most ART procedures involved transfer of more than one embryo. Among women aged <35 years, 91% of procedures involved the transfer of two or more embryos, and 29% involved transfer of three or more. For women aged >42 years, 80% involved transfer of two or more embryos, and 60% involved transfer of three or more. The availability of extra embryos (an indicator of overall embryo quality) decreased sharply with age. Extra embryos were available and frozen for 46% of procedures among women aged <35 years; 5% of procedures among women aged >42 years yielded extra embryos that were frozen. Data were unavailable for extra embryos that were not frozen for future use. Overall, 1% of ART transfer procedures used a gestational carrier (i.e., surrogate).
Live-Birth Rates Among Women Who Used Fresh Embryos from Their Own Eggs
Live-birth rates for women who underwent ART procedures that used fresh embryos from their own eggs also varied by patient age and selected patient and treatment factors (Table 4). Although the average live-birth rate was 35%, it sharply declined with age, from 45% among women aged <35 years to 7% among women aged >42 years. Success rates varied significantly across diagnostic categories among all age groups, except in women aged >42 years. Live-birth rates were higher than the age-specific average rate for several diagnostic factors. For example, among women aged <35 years who underwent ART, live-birth rates were higher for those whose diagnosis was ovulatory dysfunction or male factor infertility compared to the age-specific average. Live-birth rates were also higher than the age-specific average rate among women aged >42 years with an infertility diagnosis of uterine or male factor, or unexplained causes. Live-birth rates were lower than average for procedures among women aged >42 years with an infertility diagnosis of tubal factor, ovulatory dysfunction, endometriosis, multiple factors, female only or other causes. Live-birth rates were higher for procedures in women aged ≤42 years who had undergone no previous ART procedures, but this difference was statistically significant only for procedures in women aged <40 years. Live-birth rates were higher for procedures in women who had one or more previous births than for procedures in women with no previous births. However, this difference was not statistically significant for procedures in women aged >42 years.
Live-births were rated higher for ART procedures that used IVF-ET without ICSI, in comparison with procedures that used ICSI, regardless of whether male factor infertility was reported, except in women aged >42 who were diagnosed with male factor (Table 4). In all age groups, live-birth rates were lowest for procedures in couples who used ICSI in the absence of male factor infertility. These differences were statistically significant for women in all age groups with the exception of women aged 41--42 years.
In all age groups, live-birth rates were higher than average for procedures among women who had extended embryo culture to day 5, transferred two or more embryos, and had extra embryos available and frozen for future use. Variations in live-birth rates were statistically significant for these treatment factors within all age groups, with the exception of the number of days of embryo culture among women aged >42 years. Live-birth rates increased in all age groups when a gestational carrier was used. However, these results did not achieve statistical significance in any age group.
The use of ICSI in the absence of male factor infertility in women considered difficult to treat was evaluated separately. These groups included women who underwent previous ART cycles but had no previous pregnancies or births, women diagnosed with diminished ovarian reserve, and ones with fewer than five eggs retrieved. Within each of these groups, age-specific--live-birth rates for IVF-ET with and without ICSI were examined. In all but four cases, women who used IVF with ICSI had lower live-birth rates than women who used IVF without ICSI. The four exceptions were: 1) women aged <35 years who had previous ART cycles but no previous pregnancies or births; 2) women aged >42 years who had previous ART cycles but no previous pregnancies or births; 3) women aged 41--42 years with fewer than five eggs retrieved; and 4) women aged 41--42 years with diminished ovarian reserve. However, in all other cases, the pattern of these results is consistent with the findings presented in this report (Table 4). Additional analyses also fail to support a clear advantage in using ICSI when treating couples with no indication of male factor infertility. After adjusting for female prognosis factors and types of IVF procedures, cycles using ICSI with no indication of male-factor infertility were less likely to fail before transfer but more likely to result in implantation failure, pregnancy loss, and a lower overall chance of a live birth delivery. ICSI effects on the next cycle were slightly improved but not better than those without using ICSI.
Additional analyses suggest that success rates from blastocyst transfers could be overestimated, especially for women aged >40 years, because cycles terminated before a transfer are not considered in the evaluation, and because a large proportion of embryos fail to survive to day 5. Finally, the results of analyses stratified by patient age, number of embryos transferred, day of embryo transfer (day 3 or 5), and number of embryos available simultaneously are included with the discussion regarding multiple-birth risk.
Total live-birth rates were compared with singleton live-birth rates for procedures employing fresh embryos from the patient's own eggs (Figure 2). Live-birth and singleton live-birth rates decreased with patient age. Across all age groups, singleton live-birth rates were lower than live-birth rates. However, the magnitude of the difference between both measures declined with patient age.
Live-Birth Rates among Women Who Used Fresh Donor Eggs or Thawed Donor Eggs or Embryos
The average live-birth delivery rate among women who underwent ART-transfer procedures using donor eggs was 46.1% (Table 5). In contrast with the sharp age-dependent decline in live-birth rates observed for ART procedures using the patients' own fresh embryos, live-birth delivery rates did not vary substantially with the age of the patient or the intended mother when donor eggs were used. In 2006, a total of 10,984 ART procedures were performed using fresh donor eggs. Of these, 10,049 ART procedures (91.5%) progressed to an embryo transfer. The live-birth delivery rate for women who used fresh donor eggs varied only slightly from 54.4% among women aged <35 years to 53.2% among women aged >42 years. The highest live-birth delivery rates of 55.2% occurred among women aged 38--40 years, and the lowest delivery rate of 52.4 % occurred among women aged 40--42. The total number of ART procedures performed that used thawed donor eggs or embryos was 5,992, of which 5,456 ART procedures (91.1%) progressed to a transfer. Live-birth delivery rates were lower for procedures using thawed donor eggs or embryos compared to those using fresh donor eggs in all age groups, declining slightly with the age of the intended mother from 34.9% among women aged <35 years to 31.1% aged >42 years.
Multiple-Birth Risks Associated with ART
Of 12,654 multiple-birth deliveries, 8,722 (69%) were from pregnancies conceived with fresh embryos from the patient's eggs, 1,402 (11.1%) were from thawed embryos from the patient's eggs, 2,107 (16.7%) were from fresh embryos from a donor's eggs, and 423 (3%) were from thawed embryos from a donor's eggs (Table 6). Compared with ART procedures that used the patient's eggs and fresh embryos, the risks for multiple-birth delivery were increased when eggs from a donor were used and decreased when thawed embryos were used. Among ART procedures in which fresh embryos from the patient's own eggs were used, a strong inverse relation existed between multiple-birth risk and patient age. The average multiple-birth risk for ART procedures in which fresh embryos from the patient's eggs were used was 31%. The multiple-birth risk varied from 34% among women aged <35 years to 9% among those aged >42 years.
Of 54,656 infants born through ART, 48% (25,967) were born in multiple-birth deliveries (Table 6). The proportion of infants born in a multiple-birth delivery also varied by type of ART procedure and patient age. Among ART transfer procedures in which the patient used fresh embryos from their own eggs, the proportion of infants born in a multiple-birth delivery ranged from 52% among women aged <35 years to 18% among women aged >42 years. Among ART transfer procedures in which thawed embryos from the patient's eggs were used, the proportion of infants born in a multiple-birth delivery ranged from 42% in women aged <35 years to 32% aged >42 years. When thawed embryos from donor eggs were used, the proportion of infants born in a multiple-birth delivery was 40%. The proportion of infants born in a multiple-birth delivery was highest (57%) in women who used fresh embryos from donor eggs.
A more detailed examination of multiple-birth risk for ART procedures employing fresh embryos from the patient's own eggs indicated that the number of embryos transferred was a key risk factor for multiple-birth delivery, but that the magnitude of the association varied by patient age (Table 7). Among all age groups, transfer of two or more embryos was associated with increased live-birth delivery rates. However, the multiple-birth risk also increased substantially. Among women aged ≤42 years, the percentage of twin deliveries and the percentage of triplet or higher-order deliveries increased with higher numbers of embryos transferred. This trend was not apparent for procedures in women aged >42 years among whom singleton births increased when more than one embryo was transferred. Women in these age groups have embryos with reduced implantation potential and therefore are less likely to have multiple births when multiple embryos are transferred.
Additional analyses addressed multiple-birth risk among patients who used fresh embryos from their own eggs and set aside extra embryos for future use (Table 7). These patients can be thought of as those with elective embryo transfer because they chose to transfer fewer embryos than the total number that were available. For procedures in women with elective embryo transfer who were aged <35 years, live-birth rates were 49% when only one embryo was transferred and 55% when two embryos were transferred. The higher live-birth rate after transfer of two embryos was associated with a large increase in the multiple-birth risk (38% compared with 1% after single embryo transfer). For procedures in women aged 35--37 years, live-birth rates were 41% with elective embryo transfer of a single embryo and 48% when two embryos were transferred. In the younger age category, the higher live-birth rate after transfer of two embryos was associated with a large increase in the multiple-birth risk (33% compared with 2% after single embryo transfer).**
Among patients who used fresh embryos from their own eggs, the live-birth rates and multiple-birth risks typically were higher for embryo transfers on day 5 than on day 3 (Table 8). Overall, across all age groups, fewer embryos were transferred on day 5 than on day 3. For example, among women aged <35 years, two or fewer embryos were transferred in 87% of day 5 transfers and in 62% of day 3 transfers. Similarly, in women aged <35 years, 93% of day 5 elective transfers and 73% of day 3 elective transfers involved the transfer of two or fewer embryos. Live-birth rates and multiple-birth risks were higher for patients who had elective embryo transfers. For women aged <35 years who had elective embryo transfer on day 5, the percentage of transfers resulting in live births was 53% when one embryo was transferred, and 59% when two embryos were transferred. By contrast, the multiple-birth risks in these two groups were 2% and 44%, respectively. Thus, the 6% higher live-birth rate associated with the transfer of two embryos was accompanied by a 42% higher risk of multiple delivery. If success is measured in terms of singleton live-birth, the highest success rates for this group were with one embryo transferred. This also was true for women aged 35--37 years with elective single embryo transfers on day 5 (Table 8).
The states with the highest number of ART-associated live-birth deliveries also had the highest number of infants born in multiple-birth deliveries (Table 9). These include California (3,553), New York (1,959), New Jersey (1,811), Texas (1,554), Illinois (1,505), Florida (1,225), and Massachusetts (1,212). Nationwide, the percentage of ART-born infants who were born in multiple-birth deliveries was 48%; the percentage of twins was 43%, triplets or higher-order multiples was 4%. The percentage of ART-born infants in multiple-birth deliveries was ≥50% in many states. The states with the highest proportion of ART-born infants in multiple-birth deliveries were Wyoming (64%), Maine (62%), Arkansas (59%), New Mexico (57%), Oregon (55%), North Dakota (55%), Nevada (53%), Louisiana (53%), and Montana (51%). These findings should be interpreted with caution because of an overall low number of live births resulting from ART in certain states.
Of 4,265,555 infants born in the United States in 2006, a total of 52,792 (1%) were conceived with ART (Table 10). Infants conceived with ART accounted for 0.7% of singleton births and 18% of multiple births nationwide; 17% of all twins and 38% of infants born in triplets or higher-order multiples were conceived with ART.
Perinatal Risks Associated with ART
The percentage of infants with low birthweight varied from 9% among singletons to 96% for triplets or higher-order multiples. The percentages of very low birthweight, preterm, preterm low birthweight, and preterm very low birthweight displayed similar patterns (Table 11).
The percentages of ART singletons that were low birthweight and preterm varied by procedure type and selected maternal factors (Table 12). The variation in risk across procedure types was statistically significant for six perinatal outcomes: low birthweight, very low birthweight, preterm, preterm low, preterm very low, and term low birthweight. In comparison with singletons born after procedures that used fresh embryos derived from the patients' eggs, singletons born after procedures that used fresh embryos derived from donor eggs were at increased risk for five perinatal outcomes: low birthweight, very low birthweight, preterm delivery, preterm low birthweight, and preterm very low birthweight. Singletons born after procedures that used thawed embryos were at decreased risk for low birthweight, very low birthweight, preterm low, preterm very low birthweight, and term low birthweight; however, they were at increased risk for preterm delivery as compared to singletons born after procedures that used fresh embryos derived from the patients'eggs.
More detailed analysis of maternal factors among singletons born after procedures that used fresh embryos derived from the patients' eggs indicated higher risks of low birthweight, very low birthweight, preterm delivery, preterm low birthweight, and preterm very low birth weight for women aged >42 years. These differences in risks were not statistically significant. Mothers with no previous births had a higher risk for low birthweight, preterm low birthweight, and term low birthweight than those who had one or more previous births. The variation in risks was statistically significant (p<0.01) for these three outcomes.
Discussion
According to the most recent estimates of infertility in the United States, 10% of women of reproductive age (15--44 years) reported a previous infertility-associated health-care visit, and 2% reported a visit during the previous year (19). Among married couples in which the woman was of reproductive age, 7% reported they had not conceived after 12 months of unprotected intercourse. With advances in ART, couples are increasingly using this form of treatment to overcome their infertility.
Since the birth of the first infant through ART in the United States in 1981, use of ART has grown substantially and has consistently increased in the United States since 1996, when CDC began ART surveillance. The increased use of ART, coupled with higher ART success rates, has resulted in dramatic increases in the number of children conceived through ART each year. The number of ART procedures reported to CDC has more than doubled, from 64,681 in 1996 to 138,198 in 2006 (1). During the same period, the number of infants conceived through ART procedures more than doubled, from 20,840 to 54,656.
This report documents that in 2006, ART use varied according to the patient's state of residency. Residents of California, New York, Illinois, New Jersey, Massachusetts, Florida, and Texas reported the highest number of ART procedures. These states also reported the highest number of infants conceived through ART. In 2006, ART use by state of residency was not consistent with expectations based on the total population within states (15). For example, Massachusetts had the fifth highest number of ART procedures performed, but ranked thirteenth in total population.†† Similarly, residents of District of Columbia, Rhode Island, and Hawaii underwent more ART procedures than would have been expected based on their population sizes. As a result, state-specific ratios of ART procedures by population varied according to state of residency. The highest ratios of the number of ART procedures among state residents per 1 million population were observed in Massachusetts (1, 291), District of Columbia (1,216), New Jersey (1,066), Connecticut (956), Maryland (835), and Illinois (751). This divergence was expected because in 2006, some of these states, including Massachusetts and New Jersey, had statewide mandates for insurance coverage for ART procedures. Variation between states also might be related to availability of ART services within each state. However, the relation between demand for services and availability is difficult to evaluate (e.g., increased availability in certain states might reflect the increased demand for ART among state residents).
Among women who used fresh embryos from their own eggs, patient factors (e.g., infertility diagnoses, history of previous ART procedures, and previous births) varied considerably by age. The proportion of procedures in which the couple received a diagnosis of ovulatory dysfunction, endometriosis, or male factor infertility decreased with the woman's age, whereas the proportion of procedures in which the couple received a diagnosis of diminished ovarian reserve increased with the woman's age. History of previous ART cycles and previous births were more common among older women. In addition, treatment factors varied considerably by the woman's age. The proportion of procedures in which embryo transfer occurred on day 3 increased with the age of the woman, and the proportion of procedures in which embryo transfer occurred on day 5 (i.e., the blastocyst stage) declined with the age of the woman. The proportion of procedures in which more than three embryos were transferred increased sharply with age.
Because ART success rates are affected by multiple patient and treatment factors, using a single measure of success is not sufficient to evaluate ART efficacy. At a minimum, ART procedures should be subdivided on the basis of the source of the egg (patient or donor) and the status of the embryos (freshly fertilized or thawed) because success rates vary substantially across these types. Within the type of ART procedure, further variation exists in success rates by patient and treatment factors, most notably patient age. Other factors to consider when assessing success rates are infertility diagnosis, number of previous ART procedures, number of previous births, method of embryo fertilization and transfer, number of days of embryo culture, number of embryos transferred, availability of extra embryos, and use of a gestational carrier (i.e., surrogate). Variation exists in success rates according to each factor.
CDC's primary focus in collecting ART data has been on live-birth deliveries as an indicator of success because ART surveillance activities were developed in response to a federal mandate to report ART success rate data. This mandate requires CDC to collect data from all ART medical centers and report success rates defined as all live births per ovarian stimulation procedures, or ART procedures, for each ART medical center. CDC's key role has been to publish standardized data related to ART success rates, including information regarding factors that affect these rates. These data can be used to help individuals and couples make informed decisions regarding whether to undergo this time-consuming and expensive treatment (20).§§ However, success-rate data also should be balanced with consideration of effects on maternal and infant health. CDC receives data on pregnancy outcomes of public health significance, which enables it to monitor multiple-birth rates, preterm delivery, and low birthweight associated with ART.
Since the 1980s, multiple births have increased substantially in the United States (17,21). The increase in multiple births has been attributed to an increased use of ART and delayed childbearing (5,22,23). Although infants conceived with ART accounted for approximately 1% of the total births in the United States in 2006, the proportion of twins and triplets or higher-order multiples attributed to ART were 17% and 38%, respectively, which is similar to rates for previous years. In 1999, the Society for Assisted Reproductive Technology (SART) and the American Society for Reproductive Medicine (ASRM) issued voluntary guidelines (24) on the number of embryos transferred. Since multiple gestations lead to an increased risk of complication in both the fetuses and the mothers, ASRM and SART have developed recommendations on the number of cleavage-stage (usually 2 or 3 days after fertilization) embryos or blastocysts (usually 5 or 6 days after fertilization) that should be transferred based on patient's age and prognoses. These guidelines were revised in 2004 (25), 2006 (26), and 2008 (27).
In certain states, ART procedures are not covered by insurance carriers, and patients might feel pressured to maximize the opportunity for live-birth delivery by transferring multiple embryos. In addition, if success is defined solely as total live-birth delivery, anecdotal evidence suggests that certain ART providers might feel pressure to transfer multiple embryos to maximize their publicly reported success rates (28). In the United States, transfer of more than two embryos was still a common practice in 2006. Approximately 43% of ART procedures that used fresh patients' eggs or embryos and progressed to the embryo-transfer stage involved the transfer of three or more embryos. Approximately 16% of procedures involved the transfer of four or more, and 5% of procedures involved the transfer of five or more embryos (1). However, among women aged <35 years, the proportion of ART procedures that involved four or more embryos transferred was approximately 6% (substantially less than the average of 16% for all transfers) because women in this age category typically experience higher success rates with fewer embryos transferred. Certain scientific reports have advocated that singleton live-birth rates be presented as a distinct indicator of ART success (29--35). This report includes this measure (Figure 2) and presents it with total live-birth rates. Success rates based on singleton live-birth deliveries will provide patients with a measure that more directly highlights infant outcomes with the optimal short- and long-term prognosis. Twins, albeit to a lesser extent than triplets or higher-order multiples, have substantially increased risks for infant morbidity and mortality (17). The risks for low birthweight and preterm birth both exceed 57% for twins, and the risk for very low birthweight is 9%. In addition, because twins are at substantially increased risk for perinatal and infant mortality (11, 21), singleton live-birth rates are a valid measure of success.
Data in this report indicate that 49% of infants born through ART in 2006 were born in multiple-birth deliveries, compared with 3% in the general U.S. population (17). The twin rate was 44%, compared with 3% in the general U.S. population, and the rate of triplets and higher-order multiples was 5%, approximately 25 times higher than the general U.S. population rate (0.2%). The percentage of infants born in multiple-birth deliveries were among the highest for women who underwent ART procedures that used fresh embryos from their own eggs (48%) or from donor eggs (57%). In 22 states, U.S. Virgin Islands and Puerto Rico, ≥50% of infants conceived through ART were born in multiple-birth deliveries. Multiple births resulting from ART are an increasing public health concern nationwide and for the majority of states.
The multiple-birth risk increased for women who underwent ART procedures using fresh embryos from their own eggs after multiple embryos were transferred. Embryo availability, an indicator of embryo quality, also was a strong predictor of multiple-birth risk independent from the number of embryos transferred. In analyses stratified by patient age, number of embryos transferred, day of embryo culture (day 3 or 5), and embryo availability, high live-birth rates and singleton live-birth rates were achieved, particularly among younger women as transfer of a single embryo was efficacious. In the majority of groups, limiting the number of embryos transferred can minimize the multiple-birth risk without severely compromising the success rates.
In addition to the known multiple-birth risks associated with ART, singleton infants conceived from ART procedures are at increased risk for low birthweight and preterm delivery. In 2006, of all singleton infants conceived with ART, 9% were low birthweight, compared with 6% in the general U.S. population (17). Approximately 2% of singleton infants conceived from ART were very low birthweight, compared with approximately 1% of singletons conceived in the general U.S. population. The percentage of ART singletons born preterm was 13% in comparison to 11% for the general U.S. population. Adverse infant health outcomes among singletons (e.g., low birthweight and preterm delivery) also should be considered when assessing the efficacy and safety of ART.
A comparison of perinatal outcomes among ART twins and triplets or higher-order multiples with their counterparts in the general population is not useful for at least two reasons. First, although ART and other infertility treatments account for a substantial proportion of multiple births in the United States, distinguishing between naturally conceived multiple births from iatrogenic (i.e., medically assisted) multiple births is not possible. ART accounts for only 1% of the total U.S. births. However, it accounts for 17% of twins and 38% of triplets or higher-order multiples. Second, the majority of multiple births conceived after ART treatment are likely dizygotic from multiple embryo transfer. Among natural conceptions, approximately one third to one half of twins might be monozygotic, depending on maternal age (36). Monozygotic twins are at increased risk for adverse outcomes in comparison with dizygotic twins (37).
Multiple births are associated with an increased health risk for mothers and infants (11,12,20,22). Women with multiple-gestation pregnancies are at increased risk for maternal complications (e.g., hemorrhage and hypertension). Infants born in a multiple-birth delivery are at increased risk for prematurity, low birthweight, infant mortality, and long-term disability. The contribution of ART to preterm births in the United States also is a key concern. This report documents that approximately 41% of ART infants born in 2006 were preterm (Table 11), compared with approximately 13% of preterm births in the general U.S. population (17). Preterm infants have increased risk for death and have more health and developmental problems than full-term infants (38--41). The health risks associated with preterm births have contributed to increasing health-care costs. In 2005, the economic burden associated with preterm births in the United States has been estimated at $26 billion ($51,600 per infant born preterm) (41). ART infants born preterm accounted for approximately 4% of all preterm births in the United States in 2006, a total economic burden estimated at $1 billion. ASRM and SART guidelines on the number of embryos that should be transferred in an ART cycle might help in further reducing the incidence of preterm deliveries, the majority of which are multiples (24--27).
The findings in this report are subject to at least four limitations. First, ART surveillance data were reported for each ART procedure performed rather than for each patient who used ART. Linking procedures among patients who underwent more than one ART procedure in a given year is not possible. Because patients who underwent more than one procedure in a given year were most likely to include those in which a pregnancy was not achieved, the success rates reported might underestimate the true per-patient success rate. In addition, ratios of ART procedures per population might be higher than the unknown ratio of the number of persons undergoing ART per population. Second, these data represent couples who sought ART services in 2006; therefore, success rates do not represent all couples with infertility who were potential ART users during that time. Third, because treatment was not randomized but rather based on medical center assessment and patient choice, results for treatment factors must be considered with caution. The results for treatment factors need to be carefully considered because treatment was not randomly assigned as is done in a clinical trial, but based on medical center assessment and patient choice. Comparisons in success rates are prone to confounding by patient and treatment factors. Although variability in live-birth rates among patients who used different treatment options cannot be completely adjusted for determinants of treatment assignment (i.e., confounding by indication might remain after adjustment), stratified analyses were used to examine associations between treatment factors and live-birth rates among more homogenous groups of patients. Finally, approximately 12% of medical centers that performed ART in 2006 did not report their data to CDC as required by law, and might have had results different from clinics that reported their data.
ART data are reported to CDC by the ART medical center where the procedure was performed rather than by the state in which the patient resided. In this report, ART data are presented by the female patient's state of residence. Residency data were missing for approximately 5% of all live-birth deliveries resulting from ART procedures started in 2006. In cases of missing residency data, residency was assigned as the state where the ART procedure was performed. As a result, the number of procedures performed among state residents, number of infants, and number of multiple-birth infants might have been slightly overestimated for certain states. Concurrently, the numbers might be underestimated in states that border states with high rates of missing residency data, particularly states in the northeast. Nonetheless, the effects of missing residency data were not substantial. Statistics were evaluated separately according to the location of the ART medical center rather than the patient's state of residence. The rankings of the ART medical center location by total number of infants and multiple-birth infants were similar to the rankings based on the patient's state of residence, which was reported at the time of ART treatment. The possibility of migration during the interval between ART treatment and birth exists. U.S. Census Bureau data indicate that approximately 3% of the U.S. population moves between states annually. This rate is even higher for persons aged 20--34 years (42). Members of the U.S. armed forces have a high potential for migration. Therefore, ART procedures performed among patients who attended military medical centers were evaluated separately. In 2006, <1% of ART procedures were performed in four military medical centers (California, District of Columbia, Hawaii, and Texas). In certain facilities, a substantial number of distinct states were listed for patient's state of residence. States and territories for which ≥1% of ART procedures among residents were performed in a military medical center were Alaska, Delaware, District of Columbia, Hawaii, Maryland, New Mexico, North Carolina, Oklahoma, Texas, Virginia, and Wyoming. States for which >5% of ART procedures among state residents were performed in a military medical center were District of Columbia and Hawaii.
Despite these limitations, findings from national surveillance of ART procedures performed in the United States provide useful information for patients contemplating ART, ART providers, and health-care policy makers. ART surveillance data can be used to monitor trends in ART use and outcomes from ART procedures. Data from ART surveillance can be used to assess patient and treatment factors that contribute to higher success rates. Ongoing surveillance data can be used to assess the risk for multiple births and adverse perinatal outcomes among singleton births. Surveillance data provide information to assess changes in clinical practice related to ART treatment.
Increased use of ART procedures and the practice of transferring multiple embryos during ART treatments have led to high multiple-birth rates in the United States (5, 10). Balancing the chance of success of ART against the risk for multiple births can be a challenge. Implementation of approaches to limit the number of embryos transferred for patients undergoing ART should reduce the occurrence of multiple births resulting from ART. Such efforts ultimately might lead ART patients and providers to view treatment success in terms of singleton pregnancies and births. In addition, continued research is needed to understand the adverse effects of ART on maternal and child health. CDC will continue to provide updates of ART use in the United States as data become available.
References
- CDC. American Society for Reproductive Medicine, Society for Assisted Reproductive Technology. 2006 assisted reproductive technology success rates. Atlanta, GA: US Department of Health and Human Services, CDC; 2008.
- CDC. American Society for Reproductive Medicine, Society for Assisted Reproductive Technology, RESOLVE. 1995 assisted reproductive technology success rates. Atlanta, GA: US Department of Health and Human Services, CDC; 1997.
- Schieve LA, Peterson HB, Meikle SF, et al. Live-birth rates and multiple-birth risk using in vitro fertilization. JAMA 1999;282:1832--8.
- Schieve LA, Meikle SF, Peterson HB, Jeng G, Burnett NM, Wilcox LS. Does assisted hatching pose a risk for monozygotic twinning in pregnancies conceived through in vitro fertilization? Fertil Steril 2000;74:288--94.
- Reynolds MA, Schieve LA, Martin JA, Jeng G, Macaluso M. Trends in multiple births conceived using assisted reproductive technology, United States, 1997--2000. Pediatrics 2002;111:1159--62.
- Reynolds MA, Schieve LA, Jeng G, Peterson HB, Wilcox LS. Risk of multiple birth associated with in vitro fertilization using donor eggs. Am J Epidemiol 2001;154:1043--50.
- Vahratian A, Schieve LA, Reynolds MA, Jeng G. Live-birth rates and multiple-birth risk of assisted reproductive technology pregnancies conceived using thawed embryos, USA, 1999--2000. Hum Reprod 2002;18:1442--8.
- Wright V, Schieve LA, Vahratian A, Reynolds MA. Monozygotic twinning associated with day 5 embryo transfer in pregnancies conceived after IVF. Hum Reprod 2004;19:1831--6.
- Kissin DM, Schieve LA, Reynolds MA. Multiple-birth risk associated with IVF and extended embryo culture: USA, 2001. Hum Reprod 2005;20:2215--23.
- Reynolds MA, Schieve LA. Trends in embryo transfer practices and multiple gestation for IVF procedures in the USA, 1996--2002. Hum Reprod 2006;21:694--700.
- European Society of Human Reproduction and Embryology (ESHRE) Capri Workshop Group. Multiple gestation pregnancy. Hum Reprod 2000;15:1856--64.
- Mackay AP, Berg CJ, King JC, Duran C, Chang J. Pregnancy-related mortality among women with multifetal pregnancies. Obstet Gynecol 2006;107:563--8.
- Schieve LA, Meikle SF, Ferre C, Peterson HB, Jeng G, Wilcox LS. Low and very low birth weight in infants conceived with use of assisted reproductive technology. N Engl J Med 2002;346:731--7.
- Schieve LA, Ferre C, Peterson HB, Macaluso M, Reynolds MA, Wright VC. Perinatal outcomes among singleton infants conceived through assisted reproductive technology in the United States. Obstet Gynecol 2004;103:1144--53.
- US Census Bureau. Annual estimates of the population for the United States and States, and for Puerto Rico: April 1, 2000 to July 1, 2006 (NST-EST2006-01). Washington, DC: US Census Bureau; 20056 Available at http://factfinder.census.gov.
- Farr SL, Schieve LA, Jamieson DJ. Pregnancy loss among pregnancies conceived through assisted reproductive technology, United States, 1999--2002. Am J Epidemiol 2007;165:1380--8.
- Martin JA, Hamilton BE, Sutton PD, Ventura SJ, Menacker F, Kirmeyer S, Mathews TJ. Births: final data for 2006. National Vital Stat Rep 2009;57:1--104.
- SAS(r) Institute, Inc. SAS/STAT(r) user's guide. Version 9. Cary, NC: SAS Institute Inc.; 2004.
- CDC. Fertility, family planning, and reproductive health of U.S. women: data from the 2002 National Survey of Family Growth. Hyattsville, MD: US Department of Health and Human Services, CDC; 2005. (Vital and Health Statistics, series 23).
- American Society for Reproductive Medicine. Frequently asked questions about infertility. Birmingham, AL: American Society for Reproductive Medicine, 2004.
- Luke B, Martin JA. The rise in multiple births in the United States: Who, What, When, Where, and Why. Clin Obstet Gynecol 2004;47:118--33.
- CDC. Use of assisted reproductive technology---United States, 1996 and 1998. MMWR 2002;51:97--101.
- Warner BB, Kiely JL, Donovan EF. Multiple births and outcome. Clin Perinatol 2000;27:346--61,ix.
- American Society for Reproductive Medicine.Guidelines on number of embryos transferred. Birmingham, AL:American Society for Assisted Reproductive Medicine; 1999.
- The Practice Committee of the Society for Assisted Reproductive Technology, the American Society for Reproductive Medicine. Guidelines on the number of embryos transferred. Fertil Steril 2004;82 (Suppl 1):1--2.
- The Practice Committee of the Society for Assisted Reproductive Technology, the American Society for Reproductive Medicine. Guidelines on the number of embryos transferred. Fertil Steril 2006;86 (Suppl 5):S51--2.
- The Practice Committee of the Society for Assisted Reproductive Technology, the American Society for Reproductive Medicine. Guidelines on the number of embryos transferred. Fertil Steril 2008;90 (Suppl 3):S163-164.
- Grifo J, Hoffman D, McNamee PI. We are due for a correction...and we are working to achieve one. Fertil Steril 2001;75:14.
- European Society of Human Reproduction and Embryology (ESHRE) Capri Workshop Group. Prevention of twin pregnancies after IVF/ICSI by single embryo transfer. ESHRE campus course report. Hum Reprod 2001;16:790--800.
- Cohen J, Jones HW Jr. How to avoid multiple pregnancies in assisted reproductive technologies [Review]. Semin Reprod Med 2001;19:269--78.
- Evers JL. Female subfertility. Lancet 2002;360:151--9.
- Hogue CJ. Successful assisted reproductive technology: the beauty of one. Obstet Gynecol 2002;100 (5 Part 1):1017--9.
- World Health Organization. Recommendations. In: Vayena E, Rowe PJ, Griffin PD, eds. Current practices and controversies in assisted reproduction: report of a meeting on "Medical, Ethical and Social Aspects of Assisted Reproduction" held at WHO Headquarters in Geneva, Switzerland, September 17--21, 2001. Geneva, Switzerland: World Health Organization;2002:381--96.
- Schieve LA, Reynolds MA. What is the most relevant standard of success in assisted reproduction? Challenges in measuring and reporting success rates for assisted reproductive technology: what is optimal? Hum Reprod 2004;19:778--82.
- Ozturk O, Templeton A. Multiple pregnancy in assisted reproduction techniques. In: Vayena E, Rowe PJ, Griffin PD, eds. Current practices and controversies in assisted reproduction: report of a meeting on "Medical, Ethical and Social Aspects of Assisted Reproduction" held at WHO Headquarters in Geneva, Switzerland, September 17--21, 2001. Geneva, Switzerland: World Health Organization;2002:220--34.
- Guttmacher AF. The incidence of multiple births in man and some of the other unipara. Obstet Gynecol 1953;2:22--35.
- Derom R, Vlietinck R, Derom C, Thiery M, Van Maele G, Van den Berg H. Perinatal mortality in the East Flanders Prospective Twin Survey: preliminary results. Eur J Obstet Gynecol Reprod Biol 1991;41:25--6.
- Callaghan WM, MacDorman MF, Rasmussen SA, Qin C, Lackritz EM. The contribution of preterm birth to infant mortality rates in the United States. Pediatrics 2006;118:1566--73.
- Tanner K, Sabrine N, Wren C. Cardiovascular malformations among preterm infants. Pediatrics 2005;116:e833--8.
- Rasmussen SA, Moore CA, Pauloi LJ, Rhodenhiser EP. Risk for birth defects among premature infants: a population-based study. J Pediatr 2001;138:668--73.
- Behrman RE, Stith Butler A, eds. Preterm birth: causes, consequences, and prevention. Washington, DC: National Academies Press; 2006.
- US Census Bureau. Annual geographical mobility rates, by type of movement: 1947--2005 (Table A-1). Washington, DC: US Census Bureau; 2006. Available at http://www.census.gov/population/www/socdemo/migrate.html.
* Fertility Clinic Success Rate and Certification Act of 1992 (FCSRCA), Public Law 102-493 (October 24, 1992).
† Data regarding population size are based on July 1, 2006, estimates from the U.S. Census Bureau (15).
§ Includes only the number of infants live-born in a multiple-birth delivery. For example, if three infants were born in a live-birth delivery and one of the three infants was stillborn, the total number of live-born infants would be two. However, the two infants still would be counted as triplets.
¶ Data were not available to distinguish whether previous births were conceived naturally, with ART, or other infertility treatments.
** Results are based on total multiple-birth risk and do not provide an indication of pregnancies that began as twins, triplets, or a higher order but reduced (either spontaneously or through medical intervention) to singletons or twins (Tables 6 and 7).
†† Data regarding population size are based on July 1, 2006, estimates from the U.S. Census Bureau (15).
§§ Estimated cost for one procedure of IVF averages $12,400 (20).