 |
|
|
|
|
|
|
| ||||||||||
|
|
|
|
|
|
|
||||
| ||||||||||
|
|
|
|
|
Persons using assistive technology might not be able to fully access information in this file. For assistance, please send e-mail to: mmwrq@cdc.gov. Type 508 Accommodation and the title of the report in the subject line of e-mail. Youth Risk Behavior Surveillance --- Pacific Island United States Territories, 2007Jaclynn Lippe1
Corresponding author: Nancy D. Brener, PhD, Division of Adolescent and School Health, National Center for Chronic Disease Prevention and Health Promotion, MS K-33, 4770 Buford Hwy, NE, Atlanta, GA 30341. Telephone: 770-488-6184; Fax: 770-488-6156; E-mail: nad1@cdc.gov. AbstractProblem: Priority health-risk behaviors, which are behaviors that contribute to the leading causes of morbidity and mortality among youth and adults in Pacific Island territories, often are established during adolescence and extend into adulthood. Reporting Period Covered: January--June 2007. Description of the System: The Youth Risk Behavior Surveillance System (YRBSS) monitors six categories of priority health-risk behaviors among youth and young adults, including behaviors that contribute to unintentional injuries and violence; tobacco use; alcohol and other drug use; sexual behaviors that contribute to unintended pregnancy and sexually transmitted diseases, including human immunodeficiency virus infection; unhealthy dietary behaviors; and physical inactivity. In addition, the YRBSS monitors the prevalence of obesity and asthma. YRBSS includes a national school-based survey conducted by CDC and state, territorial, tribal, and local school-based surveys conducted by state, territorial, tribal, and local education and health agencies. This report summarizes results from surveys of students in grades 9--12 conducted in five territories (American Samoa, Commonwealth of the Northern Mariana Islands, Guam, Republic of the Marshall Islands, and Republic of Palau) during January--June 2007. Results: Across the five Pacific Island territories, the leading causes of mortality among all ages include unintentional injuries, including motor-vehicle crashes; cancer; cardiovascular diseases; stroke; and diabetes. Results from the Youth Risk Behavior Survey (YRBS) indicated that high school students in the Pacific Island territories engaged in behaviors that increased their risk for mortality or morbidity from these causes. Across the five territories during 2007, the percentage of high school students who had rarely or never worn a seat belt when riding in a car driven by someone else ranged from 11.8% to 83.2% (median: 30.9%). During the 30 days before the survey, the percentage who had ridden in a car or other vehicle driven by someone who had been drinking alcohol ranged from 34.8% to 49.8% (median: 42.8%), the percentage who had driven a car or other vehicle when they had been drinking alcohol ranged from 7.8% to 16.1% (median: 11.9%), and the percentage who had carried a weapon ranged from 16.9% to 32.0% (median: 19.6%). The percentage of students who had smoked cigarettes during the 30 days before the survey ranged from 23.1% to 37.6% (median: 31.1%), the percentage who had not eaten fruits and vegetables five or more times per day during the 7 days before the survey ranged from 72.8% to 83.6% (median: 79.5%), and the percentage who had not met recommended levels of physical activity ranged from 64.0% to 77.2% (median: 68.9%). Interpretation: The prevalence of many health-risk behaviors varies across the five Pacific Island territories, and many high school students engage in behaviors that place them at risk for the leading causes of mortality and morbidity. Public Health Action: YRBSS data will be used in the territories for decision making and program planning, resulting in more effective school health and youth health programs. More evidence-based interventions and programs are needed to reduce risk behaviors and improve health outcomes among youth. IntroductionAcross the five Pacific Island territories, the leading causes of mortality among all ages include unintentional injuries, including motor-vehicle crashes; cancer; cardiovascular diseases; stroke; and diabetes (1).* Priority health-risk behaviors, which are behaviors that contribute to the leading causes of morbidity and mortality, often are established during childhood and adolescence and then extend into adulthood. These behaviors are monitored by the Youth Risk Behavior Surveillance System (YRBSS). The YRBSS monitors six categories of priority health-risk behaviors among youth and young adults, including behaviors that contribute to unintentional injuries and violence; tobacco use; alcohol and other drug use; sexual behaviors that contribute to unintended pregnancy and STDs, including human immunodeficiency virus (HIV) infection; unhealthy dietary behaviors; and physical inactivity. The YRBSS also monitors obesity and asthma and includes national, state, territorial, tribal, and local school-based surveys of students in grades 9--12. This report summarizes results from the 2007 Youth Risk Behavior Survey (YRBS) conducted in five Pacific Island Territories (American Samoa, Commonwealth of the Northern Mariana Islands, Guam, Republic of the Marshall Islands, and Republic of Palau) during January 2007--June 2007. MethodsDetailed information about YRBSs has been described elsewhere (2). Additional information also is available at http://www.cdc.gov/yrbs. SamplingEach territory school-based survey employed a two-stage cluster sample design to produce a representative sample of public school students in grades 9--12. In the first sampling stage, all schools with any students in grades 9--12 were selected. In the second sampling stage, in American Samoa, Commonwealth of the Northern Mariana Islands, Republic of the Marshall Islands, and Republic of Palau, all students were eligible to participate; in Guam, intact classes from either a required subject (e.g., English or social studies) or a required period (e.g., homeroom or second period) were selected randomly, and all students in selected classes were eligible to participate. Pacific Island territories that had a representative sample of students, appropriate documentation, and an overall response rate of 60% or higher were weighted. A weight was applied to each record to adjust for student nonresponse and the distribution of students by grade and sex. Therefore, weighted estimates are representative of all students in grades 9--12 attending public schools in each territory. In 2007, all five Pacific Island territories had weighted data. Student sample sizes ranged from 732 to 3,625 (Table 1). School response rates were all 100%; student response rates ranged from 78% to 90%; and overall response rates, calculated by multiplying the school response rate by the student response rate, ranged from 78% to 90%. Data Collection Procedures and QuestionnaireProcedures were designed to protect students' privacy by allowing for anonymous and voluntary participation. Before survey administration, local parental permission procedures were followed. Students completed the self-administered questionnaire during one class period and recorded their responses directly on a computer-scannable booklet or answer sheet. The core questionnaire contained 87 questions. Territories could add or delete questions from the core questionnaire. Skip patterns were not included in any questionnaire to protect student privacy by ensuring all completed the questionnaire in approximately the same amount of time. Information about the reliability of the core questions has been published previously (3). Data Processing and CodingData from each territory data set were cleaned and edited for inconsistencies. Missing data were not imputed statistically. The number of completed questionnaires that failed quality-control checks† and were excluded from analysis ranged from one to 12 (median: four). Race/ethnicity was defined differently for each Pacific Island territory and, therefore, it is not included in this report. Students were classified as obese or overweight based on their body mass index (kg/m2) (BMI), which was calculated from self-reported height and weight. The BMI values were compared with sex- and age-specific reference data from the 2000 CDC Growth Charts (4). Obese was defined as a BMI of >95th percentile for age and sex. Overweight was defined as a BMI of >85th percentile and <95th percentile for age and sex. Previous YRBS reports used the terms "overweight" to describe those youth with a BMI >95th percentile for age and sex and "at risk for overweight" for those with a BMI >85th percentile and <95th percentile. However, this report uses the terms "obese" and "overweight" in accordance with the 2007 recommendations from the Expert Committee on the Assessment, Prevention, and Treatment of Child and Adolescent Overweight and Obesity convened by the American Medical Association (AMA) and cofunded by AMA in collaboration with the Health Resources and Services Administration and CDC (5). These classifications are not intended to diagnose individual students as obese or overweight, but rather to provide estimates of obesity and overweight for the population of students surveyed. The reliability and validity of self-reported height and weight among high school students has been described previously (6). Analytic MethodsStatistical analyses were conducted on weighted data using SAS® (7) and SUDAAN (8) software to account for the complex sampling designs. Prevalence estimates were computed for all variables and all data sets. Confidence intervals were computed for Guam because that site used a sample rather than a census of students. ResultsBehaviors that Contribute to Unintentional Injuries Seat Belt Use Across surveys, the overall percentage of students who had rarely or never worn a seat belt when riding in a car driven by someone else ranged from 11.8% to 83.2% (median: 30.9%). Prevalence among female students ranged from 10.9% to 83.0% (median: 29.9%), and prevalence among male students ranged from 12.3% to 83.6% (median: 32.0%) (Table 2). Bicycle Helmet UseAcross surveys, among students who had ridden a bicycle during the 12 months before the survey, the overall percentage of students who had rarely or never worn a bicycle helmet ranged from 71.9% to 97.6% (median: 92.9%). Prevalence among female students ranged from 72.7% to 98.8% (median: 92.9%), and prevalence among male students ranged from 71.0% to 96.3% (median: 93.1%) (Table 2). Rode with a Driver Who Had Been Drinking AlcoholDuring the 30 days before the survey, across surveys, the overall percentage of students who had ridden one or more times in a car or other vehicle driven by someone who had been drinking alcohol ranged from 34.8% to 49.8% (median: 42.8%). Prevalence among female students ranged from 30.1% to 48.5% (median: 38.9%), and prevalence among male students ranged from 36.3% to 54.6% (median: 46.5%) (Table 3). Drove When Drinking AlcoholDuring the 30 days before the survey, across surveys, the overall percentage of students who had driven a car or other vehicle one or more times when they had been drinking alcohol ranged from 7.8% to 16.1% (median: 11.9%). Prevalence among female students ranged from 5.3% to 10.1% (median: 9.1%), and prevalence among male students ranged from 9.7% to 22.9% (median: 14.2%) (Table 3). Behaviors that Contribute to ViolenceCarried a Weapon Across surveys, the overall percentage of students who had carried a weapon (e.g., a gun, knife, or club) on at least 1 day during the 30 days before the survey ranged from 16.9% to 32.0% (median: 19.6%). Prevalence among female students ranged from 7.7% to 22.5% (median: 10.8%), and prevalence among male students ranged from 24.7% to 42.8% (median: 29.6%) (Table 4). Carried a GunAcross surveys, the overall percentage of students who had carried a gun on at least 1 day during the 30 days before the survey ranged from 5.1% to 12.1% (median: 8.5%). Prevalence among female students ranged from 1.9% to 8.5% (median: 3.3%), and prevalence among male students ranged from 7.9% to 16.1% (median: 13.8%) (Table 4). In a Physical FightAcross surveys, the overall percentage of students who had been in a physical fight one or more times during the 12 months before the survey ranged from 27.0% to 54.4% (median: 34.1%). Prevalence among female students ranged from 17.8% to 46.0% (median: 25.7%), and prevalence among male students ranged from 36.0% to 63.6% (median: 41.3%) (Table 5). Injured in a Physical FightAcross surveys, the overall percentage of students who had been in a physical fight one or more times during the 12 months before the survey in which they were injured and had to be treated by a doctor or nurse ranged from 4.5% to 11.6% (median: 5.0%). Prevalence among female students ranged from 2.6% to 8.8% (median: 4.9%), and prevalence among male students ranged from 4.3% to 14.7% (median: 6.7%) (Table 5). Dating ViolenceAcross surveys, the overall percentage of students who had been hit, slapped, or physically hurt on purpose by their boyfriend or girlfriend (i.e., dating violence) ranged from 13.3% to 30.8% (median: 14.1%). Prevalence among female students ranged from 12.5% to 25.9% (median: 14.8%), and prevalence among male students ranged from 10.0% to 35.5% (median: 14.9%) (Table 6). Forced to Have Sexual IntercourseAcross surveys, the overall percentage of students who had ever been physically forced to have sexual intercourse when they did not want to ranged from 12.9% to 35.8% (median: 21.0%). Prevalence among female students ranged from 17.7% to 32.8% (median: 19.0%), and prevalence among male students ranged from 8.8% to 38.9% (median: 19.4%) (Table 6). Carried a Weapon on School PropertyAcross surveys, the overall percentage of students who had carried a weapon (e.g., a gun, knife, or club) on school property on at least 1 day during the 30 days before the survey ranged from 5.4% to 17.6% (median: 8.4%). Prevalence among female students ranged from 2.8% to 10.5% (median: 4.6%), and prevalence among male students ranged from 7.8% to 25.2% (median: 12.2%) (Table 7). Threatened or Injured with a Weapon on School PropertyAcross surveys, the overall percentage of students who had been threatened or injured with a weapon (e.g., a gun, knife, or club) on school property one or more times during the 12 months before the survey ranged from 7.2% to 20.5% (median:10.3%). Prevalence among female students ranged from 4.8% to 17.5% (median: 7.2%), and prevalence among male students ranged from 9.3% to 23.3% (median: 13.5%) (Table 7). In a Physical Fight on School PropertyAcross surveys, the overall percentage of students who had been in a physical fight on school property one or more times during the 12 months before the survey ranged from 12.4% to 33.1% (median: 16.0%). Prevalence among female students ranged from 9.5% to 26.0% (median: 11.0%), and prevalence among male students ranged from 15.3% to 40.8% (median: 20.1%) (Table 8). Had Property Stolen or Damaged on School PropertyAcross surveys, the overall percentage of students who had had their property (e.g., car, clothing, or books) stolen or deliberately damaged on school property one or more times during the 12 months before the survey ranged from 22.6% to 53.7% (median: 37.1%). Prevalence among female students ranged from 24.1% to 51.0% (median: 36.6%), and prevalence among male students ranged from 21.2% to 58.2% (median: 37.3%) (Table 8). Did Not Go to School Because of Safety ConcernsAcross surveys, the overall percentage of students who had not gone to school on at least 1 day during the 30 days before the survey because they felt they would be unsafe at school or on their way to or from school ranged from 8.8% to 36.4% (median: 12.3%). Prevalence among female students ranged from 8.4% to 34.4% (median: 14.1%), and prevalence among male students ranged from 8.9% to 38.2% (median: 11.3%) (Table 9). Felt Sad or HopelessAcross surveys, the overall percentage of students who had felt so sad or hopeless almost every day for 2 or more weeks in a row that they stopped doing some usual activities during the 12 months before the survey ranged from 37.1% to 47.3% (median: 41.9%). Prevalence among female students ranged from 43.8% to 52.6% (median: 46.3%), and prevalence among male students ranged from 29.4% to 48.2% (median: 34.4%) (Table 10). Seriously Considered Attempting SuicideAcross surveys, the overall percentage of students who had seriously considered attempting suicide during the 12 months before the survey ranged from 22.0% to 28.9% (median: 25.7%). Prevalence among female students ranged from 25.9% to 37.6% (median: 30.2%), and prevalence among male students ranged from 16.6% to 25.3% (median: 19.6%) (Table 11). Made a Suicide PlanAcross surveys, the overall percentage of students who had made a plan about how they would attempt suicide during the 12 months before the survey ranged from 21.4% to 30.0% (median: 25.4%). Prevalence among female students ranged from 27.5% to 31.7% (median: 31.1%), and prevalence among male students ranged from 15.9% to 30.8% (median: 18.7%) (Table 11). Attempted SuicideAcross surveys, the overall percentage of students who had attempted suicide one or more times during the 12 months before the survey ranged from 16.9% to 25.3% (median: 19.6%). Prevalence among female students ranged from 21.3% to 35.7% (median: 22.6%), and prevalence among male students ranged from 11.8% to 26.5% (median: 13.4%) (Table 12). Suicide Attempt Treated by a Doctor or NurseAcross surveys, the overall percentage of students who had made a suicide attempt that resulted in an injury, poisoning, or overdose that had to be treated by a doctor or nurse during the 12 months before the survey ranged from 3.8% to 14.2% (median: 6.1%). Prevalence among female students ranged from 4.8% to 14.7% (median: 6.2%), and prevalence among male students ranged from 2.8% to 15.6% (median: 5.3%) (Table 12). Tobacco UseLifetime Cigarette Use Across surveys, the overall percentage of students who had ever tried cigarette smoking (even one or two puffs) (i.e., lifetime cigarette use) ranged from 56.8% to 78.1% (median: 69.7%). Prevalence among female students ranged from 53.1% to 78.7% (median: 67.6%), and prevalence among male students ranged from 57.1% to 77.6% (median: 71.6%) (Table 13). Lifetime Daily Cigarette UseAcross surveys, the overall percentage of students who had ever smoked at least one cigarette every day for 30 days (i.e., lifetime daily cigarette use) ranged from 13.6% to 17.6% (median: 16.6%). Prevalence among female students ranged from 12.6% to 16.2% (median: 13.1%), and prevalence among male students ranged from 14.2% to 22.3% (median: 17.8%) (Table 13). Current Cigarette UseAcross surveys, the overall percentage of students who had smoked cigarettes on at least 1 day during the 30 days before the survey (i.e., current cigarette use) ranged from 23.1% to 37.6% (median: 31.1%). Prevalence among female students ranged from 20.4% to 31.1% (median: 25.4%), and prevalence among male students ranged from 22.9% to 44.4% (median: 31.2%) (Table 14). Current Frequent Cigarette UseAcross surveys, the overall percentage of students who had smoked cigarettes on 20 or more days during the 30 days before the survey (i.e., current frequent cigarette use) ranged from 8.2% to 13.1% (median: 11.0%). Prevalence among female students ranged from 2.6% to 10.7% (median: 6.7%), and prevalence among male students ranged from 7.2% to 21.3% (median: 13.9%) (Table 14). Smoked More than 10 Cigarettes per DayAcross surveys, among students who currently smoked cigarettes, the overall percentage of students who had smoked more than 10 cigarettes per day on the days they smoked during the 30 days before the survey ranged from 4.7% to 11.8% (median: 6.9%). Prevalence among female students ranged from 5.3% to 8.2% (median: 6.3%), and prevalence among male students ranged from 6.5% to 18.1% (median: 7.8%) (Table 15). Tried to Quit Smoking CigarettesAcross surveys, among students who currently smoked cigarettes, the overall percentage of students who had tried to quit smoking cigarettes during the 12 months before the survey ranged from 74.0% to 89.3% (median: 81.9%). Prevalence among female students ranged from 75.7% to 91.7% (median: 83.9%), and prevalence among male students ranged from 70.8% to 87.6% (median: 82.3%) (Table 15). Bought Cigarettes in a Store or Gas StationAcross surveys, among students who currently smoked cigarettes and were aged <18 years, the overall percentage of students who usually got their own cigarettes by buying them in a store (i.e., convenience store, supermarket, or discount store) or gas station during the 30 days before the survey ranged from 14.9% to 30.8% (median: 17.3%). Prevalence among female students ranged from 12.1% to 21.6% (median: 17.3%), and prevalence among male students ranged from 12.8% to 40.6% (median: 21.3%) (Table 16). Current Smokeless Tobacco UseAcross surveys, the overall percentage of students who had used smokeless tobacco (e.g., chewing tobacco, snuff, or dip) on at least 1 day during the 30 days before the survey (i.e., current smokeless tobacco use) ranged from 4.7% to 37.3% (median: 32.0%). Prevalence among female students ranged from 2.7% to 39.0% (median: 21.6%), and prevalence among male students ranged from 6.8% to 43.7% (median: 35.5%) (Table 16). Current Cigar UseAcross surveys, the overall percentage of students who had smoked cigars, cigarillos, or little cigars on at least 1 day during the 30 days before the survey (i.e., current cigar use) ranged from 6.5% to 27.1% (median: 9.5%). Prevalence among female students ranged from 3.1% to 22.5% (median: 6.6%), and prevalence among male students ranged from 9.0% to 31.8% (median: 12.2%) (Table 17).
Current Tobacco UseAcross surveys, the overall percentage of students who had reported current cigarette use, current smokeless tobacco use, or current cigar use (i.e., current tobacco use) ranged from 25.4% to 50.9% (median: 38.8%). Prevalence among female students ranged from 23.4% to 47.4% (median: 28.1%), and prevalence among male students ranged from 24.6% to 54.1% (median: 50.5%) (Table 17). Alcohol and Other Drug UseLifetime Alcohol Use Across surveys, the overall percentage of students who had had at least one drink of alcohol on at least 1 day during their life (i.e., lifetime alcohol use) ranged from 46.6% to 69.8% (median: 64.3%). Prevalence among female students ranged from 43.9% to 70.5% (median: 61.8%), and prevalence among male students ranged from 49.7% to 69.1% (median: 66.8%) (Table 18). Current Alcohol UseAcross surveys, the overall percentage of students who had had at least one drink of alcohol on at least 1 day during the 30 days before the survey (i.e., current alcohol use) ranged from 29.8% to 41.7% (median: 36.0%). Prevalence among female students ranged from 28.7% to 39.5% (median: 33.4%), and prevalence among male students ranged from 31.1% to 51.0% (median: 42.4%) (Table 18). Episodic Heavy DrinkingAcross surveys, the overall percentage of students who had had five or more drinks of alcohol in a row (i.e., within a couple of hours) on at least 1 day during the 30 days before the survey (i.e., episodic heavy drinking) ranged from 18.3% to 26.6% (median: 23.3%). Prevalence among female students ranged from 15.6% to 22.6% (median: 16.3%), and prevalence among male students ranged from 20.3% to 31.0% (median: 29.2%) (Table 19). Bought Alcohol in a StoreAcross surveys, among students who currently drank alcohol, the overall percentage of students who usually got the alcohol they drank by buying it in a store (e.g., liquor store, convenience store, supermarket, discount store, or gas station) during the 30 days before the survey ranged from 12.7% to 14.0% (median: 13.5%). Prevalence among female students ranged from 8.0% to 10.1% (median: 9.0%), and prevalence among male students ranged from 17.0% to 19.4% (median: 17.6%) (Table 19). Lifetime Marijuana UseAcross surveys, the overall percentage of students who had used marijuana one or more times during their life (i.e., lifetime marijuana use) ranged from 13.9% to 59.8% (median: 45.5%). Prevalence among female students ranged from 5.5% to 55.6% (median: 40.6%), and prevalence among male students ranged from 22.4% to 64.3% (median: 49.9%) (Table 20). Current Marijuana UseAcross surveys, the overall percentage of students who had used marijuana one or more times during the 30 days before the survey (i.e., current marijuana use) ranged from 8.5% to 38.5% (median: 23.3%). Prevalence among female students ranged from 3.2% to 33.0% (median: 20.5%), and prevalence among male students ranged from 14.1% to 43.7% (median: 25.6%) (Table 20). Lifetime Cocaine UseAcross surveys, the overall percentage of students who had used any form of cocaine (e.g., powder, crack,§ or freebase¶) one or more times during their life (i.e., lifetime cocaine use) ranged from 4.6% to 7.7% (median: 5.4%). Prevalence among female students ranged from 2.5% to 5.8% (median: 2.9%), and prevalence among male students ranged from 6.3% to 9.5% (median: 7.9%) (Table 21). Current Cocaine UseAcross surveys, the overall percentage of students who had used any form of cocaine (e.g., powder, crack, or freebase) one or more times during the 30 days before the survey (i.e., current cocaine use) ranged from 2.0% to 5.3% (median: 3.0%). Prevalence among female students ranged from 1.0% to 3.9% (median: 1.7%), and prevalence among male students ranged from 2.8% to 6.7% (median: 4.3%) (Table 21). Lifetime Illegal Injection-Drug UseAcross surveys, the overall percentage of students who had used a needle to inject any illegal drug into their body one or more times during their life (i.e., lifetime illegal injection-drug use) ranged from 4.1% to 15.0% (median: 5.1%). Prevalence among female students ranged from 2.1% to 14.1% (median: 3.8%), and prevalence among male students ranged from 5.4% to 15.8% (median: 6.5%) (Table 22). Lifetime Inhalant UseAcross surveys, the overall percentage of students who had sniffed glue, breathed the contents of aerosol spray cans, or inhaled any paints or sprays to get high one or more times during their life (i.e., lifetime inhalant use) ranged from 8.8% to 14.0% (median: 11.6%). Prevalence among female students ranged from 7.3% to 13.7% (median: 10.6%), and prevalence among male students ranged from 10.5% to 14.1% (median: 12.6%) (Table 22). Lifetime Illegal Steroid UseAcross surveys, the overall percentage of students who had taken steroid pills or shots without a doctor's prescription one or more times during their life (i.e., lifetime illegal steroid use) ranged from 4.8% to 6.5% (median: 5.1%). Prevalence among female students ranged from 3.3% to 4.6% (median: 3.6%), and prevalence among male students ranged from 5.5% to 9.4% (median: 6.0%) (Table 23). Lifetime Heroin UseAcross surveys, the overall percentage of students who had used heroin (also called "smack," "junk," or "China White") one or more times during their life (i.e., lifetime heroin use) ranged from 3.5% to 9.6% (median: 5.2%). Prevalence among female students ranged from 1.7% to 7.5% (median: 2.7%), and prevalence among male students ranged from 5.0% to 11.6% (median: 7.3%) (Table 24). Lifetime Methamphetamine UseAcross surveys, the overall percentage of students who had used methamphetamines (also called "speed," "crystal," "crank," or "ice") one or more times during their life (i.e., lifetime methamphetamine use) ranged from 4.9% to 13.1% (median: 5.9%). Prevalence among female students ranged from 2.7% to 10.5% (median: 3.7%), and prevalence among male students ranged from 6.2% to 15.4% (median: 8.6%) (Table 24). Lifetime Ecstasy UseAcross surveys, the overall percentage of students who had used ecstasy (also called "MDMA") one or more times during their life (i.e., lifetime ecstasy use) ranged from 4.7% to 6.9% (median: 5.4%). Prevalence among female students ranged from 2.2% to 4.9% (median: 2.9%), and prevalence among male students ranged from 6.7% to 9.1% (median: 7.7%) (Table 25).
Age of Initiation of Risk BehaviorsSmoked a Whole Cigarette Before Age 13 Years Across surveys, the overall percentage of students who had smoked a whole cigarette for the first time before age 13 years ranged from 6.9% to 28.6% (median: 22.7%). Prevalence among female students ranged from 6.2% to 27.4% (median: 19.4%), and prevalence among male students ranged from 7.5% to 29.8% (median: 25.2%) (Table 26). Drank Alcohol Before Age 13 YearsAcross surveys, the overall percentage of students who had drunk alcohol (other than a few sips) for the first time before age 13 years ranged from 10.9% to 27.4% (median: 20.8%). Prevalence among female students ranged from 6.9% to 25.0% (median: 15.4%), and prevalence among male students ranged from 14.8% to 29.6% (median: 25.5%) (Table 26). Tried Marijuana Before Age 13 YearsAcross surveys, the overall percentage of students who had tried marijuana for the first time before age 13 years ranged from 4.5% to 19.9% (median: 15.4%). Prevalence among female students ranged from 3.0% to 12.3% (median: 9.4%), and prevalence among male students ranged from 6.0% to 29.0% (median: 20.2%) (Table 27).
Tobacco, Alcohol, and Other Drug Use on School PropertySmoked Cigarettes on School Property Across surveys, the overall percentage of students who had smoked cigarettes on school property on at least 1 day during the 30 days before the survey ranged from 6.7% to 16.3% (median: 10.2%). Prevalence among female students ranged from 7.3% to 10.7% (median: 9.0%), and prevalence among male students ranged from 6.1% to 23.1% (median: 11.5%) (Table 28). Used Smokeless Tobacco on School PropertyAcross surveys, the overall percentage of students who had used smokeless tobacco (e.g., chewing tobacco, snuff, or dip) on school property on at least 1 day during the 30 days before the survey ranged from 3.0% to 31.3% (median: 21.1%). Prevalence among female students ranged from 1.6% to 33.5% (median: 14.1%), and prevalence among male students ranged from 4.3% to 35.0% (median: 28.0%) (Table 28). Drank Alcohol on School PropertyAcross surveys, the overall percentage of students who had drunk at least one drink of alcohol on school property on at least 1 day during the 30 days before the survey ranged from 5.4% to 15.3% (median: 6.8%). Prevalence among female students ranged from 4.6% to 11.7% (median: 5.8%), and prevalence among male students ranged from 5.8% to 18.9% (median: 7.9%) (Table 29). Used Marijuana on School PropertyAcross surveys, the overall percentage of students who had used marijuana on school property one or more times during the 30 days before the survey ranged from 4.5% to 20.9% (median: 10.1%). Prevalence among female students ranged from 2.3% to 15.8% (median: 8.5%), and prevalence among male students ranged from 6.7% to 25.9% (median: 11.0%) (Table 29). Offered, Sold, or Given an Illegal Drug on School PropertyAcross surveys, the overall percentage of students who had been offered, sold, or given an illegal drug by someone on school property during the 12 months before the survey ranged from 24.1% to 36.8% (median: 28.7%). Prevalence among female students ranged from 19.7% to 30.7% (median: 29.0%), and prevalence among male students ranged from 28.3% to 42.3% (median: 30.2%) (Table 30). Sexual Behaviors That Contribute to Unintended Pregnancy and Sexually Transmitted Diseases, Including HIV InfectionEver Had Sexual Intercourse Across surveys, the overall percentage of students who had ever had sexual intercourse ranged from 32.0% to 59.0% (median: 45.0%). Prevalence among female students ranged from 23.4% to 48.2% (median: 45.1%), and prevalence among male students ranged from 42.6% to 72.0% (median: 50.4%) (Table 31). Had First Sexual Intercourse Before Age 13 YearsAcross surveys, the overall percentage of students who had sexual intercourse for the first time before age 13 years ranged from 7.4% to 9.8% (median: 8.3%). Prevalence among female students ranged from 3.0% to 6.5% (median: 3.8%), and prevalence among male students ranged from 10.1% to 17.1% (median: 13.2%) (Table 31). Had Sexual Intercourse with Four or More Persons During Their LifeAcross surveys, the overall percentage of students who had had sexual intercourse with four or more persons during their life ranged from 11.0% to 19.2% (median: 14.7%). Prevalence among female students ranged from 4.7% to 10.4% (median: 9.7%), and prevalence among male students ranged from 12.2% to 30.8% (median: 19.6%) (Table 32). Currently Sexually ActiveAcross surveys, the overall percentage of students who had had sexual intercourse with at least one person during the 3 months before the survey (i.e., currently sexually active) ranged from 20.0% to 39.3% (median: 29.9%). Prevalence among female students ranged from 14.4% to 34.0% (median: 32.8%), and prevalence among male students ranged from 26.6% to 45.4% (median: 34.3%) (Table 32). Condom UseAcross surveys, among students who were currently sexually active, the overall percentage of students who reported that either they or their partner had used a condom during last sexual intercourse ranged from 35.1% to 50.2% (median: 41.2%). Prevalence among female students ranged from 27.0% to 47.5% (median: 34.3%), and prevalence among male students ranged from 44.6% to 52.8% (median: 46.2%) (Table 33). Birth Control Pill UseAcross surveys, among students who were currently sexually active, the overall percentage of students who reported that either they or their partner had used birth control pills to prevent pregnancy before last sexual intercourse ranged from 3.8% to 10.5% (median: 7.8%). Prevalence among female students ranged from 4.0% to 8.7% (median: 6.0%), and prevalence among male students ranged from 2.9% to 12.4% (median: 8.8%) (Table 33). Drank Alcohol or Used Drugs Before Last Sexual IntercourseAcross surveys, among students who were currently sexually active, the overall percentage of students who had drunk alcohol or used drugs before last sexual intercourse ranged from 17.0% to 36.3% (median: 33.8%). Prevalence among female students ranged from 11.2% to 27.3% (median: 23.0%), and prevalence among male students ranged from 24.2% to 40.5% (median: 37.8%) (Table 34). Were Taught in School About AIDS or HIV InfectionAcross surveys, the overall percentage of students who had ever been taught in school about acquired immunodeficiency syndrome (AIDS) or HIV infection ranged from 46.0% to 85.2% (median: 78.8%). Prevalence among female students ranged from 44.6% to 87.9% (median: 77.1%), and prevalence among male students ranged from 47.3% to 82.9% (median: 79.9%) (Table 34). Dietary BehaviorsAte Fruits and Vegetables Five or More Times per Day Across surveys, the overall percentage of students who had eaten fruits and vegetables** five or more times per day during the 7 days before the survey ranged from 16.4% to 27.2% (median: 20.5%). Prevalence among female students ranged from 16.5% to 27.3% (median: 17.6%), and prevalence among male students ranged from 16.0% to 27.1% (median: 23.3%) (Table 35). Drank Three or More Glasses per Day of MilkAcross surveys, the overall percentage of students who had drunk three or more glasses per day of milk during the 7 days before the survey ranged from 6.5% to 15.9% (median: 11.5%). Prevalence among female students ranged from 5.1% to 13.5% (median: 8.8%), and prevalence among male students ranged from 7.8% to 18.7% (median: 12.8%) (Table 35). Drank Soda or Pop At Least One Time per DayAcross surveys, the overall percentage of students who had drunk a can, bottle, or glass of soda or pop (not including diet soda or diet pop) at least one time per day during the 7 days before the survey ranged from 22.1% to 37.6% (median: 34.9%). Prevalence among female students ranged from 22.1% to 39.1% (median: 35.9%), and prevalence among male students ranged from 22.3% to 39.1% (median: 30.5%) (Table 36). Physical ActivityMet Recommended Levels of Physical Activity Across surveys, the overall percentage of students who had been physically active doing any kind of physical activity that increased their heart rate and made them breathe hard some of the time for a total of at least 60 minutes per day on 5 or more days during the 7 days before the survey (i.e., met recommended levels of physical activity) (9) ranged from 22.8% to 36.0% (median: 31.1%). Prevalence among female students ranged from 17.9% to 29.6% (median: 24.7%), and prevalence among male students ranged from 28.0% to 42.8% (median: 36.9%) (Table 37). Did Not Participate in 60 or More Minutes of Physical Activity on Any DayAcross surveys, the overall percentage of students who did not participate in 60 or more minutes of any kind of physical activity that increased their heart rate and made them breathe hard some of the time on at least 1 day during the 7 days before the survey (i.e., did not participate in 60 or more minutes of physical activity on any day) ranged from 19.5% to 30.6% (median: 20.8%). Prevalence among female students ranged from 23.5% to 30.8% (median: 24.9%), and prevalence among male students ranged from 16.0% to 30.3% (median: 16.6%) (Table 37). Used Computers 3 or More Hours per DayAcross surveys, the overall percentage of students who played video or computer games or used a computer for something that was not school work for 3 or more hours per day on an average school day (i.e., used computers 3 or more hours per day) ranged from 17.7% to 32.7% (median: 25.4%). Prevalence among female students ranged from 12.7% to 33.0% (median: 23.3%), and prevalence among male students ranged from 22.8% to 32.2% (median: 27.8%) (Table 38). Watched Television 3 or More Hours per DayAcross surveys, the overall percentage of students who watched television 3 or more hours per day on an average school day ranged from 19.3% to 36.9% (median: 32.1%). Prevalence among female students ranged from 18.1% to 40.7% (median: 32.9%), and prevalence among male students ranged from 20.4% to 33.7% (median: 31.5%) (Table 38). Attended Physical Education ClassesAcross surveys, the overall percentage of students who went to physical education (PE) classes on 1 or more days in an average week when they were in school (i.e., attended PE classes) ranged from 44.4% to 57.8% (median: 45.4%). Prevalence among female students ranged from 39.4% to 57.7% (median: 44.2%), and prevalence among male students ranged from 46.2% to 61.1% (median: 51.7%) (Table 39). Attended Physical Education Classes DailyAcross surveys, the overall percentage of students who went to PE classes 5 days in an average week when they were in school (i.e., attended PE classes daily) ranged from 10.7% to 30.7% (median: 25.9%). Prevalence among female students ranged from 9.4% to 28.6% (median: 26.9%), and prevalence among male students ranged from 11.9% to 34.5% (median: 23.2%) (Table 39). Played on at Least One Sports TeamAcross surveys, the overall percentage of students who had played on at least one sports team (run by their school or community groups) during the 12 months before the survey ranged from 41.8% to 66.3% (median: 55.4%). Prevalence among female students ranged from 31.3% to 64.4% (median: 47.2%), and prevalence among male students ranged from 50.4% to 71.6% (median: 64.0%) (Table 40). Obesity, Overweight, and Weight ControlObese Across surveys, the overall percentage of students who were obese ranged from 11.3% to 38.6% (median: 15.9%). Prevalence among female students ranged from 8.8% to 35.5% (median: 12.9%), and prevalence among male students ranged from 13.9% to 41.6% (median: 20.6%) (Table 41). OverweightAcross surveys, the overall percentage of students who were overweight ranged from 15.0% to 19.9% (median: 15.4%). Prevalence among female students ranged from 15.4% to 22.3% (median: 17.5%), and prevalence among male students ranged from 12.8% to 17.7% (median: 15.2%) (Table 41). Described Themselves as OverweightAcross surveys, the overall percentage of students who described themselves as slightly or very overweight ranged from 9.2% to 30.1% (median: 22.6%). Prevalence among female students ranged from 8.9% to 32.3% (median: 27.1%), and prevalence among male students ranged from 9.6% to 28.1% (median: 18.0%) (Table 42). Were Trying to Lose WeightAcross surveys, the overall percentage of students who were trying to lose weight ranged from 30.7% to 54.4% (median: 48.4%). Prevalence among female students ranged from 34.2% to 60.6% (median: 58.2%), and prevalence among male students ranged from 27.3% to 48.1% (median: 38.8%) (Table 42). Ate Less Food, Fewer Calories, or Low-Fat Foods to Lose Weight or to Keep From Gaining WeightAcross surveys, the overall percentage of students who had eaten less food, fewer calories, or low-fat foods to lose weight or to keep from gaining weight during the 30 days before the survey ranged from 38.9% to 52.5% (median: 42.4%). Prevalence among female students ranged from 37.7% to 50.9% (median: 46.0%), and prevalence among male students ranged from 34.2% to 54.3% (median: 47.4%) (Table 43). Exercised to Lose Weight or to Keep From Gaining WeightAcross surveys, the overall percentage of students who had exercised to lose weight or to keep from gaining weight during the 30 days before the survey ranged from 56.9% to 68.4% (median: 63.3%). Prevalence among female students ranged from 51.0% to 67.5% (median: 61.6%), and prevalence among male students ranged from 62.2% to 69.3% (median: 63.4%) (Table 43). Did Not Eat for 24 or More Hours to Lose Weight or to Keep From Gaining WeightAcross surveys, the overall percentage of students who did not eat for 24 or more hours to lose weight or to keep from gaining weight during the 30 days before the survey ranged from 16.2% to 34.5% (median: 25.8%). Prevalence among female students ranged from 19.1% to 34.7% (median: 24.4%), and prevalence among male students ranged from 13.3% to 34.5% (median: 27.1%) (Table 44). Took Diet Pills, Powders, or Liquids to Lose Weight or to Keep From Gaining WeightAcross surveys, the overall percentage of students who had taken diet pills, powders, or liquids without a doctor's advice to lose weight or to keep from gaining weight during the 30 days before the survey ranged from 5.7% to 24.4% (median: 12.0%). Prevalence among female students ranged from 5.2% to 22.0% (median: 8.8%), and prevalence among male students ranged from 6.2% to 26.9% (median: 10.8%) (Table 44). Vomited or Took Laxatives to Lose Weight or to Keep From Gaining WeightAcross surveys, the overall percentage of students who had vomited or taken laxatives to lose weight or to keep from gaining weight during the 30 days before the survey ranged from 7.6% to 25.0% (median: 13.5%). Prevalence among female students ranged from 9.1% to 23.6% (median: 9.5%), and prevalence among male students ranged from 5.9% to 26.5% (median: 12.1%) (Table 45). AsthmaLifetime Asthma Across surveys, the overall percentage of students who had ever been told by a doctor or nurse that they had asthma (i.e., lifetime asthma) ranged from 15.6% to 18.5% (median: 16.2%). Prevalence among female students ranged from 14.4% to 16.1% (median: 15.0%), and prevalence among male students ranged from 16.3% to 20.7% (median: 17.9%) (Table 46). Current AsthmaAcross surveys, the overall percentage of students who had lifetime asthma and still had asthma (i.e., current asthma) ranged from 5.7% to 6.5% (median: 5.8%). Prevalence among female students ranged from 5.4% to 6.6% (median: 6.4%), and prevalence among male students ranged from 5.2% to 6.5% (median: 5.9%) (Table 46). DiscussionAcross territories, prevalence does not vary substantially for the majority of risk behaviors. However, a range of 25 or more percentage points or a fivefold variation or greater was identified for the following risk behaviors:
These variations might occur, in part, because of differences in territorial laws and policies, enforcement practices, access to illegal drugs, availability of effective school and community interventions, prevailing behavioral and social norms, demographic characteristics of the population, and adult practices. Longitudinal research is needed to better understand the effect of these factors on the development and prevalence of risk behaviors. LimitationsThe findings in this report are subject to at least three limitations. First, these data apply only to youth who attend school and, therefore, are not representative of all persons in this age group. In the Pacific Island territories, the civilian population aged 16--19 years who were not enrolled in school and were not high school graduates ranged from 14% to 30% (median: 17%) (10).†† Second, the extent of underreporting or overreporting of behaviors cannot be determined, although the survey questions demonstrate good test-retest reliability (3). Third, BMI is calculated on the basis of self-reported height and weight and, therefore, tends to underestimate the prevalence of obesity and overweight (6). ConclusionYRBS data collected by the Pacific Island territories will be used for decision making and evidence-based program planning. Education agencies in the territories use the YRBS data to establish health education and health promotion goals, to support curricular modifications, to support legislation that promotes health, and to seek funding for new initiatives. References
* Data only available for American Samoa, Commonwealth of the Northern Mariana Islands, and Guam. † A questionnaire that fails quality control has less than 20 remaining responses after editing or has the same answer to 15 or more questions in a row. § Pellet-sized pieces of highly purified cocaine. ¶ A process in which cocaine is dissolved in ether or sodium hydroxide and the precipitate is filtered off. ** 100% fruit juice, fruit, green salad, potatoes (excluding French fries, fried potatoes, or potato chips), carrots, or other vegetables. †† Data only available for American Samoa, Commonwealth of the Northern Mariana Islands, and Guam.
Territorial Youth Risk Behavior Survey CoordinatorsAmerican Samoa, Donna Gurr, American Samoa Department of Education; Guam, Elosie Sanchez, Guam Department of Education; Marshall Islands, Gideon Gideon, Ministry of Education; Northern Mariana Islands, Jackie Quitugua, Public School System; Palau, Debbie Rebluud Nagata, Ministry of Education. Table 1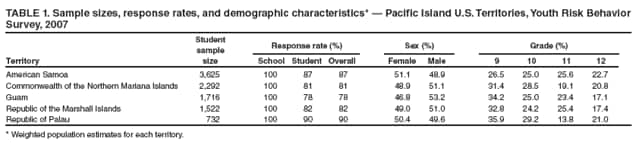 Return to top. Table 2 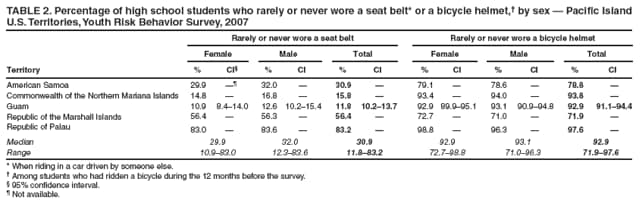 Return to top. Table 3 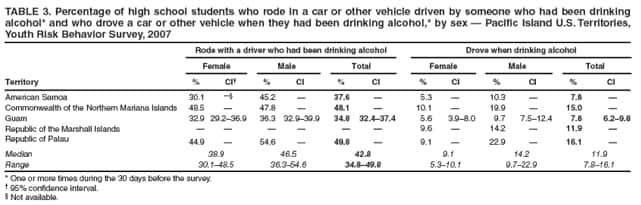 Return to top. Table 4 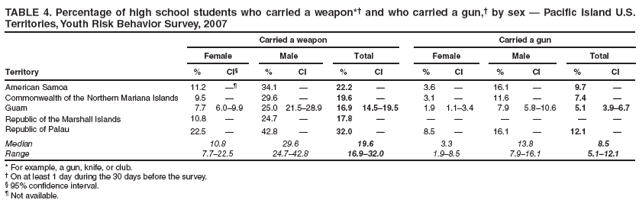 Return to top. Table 5 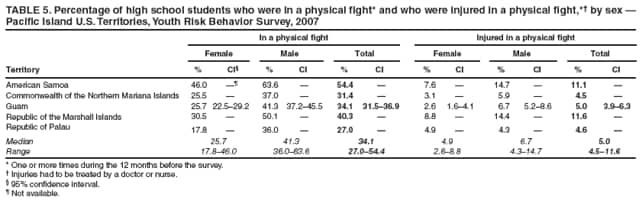 Return to top. Table 6 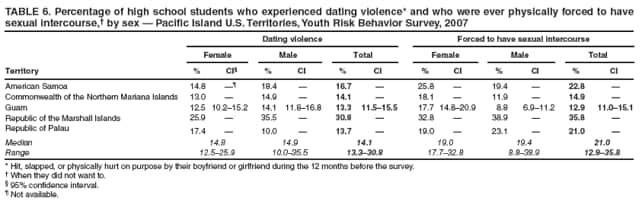 Return to top. Table 7 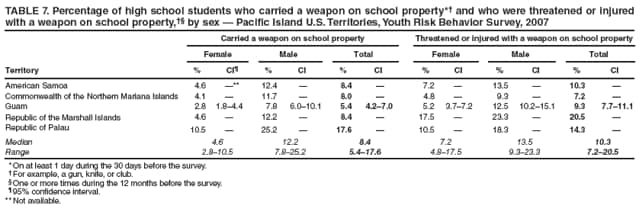 Return to top. Table 8 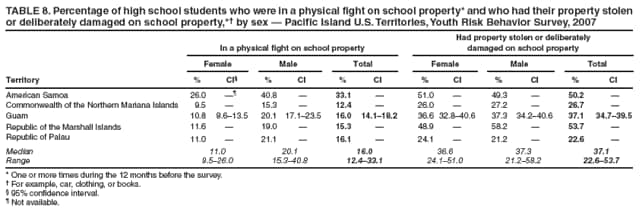 Return to top. Table 9 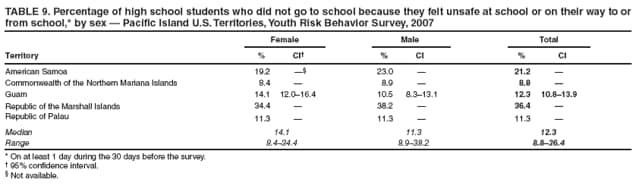 Return to top. Table 10 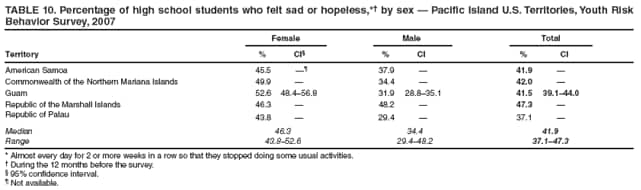 Return to top. Table 11 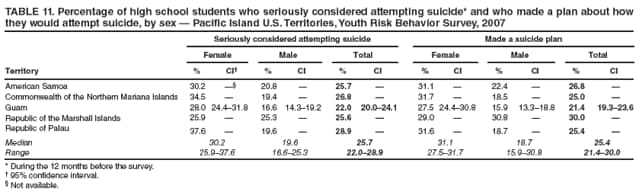 Return to top. Table 12 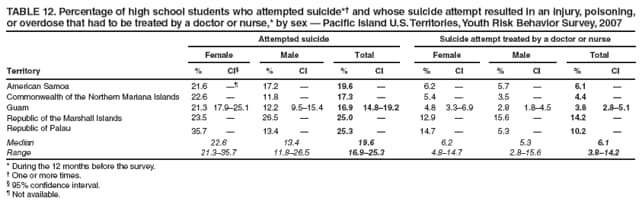 Return to top. Table 13 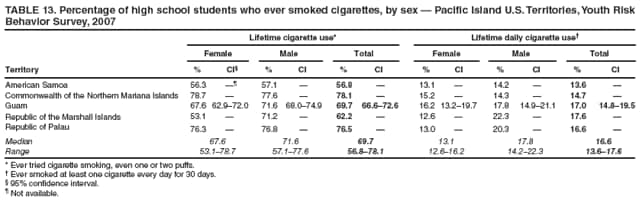 Return to top. Table 14 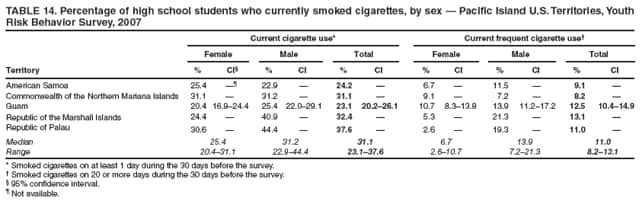 Return to top. Table 15 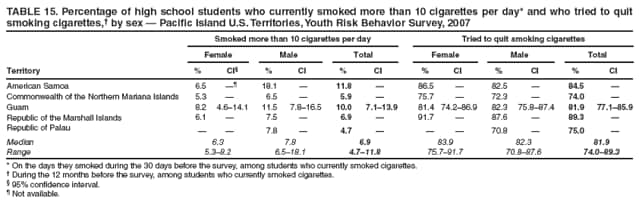 Return to top. Table 16 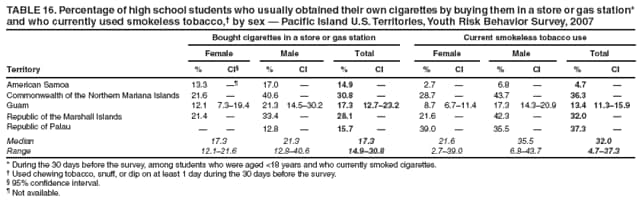 Return to top. Table 17 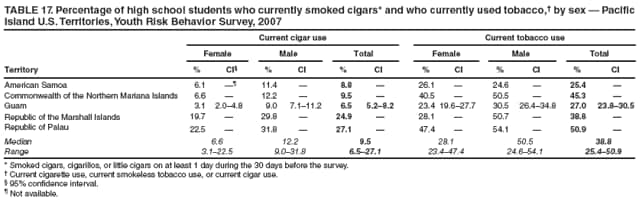 Return to top. Table 18 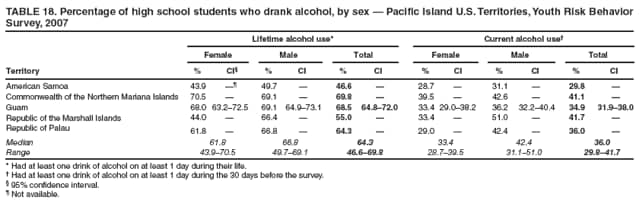 Return to top. Table 19 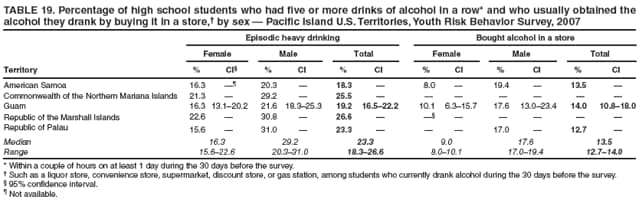 Return to top. Table 20 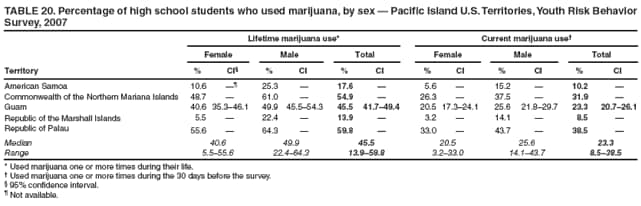 Return to top. Table 21 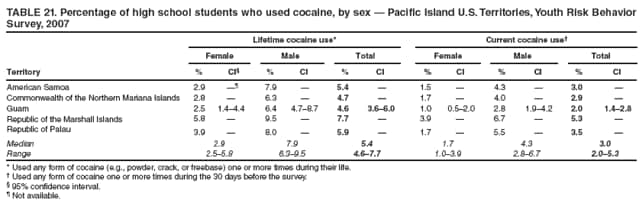 Return to top. Table 22 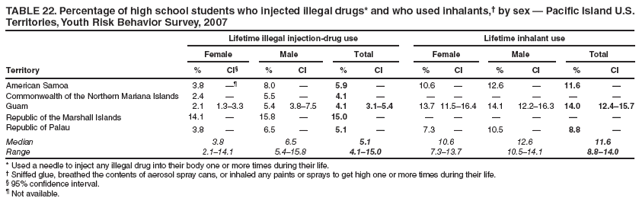 Return to top. Table 23 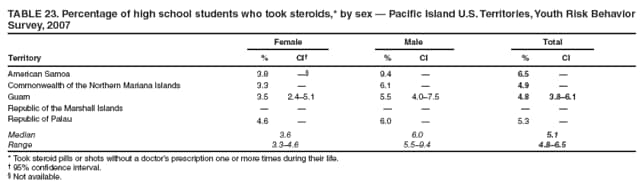 Return to top. Table 24 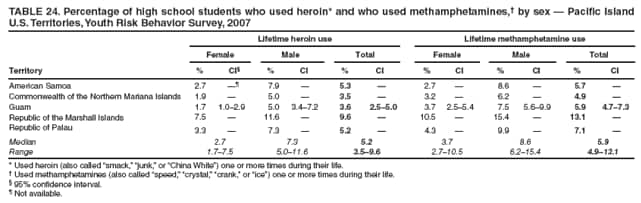 Return to top. Table 25 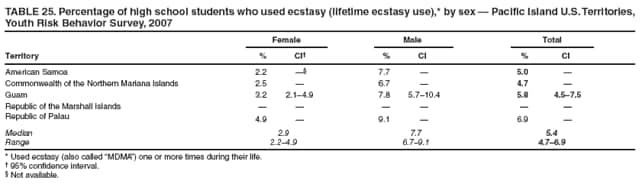 Return to top. Table 26 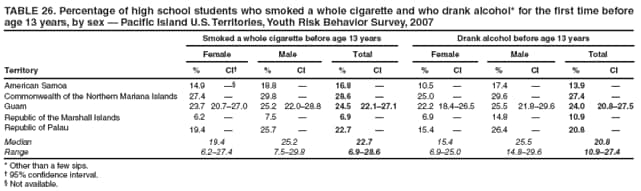 Return to top. Table 27 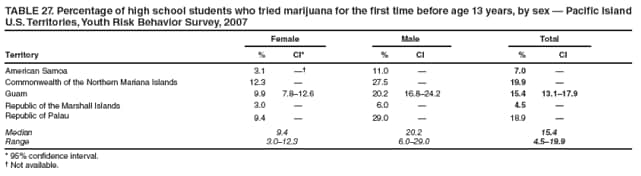 Return to top. Table 28 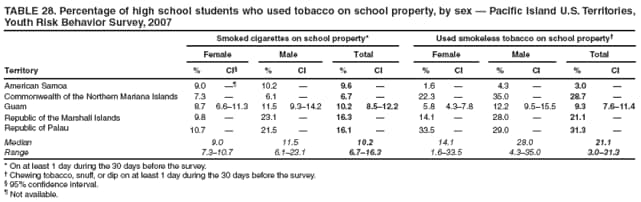 Return to top. Table 29 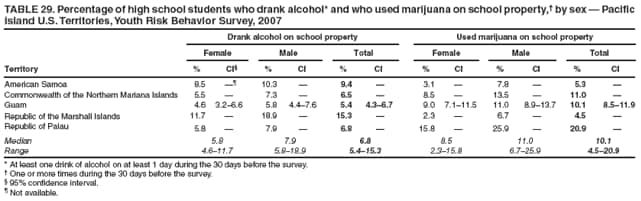 Return to top. Table 30 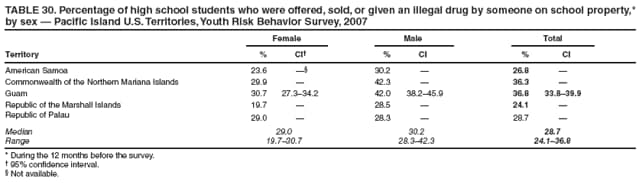 Return to top. Table 31 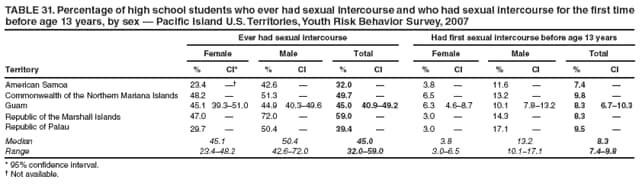 Return to top. Table 32 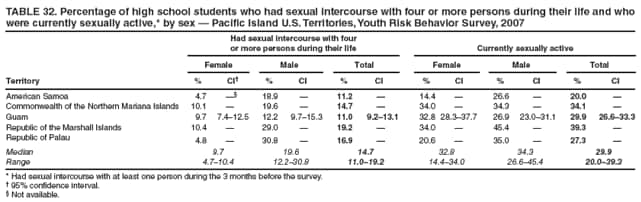 Return to top. Table 33 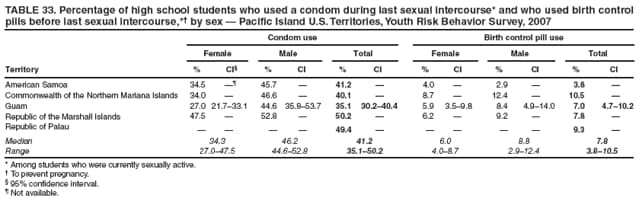 Return to top. Table 34 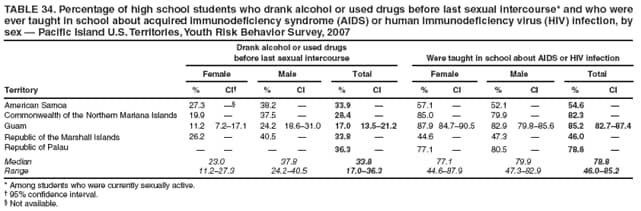 Return to top. Table 35 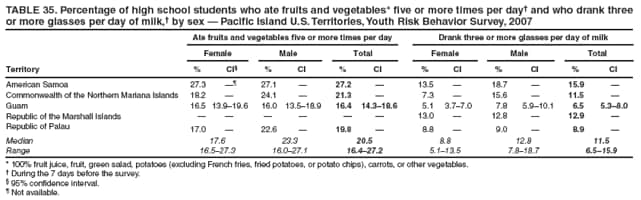 Return to top. Table 36 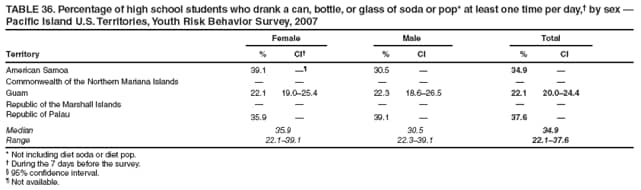 Return to top. Table 37 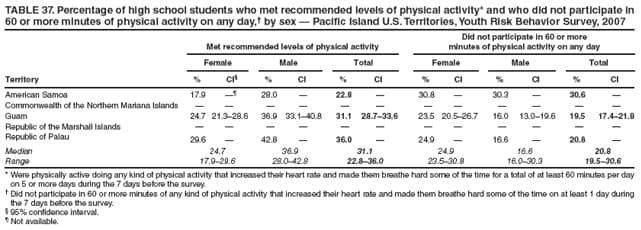 Return to top. Table 38 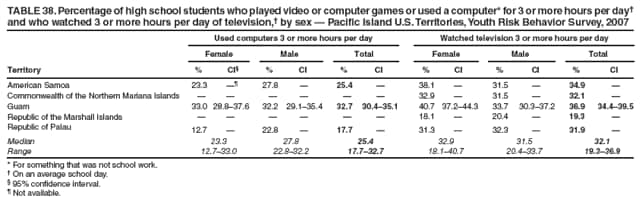 Return to top. Table 39 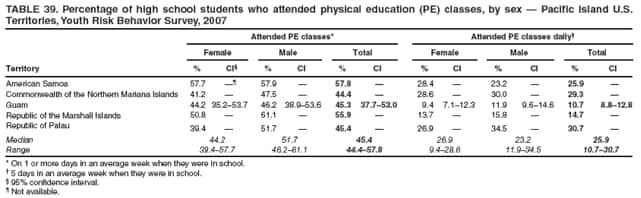 Return to top. Table 40 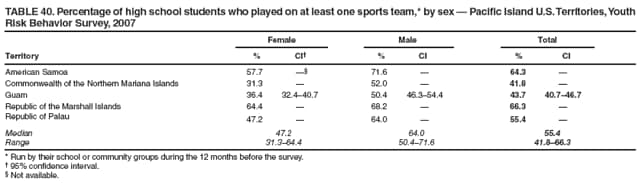 Return to top. Table 41 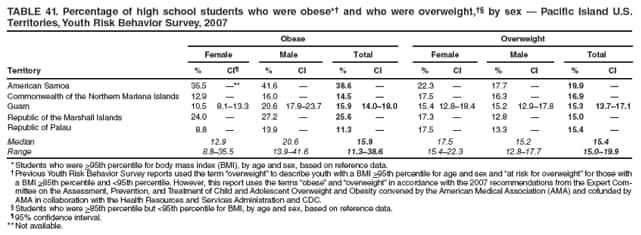 Return to top. Table 42 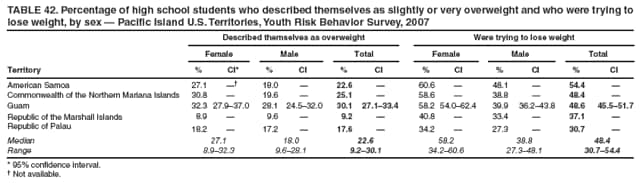 Return to top. Table 43 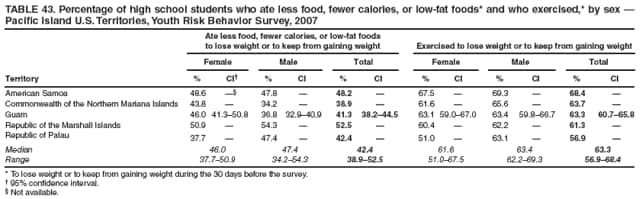 Return to top. Table 44 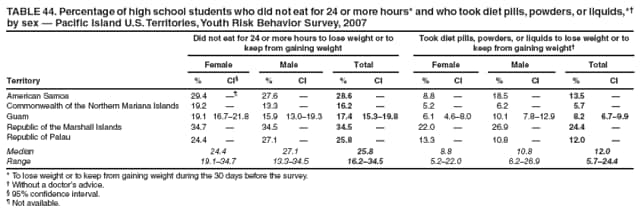 Return to top. Table 45 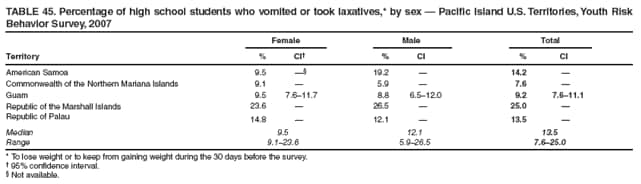 Return to top. Table 46 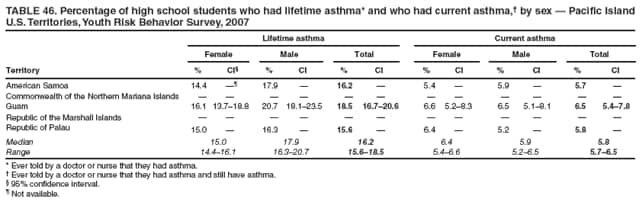 Return to top.
All MMWR HTML versions of articles are electronic conversions from typeset documents. This conversion might result in character translation or format errors in the HTML version. Users are referred to the electronic PDF version (http://www.cdc.gov/mmwr) and/or the original MMWR paper copy for printable versions of official text, figures, and tables. An original paper copy of this issue can be obtained from the Superintendent of Documents, U.S. Government Printing Office (GPO), Washington, DC 20402-9371; telephone: (202) 512-1800. Contact GPO for current prices. **Questions or messages regarding errors in formatting should be addressed to mmwrq@cdc.gov.Date last reviewed: 11/12/2008 |
|||||||||
|