Skip Navigation LinksSkip Navigation Links
Centers for Disease Control and Prevention
Safer Healthier People
Blue White
Blue White
bottom curve
CDC Home Search Health Topics A-Z spacer spacer
spacer
Blue curve MMWR spacer
spacer
spacer

Persons using assistive technology might not be able to fully access information in this file. For assistance, please send e-mail to: mmwrq@cdc.gov. Type 508 Accommodation and the title of the report in the subject line of e-mail.

Youth Risk Behavior Surveillance --- Selected Steps Communities, United States, 2007

Shari Shanklin, MPH1
Nancy D. Brener, PhD1
Laura Kann, PhD1
Shannon Griffin-Blake, PhD2
Ann Ussery-Hall, MPH3,4
Alyssa Easton, PhD2
Erica Barrett, MBA3,4
Joseph Hawkins, MA5
William A. Harris, MM1
Tim McManus, MS1
1
Division of Adolescent and School Health, National Center for Chronic Disease Prevention and Health Promotion, CDC
2Division of Adult and Community Health, National Center for Chronic Disease Prevention and Health Promotion, CDC
3Northrop Grumman, Atlanta, Georgia
4The Ginn Group, Atlanta, Georgia
5Westat, Rockville, Maryland

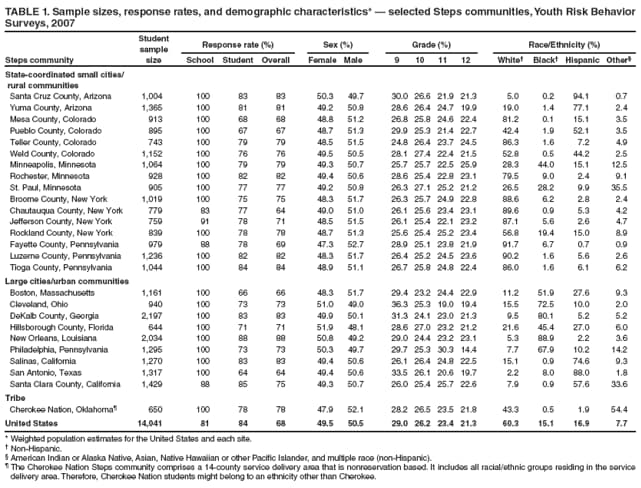
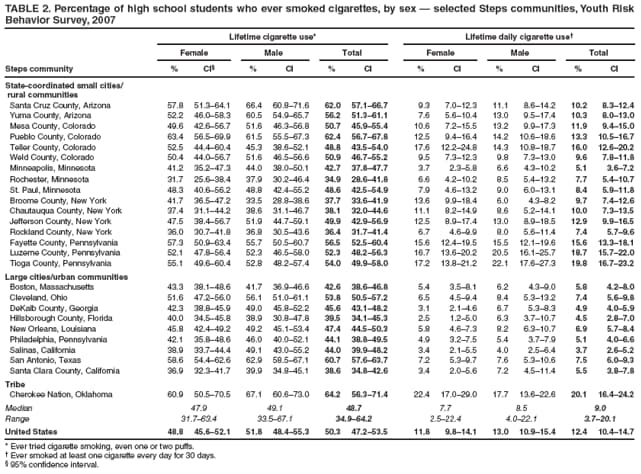
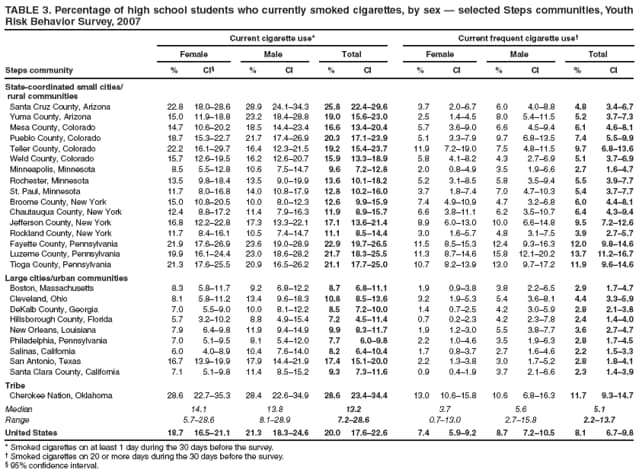
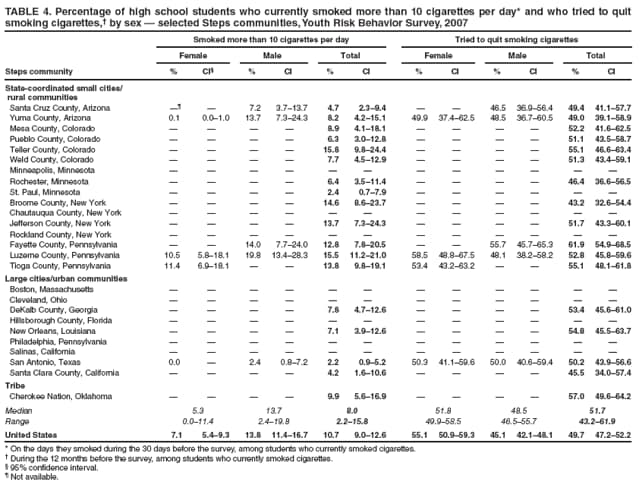
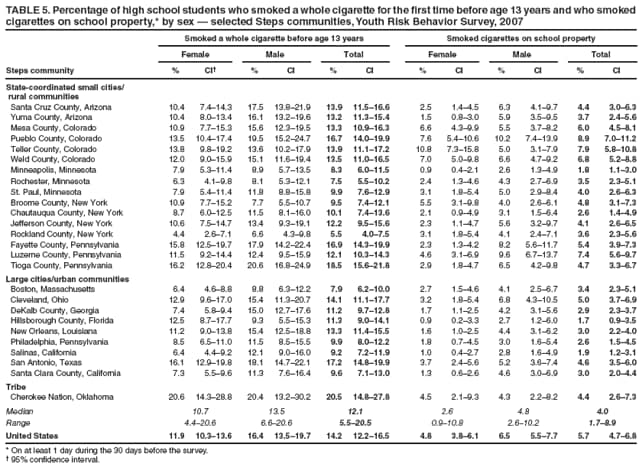
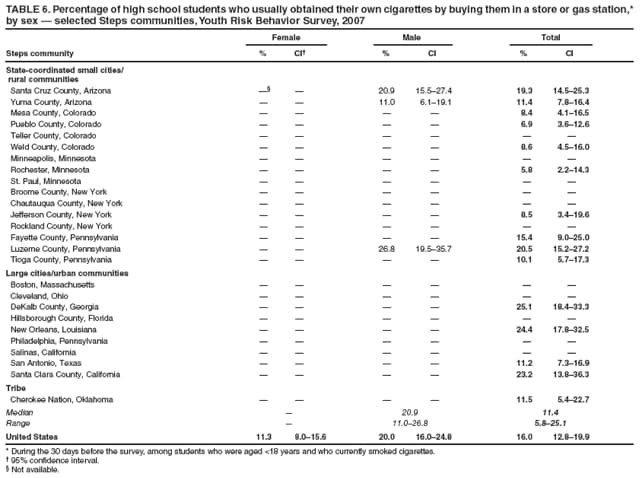
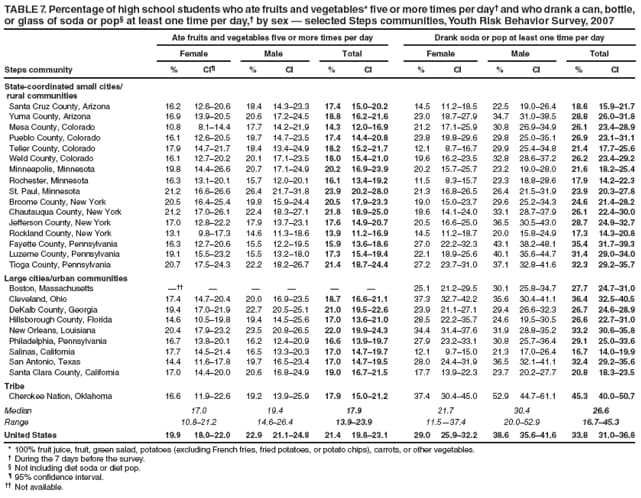
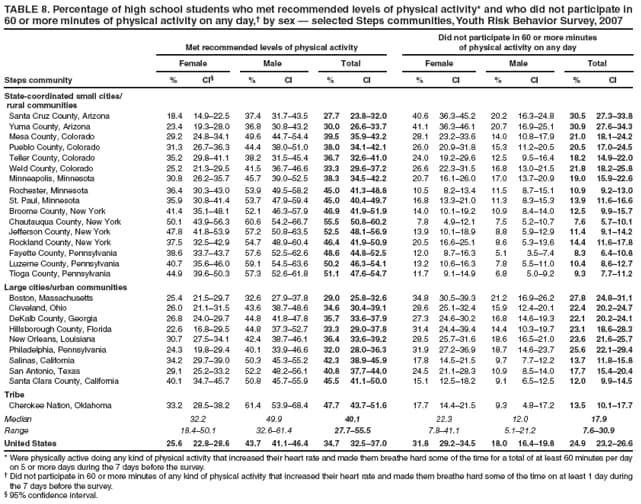
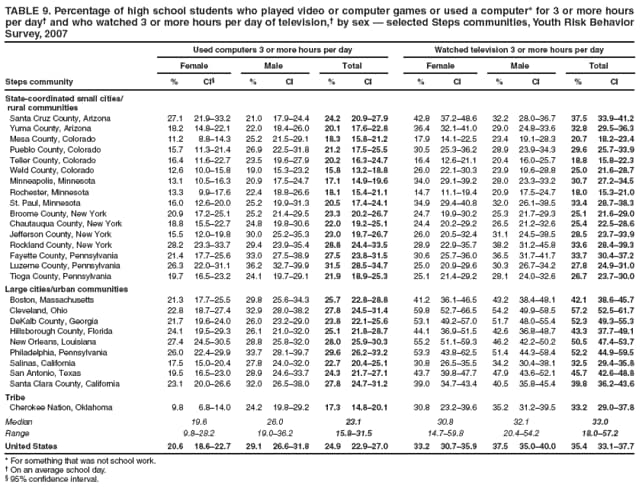
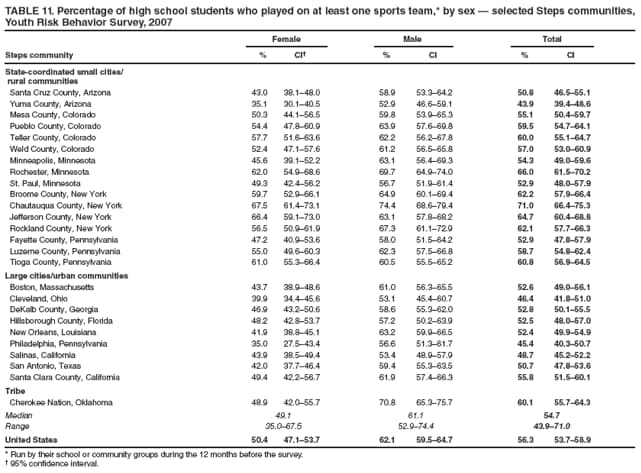
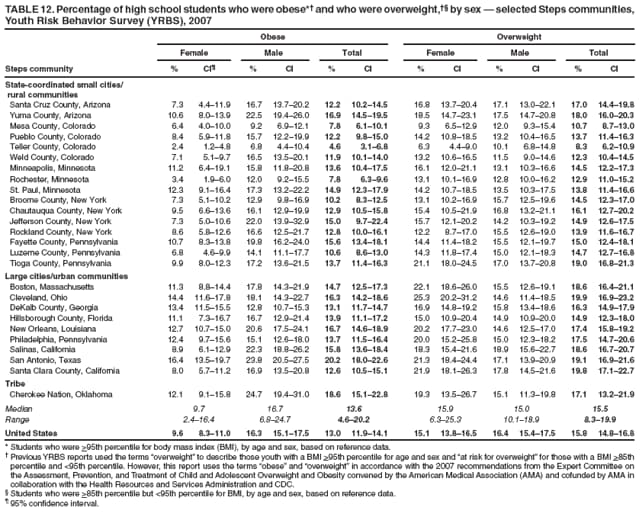
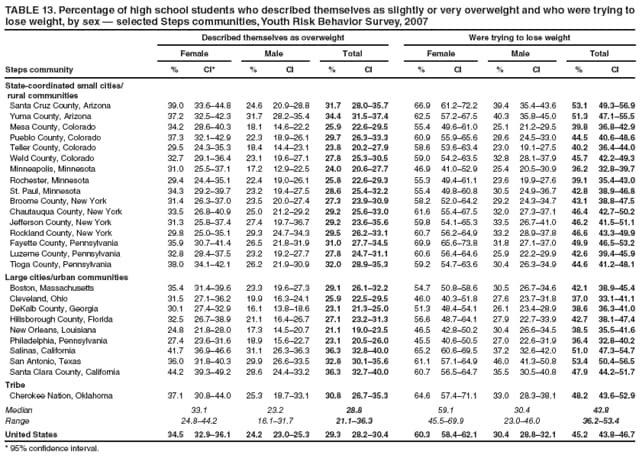
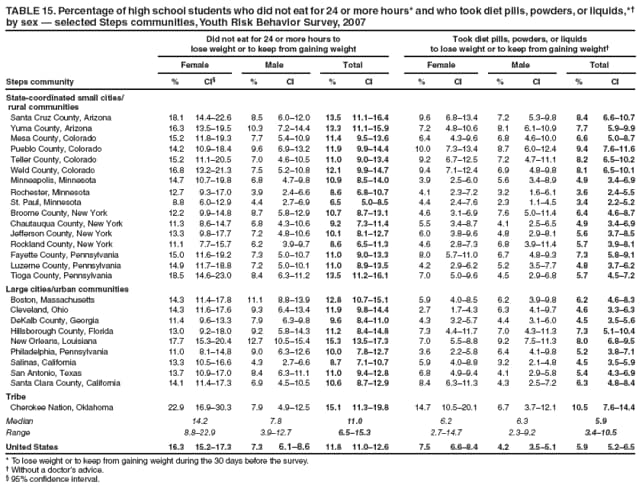
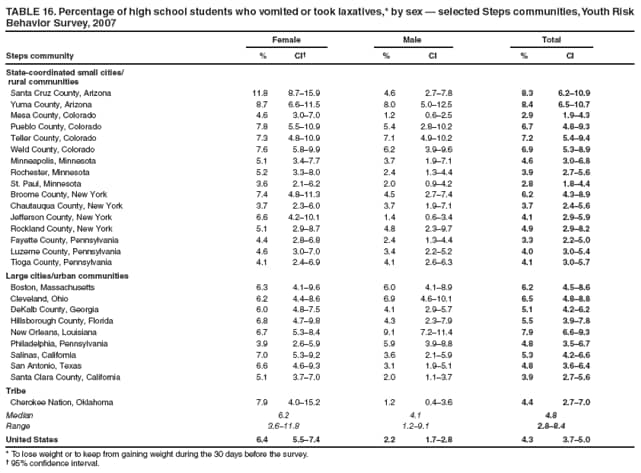
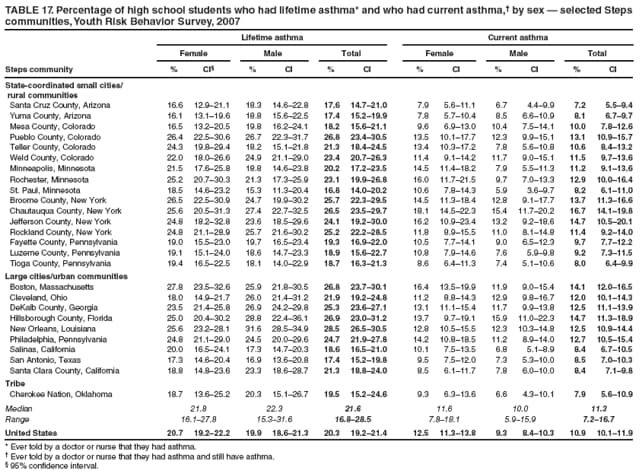
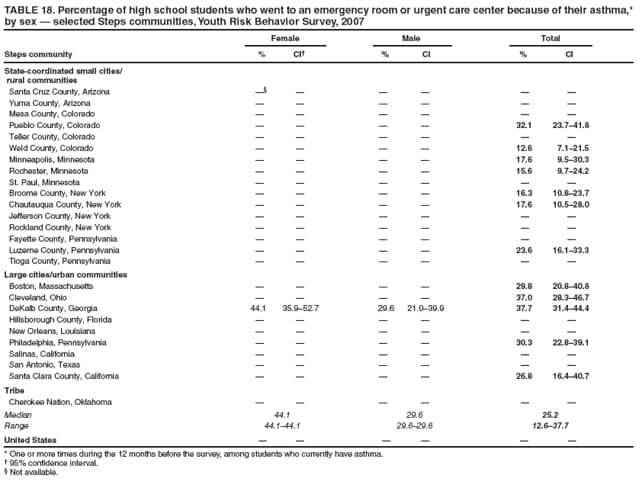
Corresponding author: Shari Shanklin, MPH, Division of Adolescent and School Health, National Center for Chronic Disease Prevention and Health Promotion, MS K-33, 4770 Buford Hwy., NE, Atlanta, GA 30341. Telephone: 770-488-6104; Fax: 770-488-6156; E-mail: bsa7@cdc.gov.

Abstract

Problem: Priority health-risk behaviors, including tobacco use, unhealthy dietary behaviors, and physical inactivity often are established during childhood and adolescence, extend into adulthood, are interrelated, and are preventable. These behaviors contribute to chronic disease and other health conditions, including asthma.

Reporting Period Covered: January--May 2007.

Description of System: The Youth Risk Behavior Surveillance System (YRBSS) monitors priority health-risk behaviors and the prevalence of obesity and asthma among youth and young adults. YRBSS includes a national school-based survey conducted by CDC and state and local school-based surveys conducted by state and local education and health agencies.

In 2007, as a component of YRBSS, communities participating in the Steps Cooperative Agreement Program (Steps Program) also conducted school-based surveys of students in grades 9--12 in their program intervention areas. These communities used a standard questionnaire that measured tobacco use, dietary behaviors, and physical activity and monitored the prevalence of obesity and asthma. This report summarizes results from surveys of students in 26 Steps communities that conducted surveys in 2007.

Results: Results from the 26 Steps communities indicated that a substantial proportion of adolescents engaged in health-risk behaviors that increased their likelihood of becoming obese. During 2007, across surveys, the percentage of high school students who had ever smoked at least one cigarette every day for 30 days ranged from 3.7% to 20.1% (median: 9.0%), the percentage who had eaten fruits and vegetables five or more times per day during the 7 days before the survey ranged from 13.9% to 23.9% (median: 17.9%), and the percentage who met recommended levels of physical activity ranged from 27.7% to 55.5% (median: 40.1%). Across surveys, the percentage of students who were obese ranged from 4.6% to 20.2% (median: 13.6%), and the percentage of students who had ever been told by a doctor or nurse that they had asthma ranged from 16.8% to 28.5% (median: 21.6%).

Interpretation: Although the prevalence of many health-risk behaviors and health conditions related to obesity and asthma varies across Steps communities, a substantial proportion of high school students engage in behaviors that place them at risk for chronic disease.

Public Health Action: Steps Program staff at the national, tribal, state, and local levels will use YRBSS data for decision making, program planning, and enhancing technical assistance to reduce tobacco use and exposure and to increase healthy eating and physical activity. These data will be used to help focus existing programs on activities that have shown the greatest promise of results, as well as identify populations of greatest need and opportunities for strategic collaboration to identify and disseminate lessons learned.

Introduction

The Steps Cooperative Agreement Program (Steps Program) is a national, multilevel chronic disease prevention effort coordinated by CDC. Through this program, Steps communities (i.e., small cities or rural areas whose activities are coordinated by a state health department, large cities or urban areas, and tribes or tribal entities) receive funds to implement chronic disease prevention and health promotion activities focused on reducing the burden of obesity, diabetes, and asthma and addressing three related risk behaviors: tobacco use, unhealthy dietary behaviors, and physical inactivity.

To measure program outcomes and assess progress toward program goals, Steps communities participate in existing surveillance systems, including the Youth Risk Behavior Surveillance System (YRBSS). CDC developed YRBSS to monitor six categories of priority health-risk behaviors among youth and young adults, including behaviors that contribute to unintentional injuries and violence; tobacco use; alcohol and other drug use; sexual behaviors that contribute to unintended pregnancy and sexually transmitted diseases (STDs), including human immunodeficiency virus (HIV) infections; unhealthy dietary behaviors; and physical inactivity. In addition, YRBSS monitors the prevalence of obesity and asthma. YRBSS includes a national school-based survey conducted by CDC and state, territorial, tribal, and local school-based surveys conducted by state, territorial, tribal, and local education and health agencies; surveys have been conducted biennially since 1991. Steps communities participating in YRBSS use a modified standard questionnaire that measures tobacco use, dietary behaviors, and physical activity and monitors the prevalence of obesity and asthma. Participation in YRBSS provides community-level data on risk behaviors; high-quality data that are comparable across Steps communities, states, and the nation; and a consistent, stable source of data that will enable programs to monitor progress.

In 2003, the Steps Program funded 12 programs representing 24 communities. In 2004, the Steps Program funded 10 additional programs representing 16 communities. This report summarizes results from the 26 Steps communities funded in 2003 and 2004 that obtained weighted data for the 2007 YRBSS cycle and granted CDC permission to publish their data. Results from community surveys that did not obtain weighted data are not included in this report. All surveys were conducted during spring 2007.

Methods

Sampling

Each community school-based survey employed a two-stage cluster sample design to produce a representative sample of public school students in grades 9--12 in its program intervention area.* In the first sampling stage, all schools with any students in grades 9--12 were selected in 24 communities; in two communities (Cleveland, OH, and Cherokee Nation), schools with any students in grades 9--12 were selected with probability proportional to school enrollment size. In the second sampling stage, intact classes from either a required subject (e.g., English or social studies) or a required period (e.g., homeroom or second period) were selected randomly, and all students in selected classes were eligible to participate. Community surveys that had a scientifically selected sample of students, appropriate documentation, and an overall response rate of 60% or higher were weighted. A weight was applied to each record to adjust for student nonresponse and the distribution of students by grade, sex, and race/ethnicity in each jurisdiction. Therefore, weighted estimates are representative of all students in grades 9--12 attending public schools in each Steps community.

In 2007, a total of 26 communities had weighted data and granted permission to include their data in this report. Student sample sizes ranged from 644 to 2,197 (Table 1). School response rates ranged from 83% to 100%; student response rates ranged from 64% to 88%; and overall response rates, calculated by multiplying the school response rate by the student response rate, ranged from 64% to 88%.

Sixteen of the 26 communities for which results are provided in this report are small cities or rural communities, nine are large cities or urban communities, and one is a tribe. Race/ethnic distributions of students varied across communities (Table 1). In six communities, more than 50% of students are Hispanic; in five communities, more than 50% of students are non-Hispanic black; and in eight communities, more than 80% of students are non-Hispanic white. The Cherokee Nation Steps community comprises a 14-county service delivery area that is nonreservation based. It includes all racial/ethnic groups residing in the service delivery area. Therefore, Cherokee Nation students might belong to an ethnicity other than Cherokee.

For comparison purposes, this report also includes previously published data from the 2007 national school-based Youth Risk Behavior Survey (YRBS) (1). The sampling frame for the 2007 national YRBS consisted of all public and private schools with students in at least one of grades 9--12 in the 50 states and the District of Columbia. A three-stage cluster sample design produced a nationally representative sample of students in grades 9--12 who attended public and private schools. For the 2007 national YRBS, 14,103 questionnaires were completed in 157 schools. The school response rate was 81%, the student response rate was 84%, and the overall response rate was 68%. Additional information about the national YRBS sample has been published previously (1).

Data Collection Procedures and Questionnaire

Procedures for both the national and the Steps YRBS were designed to protect students' privacy by allowing for anonymous and voluntary participation. Before survey administration, local parental permission procedures were followed. Students completed the self-administered questionnaire during one class period and recorded their responses directly on a computer-scannable booklet or answer sheet. A detailed explanation of the YRBSS methodology and questionnaire development has been published previously (2).

The national YRBS questionnaire contained 98 questions, and the standard Steps questionnaire contained 36 of these questions and one question to monitor the prevalence of emergency room or urgent care center visits among those students who currently have asthma. Communities could add questions to the standard questionnaire. Skip patterns were not included in any questionnaire to protect student privacy by ensuring all students completed the questionnaire in approximately the same amount of time. Only data from standard Steps questions are provided in this report. Information about the reliability of the standard questions has been published previously (3).

Data Processing and Coding

Each community data set and the national data set were cleaned and edited for inconsistencies. Missing data were not imputed statistically. Among Steps community data sets, the number of completed questionnaires that failed quality-control checks§ and were excluded from analysis ranged from 0 to 19 (median: 6.5). Of the 14,103 completed questionnaires from the national YRBS, 62 failed quality control and were excluded from analysis, leaving 14,041 usable questionnaires (Table 1).

Race/ethnicity was computed from two questions: 1) "Are you Hispanic or Latino?" (response options were "yes" or "no"), and 2) "What is your race?" (response options were "American Indian or Alaska Native," "Asian," "Black or African American," "Native Hawaiian or Other Pacific Islander," or "White"). For the second question, students could select more than one response option. For this report, students were classified as "Hispanic/Latino" if they answered "yes" to the first question, regardless of how they answered the second question. Students were classified as "black" if they answered "no" to the first question and selected only "Black or African American" to the second question. Students were classified as "white" if they answered "no" to the first question and selected only "White" to the second question. Students were classified as "other" if they answered "no" to the first question and selected "American Indian or Alaska Native," "Asian," or "Native Hawaiian or Other Pacific Islander" or selected more than one response to the second question. Race/ethnicity was set to missing for students who did not answer the first question or for students who answered "no" to the first question and did not answer the second question. Throughout this report, students who self-identified as "Hispanic/Latino" are referred to as "Hispanic" and students who self-identified as "Black or African American" are referred to as "black."

Students were classified as obese or overweight based on their body mass index (kg/m2) (BMI), which was calculated from self-reported height and weight. The BMI values were compared to sex- and age-specific reference data from the 2000 CDC Growth Charts (4). Obese was defined as a BMI of >95th percentile for age and sex. Overweight was defined as a BMI of >85th percentile and <95th percentile for age and sex. Previous YRBS reports used the terms "overweight" to describe those youth with a BMI >95th percentile for age and sex and "at risk for overweight" for those with a BMI >85th percentile and <95th percentile. However, this report uses the terms "obese" and "overweight," respectively, in accordance with the 2007 recommendations from the Expert Committee on the Assessment, Prevention, and Treatment of Child and Adolescent Overweight and Obesity convened by the American Medical Association (AMA) and co-funded by AMA in collaboration with the Health Resources and Services Administration and CDC (5). These classifications are not intended to diagnose individual students as obese or overweight, but rather to provide estimates of obesity and overweight for the population of students surveyed. The reliability and validity of self-reported height and weight among high school students has been described previously (6).

Analytic Methods

Statistical analyses were conducted on weighted data using SAS (7) and SUDAAN (8) software to account for the complex sampling designs. Prevalence estimates and 95% confidence intervals (CIs) were computed for all variables and all data sets. The median prevalence across Steps communities was compared with the prevalence and 95% CI from the national YRBS for each behavior. If the median prevalence was not within the 95% CI for the national estimate, the difference was considered statistically significant.

Results

Tobacco Use

Lifetime Cigarette Use

Across Steps surveys, the overall percentage of students who had ever tried cigarette smoking (even one or two puffs) (i.e., lifetime cigarette use) ranged from 34.9% to 64.2% (median: 48.7%). Prevalence among female students ranged from 31.7% to 63.4% (median: 47.9%), and prevalence among male students ranged from 33.5% to 67.1% (median: 49.1%) (Table 2).

Lifetime Daily Cigarette Use

Across Steps surveys, the overall percentage of students who had ever smoked at least one cigarette every day for 30 days (i.e., lifetime daily cigarette use) ranged from 3.7% to 20.1% (median: 9.0%). Prevalence among female students ranged from 2.5% to 22.4% (median: 7.7%), and prevalence among male students ranged from 4.0% to 22.1% (median: 8.5%) (Table 2).

Current Cigarette Use

Across Steps surveys, the overall percentage of students who had smoked cigarettes on at least 1 day during the 30 days before the survey (i.e., current cigarette use) ranged from 7.2% to 28.6% (median: 13.2%). Prevalence among female students ranged from 5.7% to 28.6% (median: 14.1%), and prevalence among male students ranged from 8.1% to 28.9% (median: 13.8%) (Table 3).

Current Frequent Cigarette Use

Across Steps surveys, the overall percentage of students who had smoked cigarettes on 20 or more days during the 30 days before the survey (i.e., current frequent cigarette use) ranged from 2.2% to 13.7% (median: 5.1%). Prevalence among female students ranged from 0.7% to 13.0% (median: 3.7%), and prevalence among male students ranged from 2.7% to 15.8% (median: 5.6%) (Table 3).

Smoked More than 10 Cigarettes per Day

Across Steps surveys, among students who currently smoked cigarettes, the overall percentage of students who had smoked more than 10 cigarettes per day on the days they smoked during the 30 days before the survey ranged from 2.2% to 15.8% (median: 8.0%). Prevalence among female students ranged from 0.0% to 11.4% (median: 5.3%), and prevalence among male students ranged from 2.4% to 19.8% (median: 13.7%) (Table 4).

Tried to Quit Smoking Cigarettes

Across Steps surveys, among students who currently smoked cigarettes, the overall percentage of students who had tried to quit smoking cigarettes during the 12 months before the survey ranged from 43.2% to 61.9% (median: 51.7%). Prevalence among female students ranged from 49.9% to 58.5% (median: 51.8%), and prevalence among male students ranged from 46.5% to 55.7% (median: 48.5%) (Table 4).

Smoked a Whole Cigarette Before Age 13 Years

Across Steps surveys, the overall percentage of students who had smoked a whole cigarette for the first time before age 13 years ranged from 5.5% to 20.5% (median: 12.1%). Prevalence among female students ranged from 4.4% to 20.6% (median: 10.7%). Prevalence among male students ranged from 6.6% to 20.6% (median: 13.5%) (Table 5).

Smoked Cigarettes on School Property

Across Steps surveys, the overall percentage of students who had smoked cigarettes on school property on at least 1 day during the 30 days before the survey ranged from 1.7% to 8.9% (median: 4.0%). Prevalence among female students ranged from 0.9% to 10.8% (median: 2.6%), and prevalence among male students ranged from 2.6% to 10.2% (median: 4.8%) (Table 5).

Bought Cigarettes in a Store or Gas Station

Across Steps surveys, among students who currently smoked cigarettes and were aged <18 years, the overall percentage of students who usually obtained their own cigarettes by buying them in a store (i.e., a convenience store, supermarket, or discount store) or gas station during the 30 days before the survey ranged from 5.8% to 25.1% (median: 11.4%). Prevalence among male students ranged from 11.0% to 26.8% (median: 20.9%). The prevalence among female students was not available (Table 6).

Dietary Behaviors

Ate Fruits and Vegetables Five or More Times per Day

Across Steps surveys, the overall percentage of students who had eaten fruits and vegetables five or more times per day during the 7 days before the survey ranged from 13.9% to 23.9% (median: 17.9%). Prevalence among female students ranged from 10.8% to 21.2% (median: 17.0%), and prevalence among male students ranged from 14.6% to 26.4% (median: 19.4%) (Table 7).

Drank Soda or Pop at Least One Time per Day

Across Steps surveys, the overall percentage of students who had drunk a can, bottle, or glass of soda or pop (not including diet soda or diet pop) at least one time per day during the 7 days before the survey ranged from 16.7% to 45.3% (median: 26.6%). Prevalence among female students ranged from 11.5% to 37.4% (median: 21.7%), and prevalence among male students ranged from 20.0% to 52.9% (median: 30.4%) (Table 7).

Physical Activity

Met Recommended Levels of Physical Activity

Across Steps surveys, the overall percentage of students who had been physically active doing any kind of physical activity that increased their heart rate and made them breathe hard some of the time for a total of at least 60 minutes per day on 5 or more days during the 7 days before the survey (i.e., met recommended levels of physical activity) (9) ranged from 27.7% to 55.5% (median: 40.1%). Prevalence among female students ranged from 18.4% to 50.1% (median: 32.2%), and prevalence among male students ranged from 32.6% to 61.4% (median: 49.9%) (Table 8).

Did Not Participate in 60 or More Minutes of Physical Activity on Any Day

Across Steps surveys, the overall percentage of students who did not participate in 60 or more minutes of any kind of physical activity that increased their heart rate and made them breathe hard some of the time on at least 1 day during the 7 days before the survey (i.e., did not participate in 60 or more minutes of physical activity on any day) ranged from 7.6% to 30.9% (median: 17.9%). Prevalence among female students ranged from 7.8% to 41.1% (median: 22.3%), and prevalence among male students ranged from 5.1% to 21.2% (median: 12.0%) (Table 8).

Used Computers 3 or More Hours per Day

Across Steps surveys, the overall percentage of students who played video or computer games or used a computer for something that was not school work for 3 or more hours per day on an average school day (i.e., used computers 3 or more hours per day) ranged from 15.8% to 31.5% (median: 23.1%). Prevalence among female students ranged from 9.8% to 28.2% (median: 19.6%), and prevalence among male students ranged from 19.0% to 36.2% (median: 26.0%) (Table 9).

Watched Television 3 or More Hours per Day

Across Steps surveys, the overall percentage of students who watched television 3 or more hours per day on an average school day ranged from 18.0% to 57.2% (median: 33.0%). Prevalence among female students ranged from 14.7% to 59.8% (median: 30.8%), and prevalence among male students ranged from 20.4% to 54.2% (median: 32.1%) (Table 9).

Attended Physical Education Classes

Across Steps surveys, the overall percentage of students who went to physical education (PE) classes on 1 or more days in an average week when they were in school (i.e., attended PE classes) ranged from 25.5% to 96.1% (median: 49.6%). Prevalence among female students ranged from 21.6% to 98.4% (median: 42.2%), and prevalence among male students ranged from 29.6% to 96.1% (median: 55.6%) (Table 10).

Attended Physical Education Classes Daily

Across Steps surveys, the overall percentage of students who went to PE classes 5 days in an average week when they were in school (i.e., attended PE classes daily) ranged from 2.4% to 46.4% (median: 26.4%). Prevalence among female students ranged from 2.4% to 46.4% (median: 26.1%), and prevalence among male students ranged from 2.4% to 48.5% (median: 26.5%) (Table 10).

Played on at Least One Sports Teams

Across Steps surveys, the overall percentage of students who had played on at least one sports team (run by their school or community groups) during the 12 months before the survey ranged from 43.9% to 71.0% (median: 54.7%). Prevalence among female students ranged from 35.0% to 67.5% (median: 49.1%), and prevalence among male students ranged from 52.9% to 74.4% (median: 61.1%) (Table 11).

Obesity, Overweight, and Weight Control

Obese

Across Steps surveys, the overall percentage of students who were obese ranged from 4.6% to 20.2% (median: 13.6%). Prevalence among female students ranged from 2.4% to 16.4% (median: 9.7%), and prevalence among male students ranged from 6.8% to 24.7% (median: 16.7%) (Table 12).

Overweight

Across Steps surveys, the overall percentage of students who were overweight ranged from 8.3% to 19.9% (median: 15.5%). Prevalence among female students ranged from 6.3% to 25.3% (median: 15.9%), and prevalence among male students ranged from 10.1% to 18.9% (median: 15.0%) (Table 12).

Described Themselves as Overweight

Across Steps surveys, the overall percentage of students who described themselves as slightly or very overweight ranged from 21.1% to 36.3% (median: 28.8%). Prevalence among female students ranged from 24.8% to 44.2% (median: 33.1%), and prevalence among male students ranged from 16.1% to 31.7% (median: 23.2%) (Table 13).

Were Trying to Lose Weight

Across Steps surveys, the overall percentage of students who were trying to lose weight ranged from 36.2% to 53.4% (median: 43.8%). Prevalence among female students ranged from 45.5% to 69.9% (median: 59.1%), and prevalence among male students ranged from 23.0% to 46.0% (median: 30.4%) (Table 13).

Ate Less Food, Fewer Calories, or Low-Fat Foods to Lose Weight or to Keep from Gaining Weight

Across Steps surveys, the overall percentage of students who had eaten less food, fewer calories, or low-fat foods to lose weight or to keep from gaining weight during the 30 days before the survey ranged from 30.0% to 44.7% (median: 37.9%). Prevalence among female students ranged from 32.4% to 62.2% (median: 50.8%), and prevalence among male students ranged from 20.1% to 33.4% (median: 25.6%) (Table 14).

Exercised to Lose Weight or to Keep From Gaining Weight

Across Steps surveys, the overall percentage of students who had exercised to lose weight or to keep from gaining weight during the 30 days before the survey ranged from 48.3% to 67.3% (median: 63.1%). Prevalence among female students ranged from 46.8% to 78.4% (median: 68.9%), and prevalence among male students ranged from 44.8% to 68.3% (median: 54.7%) (Table 14).

Did Not Eat for 24 or More Hours to Lose Weight or to Keep From Gaining Weight

Across Steps surveys, the overall percentage of students who did not eat for 24 or more hours to lose weight or to keep from gaining weight during the 30 days before the survey ranged from 6.5% to 15.3% (median: 11.0%). Prevalence among female students ranged from 8.8% to 22.9% (median: 14.2%), and prevalence among male students ranged from 3.9% to 12.7% (median: 7.8%) (Table 15).

Took Diet Pills, Powders, or Liquids to Lose Weight or to Keep from Gaining Weight

Across Steps surveys, the overall percentage of students who had taken diet pills, powders, or liquids without a doctor's advice to lose weight or to keep from gaining weight during the 30 days before the survey ranged from 3.4% to 10.5% (median: 5.9%). Prevalence among female students ranged from 2.7% to 14.7% (median: 6.2%), and prevalence among male students ranged from 2.3% to 9.2% (median: 6.3%) (Table 15).

Vomited or Took Laxatives to Lose Weight or to Keep from Gaining Weight

Across Steps surveys, the overall percentage of students who had vomited or taken laxatives to lose weight or to keep from gaining weight during the 30 days before the survey ranged from 2.8% to 8.4% (median: 4.8%). Prevalence among female students ranged from 3.6% to 11.8% (median: 6.2%), and prevalence among male students ranged from 1.2% to 9.1% (median: 4.1%) (Table 16).

Asthma

Lifetime Asthma

Across Steps surveys, the overall percentage of students who had ever been told by a doctor or nurse that they had asthma (i.e., lifetime asthma) ranged from 16.8% to 28.5% (median: 21.6%). Prevalence among female students ranged from 16.1% to 27.8% (median: 21.8%), and prevalence among male students ranged from 15.3% to 31.6% (median: 22.3%) (Table 17).

Current Asthma

Across Steps surveys, the overall percentage of students who had lifetime asthma and still had asthma (i.e., current asthma) ranged from 7.2% to 16.7% (median: 11.3%). Prevalence among female students ranged from 7.8% to 18.1% (median: 11.6%), and prevalence among male students ranged from 5.9% to 15.9% (median: 10.0%) (Table 17).

Went to an Emergency Room or Urgent Care Center Because of Asthma

Across Steps surveys, among students who currently have asthma, the overall percentage of students who went to an emergency room or urgent care center because of their asthma one or more times during the 12 months before the survey ranged from 12.6% to 37.7% (median: 25.2%). Prevalence among female and male students separately was unavailable for all communities except one (Table 18).

Discussion

For 14 of the 29 behaviors measured in both the 2007 Steps YRBS and the 2007 national YRBS, the median prevalence across Steps communities did not differ significantly from the national prevalence. For the remaining 15 behaviors, significant differences were detected.

Compared with students nationally, students in the Steps communities were less likely to participate in seven behaviors related to tobacco use. These behaviors include lifetime daily cigarette use (median: 9.0%; national estimate: 12.4%, CI: 10.4%--14.7%), current cigarette use (median: 13.2%; national estimate: 20.0%, CI: 17.6%--22.6%), current frequent cigarette use (median: 5.1%; national estimate: 8.1%, CI: 6.7%--9.8%), smoked more than 10 cigarettes per day (median: 8.0%; national estimate: 10.7%, CI: 9.0%--12.6%), smoked a whole cigarette for the first time before age 13 years (median: 12.1%; national estimate: 14.2%, CI: 12.2%--16.5%), smoked cigarettes on school property (median: 4.0%; national estimate: 5.7%, CI: 4.7%--6.8%), and bought cigarettes in a store or gas station (median: 11.4%; national estimate: 16.0%, CI: 12.8%--19.9%).

For nutrition-related behaviors, whereas students in Steps communities were less likely to drink soda or pop at least one time per day compared with students nationally (median: 26.6%; national estimate: 33.8%, CI: 31.0%--36.8%), they also were less likely to eat fruits and vegetables 5 or more times per day (median: 17.9%; national estimate: 21.4%, CI: 19.8%--23.1%).

Compared with students nationally, students in the Steps communities were more likely to meet recommended levels of physical activity (median: 40.1%; national estimate: 34.7%, CI: 32.5%--37.0%). Similarly, the median prevalence of students in the Steps communities who did not participate in 60 or more minutes of physical activity on any day (17.9%) and the median prevalence of students in the Steps communities who watched television 3 or more hours per day on an average school day (33.0%) were lower than the national prevalence (24.9%, CI: 23.2%--26.6% and 35.4%, CI: 33.1%--37.7%, respectively).

The median percentage of students in the Steps communities who had eaten less food, fewer calories, or low-fat foods to lose weight or to keep from gaining weight during the 30 days before the survey was 37.9%. This was lower than the national prevalence of 40.6% (CI: 39.4%--41.9%). However, the students in the Steps communities were more likely to have exercised to lose weight or to keep from gaining weight during the 30 days before the survey (median: 63.1%; national estimate: 60.9%, CI: 59.8%--62.1%).

The median percentage of students in the Steps communities who had ever been told by a doctor or nurse that they had asthma was 21.6%. This was higher than the national prevalence of 20.3% (CI: 19.2%--21.4%).

Across Steps communities, prevalence did not vary substantially for more than one half of the risk behaviors. However, a range of 25 or more percentage points or a fivefold variation or greater was identified for the following risk behaviors:

  • lifetime cigarette use (minimum: 34.9%; maximum: 64.2%);
  • lifetime daily cigarette use (minimum: 3.7%; maximum: 20.1%);
  • current frequent cigarette use (minimum: 2.2%; maximum: 13.7%);
  • smoked more than 10 cigarettes per day (minimum: 2.2%; maximum: 15.8%);
  • smoked cigarettes on school property (minimum: 1.7%; maximum: 8.9%);
  • drank soda or pop at least one time per day (minimum: 16.7%; maximum: 45.3%);
  • met recommended levels of physical activity (minimum: 27.7%; maximum: 55.5%);
  • watched television 3 or more hours per day (minimum: 18.0%; maximum: 57.2%);
  • attended PE classes (minimum: 25.5%; maximum: 96.1%);
  • attended PE classes daily (minimum: 2.4%; maximum: 46.4%);
  • played on one or more sports teams (minimum: 43.9%; maximum: 71.0%); and
  • went to an emergency room or urgent care center because of asthma (minimum: 12.6%; maximum: 37.7%).

In part, these variations might reflect differences in state and local laws and policies, enforcement practices, availability of effective school and community interventions, prevailing behavioral and social norms, demographic characteristics of the population, and adult practices. In addition, these variations might indicate which communities would benefit from additional targeted technical assistance related to effective school and community interventions and policies. Significant differences between communities also can alert program managers to the opportunity to learn from each other by taking advantage of the national network they have established within the Steps Program. Communities can use these data to identify, prioritize, and develop community-specific activities to further reduce risk factors associated with obesity, diabetes, and asthma over time.

Limitations

The findings in this report are subject to at least four limitations. First, these data apply only to youth who attended school during 2007 and, therefore, are not representative of all persons in this age group in each community. Nationwide, in 2005, of persons aged 16--17 years, approximately 3% were not enrolled in a high school program and had not completed high school (10). Second, although the national YRBS includes private schools, Steps surveys do not, limiting the comparability. Third, the extent of underreporting or overreporting of behaviors cannot be determined, although the survey questions demonstrate good test-retest reliability (3). Finally, because BMI was calculated on the basis of self-reported height and weight, the prevalence of obesity and overweight might be underestimated (6).

Conclusion

Steps Program staff at the national, tribal, state, and local levels will use YRBSS data for decision making, program planning, and enhancing technical assistance to increase physical activity and healthy eating and to reduce tobacco use and exposure. These data will be used to help focus existing programs on activities that have shown the greatest promise of results, such as smoke-free policies for public places, healthier vending machine policies, asthma action plans, and increased frequency of physical education in schools, as well as identify populations of greatest need and opportunities for strategic collaboration to identify and disseminate lessons learned.

References

  1. Eaton DK, Kann L, Kinchen S, et al. Youth risk behavior surveillance---United States, 2007. In: Surveillance Summaries, June 6, 2008. MMWR 2008;57(No. SS-4).
  2. CDC. Methodology of the Youth Risk Behavior Surveillance System. MMWR 2004;53(No. RR-12).
  3. Brener ND, Kann L, McManus T, Kinchen SA, Sundberg EC, Ross JG. Reliability of the Youth Risk Behavior Survey Questionnaire. J Adolesc Health 2002;31:336--42.
  4. Kuczmarski RJ, Ogden CL, Grummer-Strawn LM, et al. CDC growth charts: United States. Advance data from vital and health statistics, no. 314. Hyattsville, MD: US Department of Health and Human Services, CDC, National Center for Health Statistics; 2000. Available at http://www.cdc.gov/nchs/data/ad/ad314.pdf.
  5. Barlow SE and the Expert Committee. Expert Committee recommendations regarding the prevention, assessment, and treatment of child and adolescent overweight and obesity: summary report. Pediatrics 2007;120:S164-S192.
  6. Brener ND, McManus T, Galuska DA, Lowry R, Wechsler H. Reliability and validity of self-reported height and weight among high school students. J Adolesc Health 2003;32:281--7.
  7. SAS Institute, Inc. SAS,® version 9.1 [Software and documentation]. Cary, NC: SAS Institute; 2003.
  8. Research Triangle Institute. SUDAAN,® software for the statistical analysis of correlated data, release 9.0.0 [Software and documentation]. Research Triangle Park, NC: Research Triangle Institute; 2004.
  9. US Department of Health and Human Services and US Department of Agriculture. Dietary guidelines for Americans 2005. Washington, DC; 2005. Available at http://www.healthierus.gov/dietaryguidelines.
  10. Laird J, Kienzl G, DeBell M, Chapman C. Dropout rates in the United States: 2005. Washington, DC: US Department of Education, National Center for Education Statistics; 2007. Publication no. NCES 2007-059.

* Data from three large cities/urban communities included in this report (Boston, Philadelphia, and DeKalb County, GA) also are included in a previously published report (1). The data for the Boston and Philadelphia Steps communities are subsets of the Boston Public Schools data and the Philadelphia School District data, respectively, whereas the DeKalb County, GA, data are identical to those published previously.

Overall response rate = (number of participating schools / number of eligible sampled schools) x (number of useable questionnaires / number of eligible students sampled).

§ For questionnaires containing 50 or more questions, those that failed quality control had less than 20 remaining responses after editing or had the same answer to 15 or more questions in a row. For questionnaires containing less than 50 questions, those that failed quality control had less than 15 remaining responses after editing or had the same answer to 12 or more questions in a row.

100% fruit juice, fruit, green salad, potatoes (excluding French fries, fried potatoes, or potato chips), carrots, or other vegetables.

Steps Program Youth Risk Behavior Survey Coordinators

State-Coordinated Small Cities/Rural Communities: Arizona, Lynn Ladd, Arizona Department of Education; Colorado, Mina Liebert, MS, Colorado Department of Public Health and Environment; Minnesota, Cara McNulty, MS, Minnesota Department of Health; New York, Cynthia A. Jaconski, MPH, New York State Department of Health; Pennsylvania, William Barbour, Pennsylvania Department of Health.

Large Cities/Urban Communities: Boston, Massachusetts, Barbara Huscher Cohen, MA, Boston Public Schools; Cleveland, Ohio, Jean L. Frank, MPH, Case Western Reserve University; DeKalb County, Georgia, Rachel Yelk Woodruff, MPH, DeKalb County Board of Health; Hillsborough County, Florida, Ercilia R. Calcano, MPH, Hillsborough County Health Department; New Orleans, Louisiana, Romericus Stewart, MPH, City of New Orleans Health Department; Philadelphia, Pennsylvania, Kenneth D. Smith, PhD, Philadelphia Department of Public Health; Salinas, California, Sarah Bartelmann, MPH, Monterey County Health Department; San Antonio, Texas, Richard Jackson, MPA, San Antonio Metropolitan Health District; Santa Clara County, California, Dorothy Su, MPH, Santa Clara County Public Health Department.

Tribe: Cherokee Nation, Oklahoma, Julie Deerinwater-Anderson, MPH, Cherokee Nation Health Services.

Table 1

TABLE 1. Sample sizes, response rates, and demographic characteristics* — selected Steps communities, Youth Risk Behavior Surveys, 2007
Steps community
Student sample size
Response rate (%)
Sex (%)
Grade (%)
Race/Ethnicity (%)
School
Student
Overall
Female
Male
9
10
11
12
White†
Black†
Hispanic
Other§
State-coordinated small cities/
rural communities
Santa Cruz County, Arizona
1,004
100
83
83
50.3
49.7
30.0
26.6
21.9
21.3
5.0
0.2
94.1
0.7
Yuma County, Arizona
1,365
100
81
81
49.2
50.8
28.6
26.4
24.7
19.9
19.0
1.4
77.1
2.4
Mesa County, Colorado
913
100
68
68
48.8
51.2
26.8
25.8
24.6
22.4
81.2
0.1
15.1
3.5
Pueblo County, Colorado
895
100
67
67
48.7
51.3
29.9
25.3
21.4
22.7
42.4
1.9
52.1
3.5
Teller County, Colorado
743
100
79
79
48.5
51.5
24.8
26.4
23.7
24.5
86.3
1.6
7.2
4.9
Weld County, Colorado
1,152
100
76
76
49.5
50.5
28.1
27.4
22.4
21.5
52.8
0.5
44.2
2.5
Minneapolis, Minnesota
1,064
100
79
79
49.3
50.7
25.7
25.7
22.5
25.9
28.3
44.0
15.1
12.5
Rochester, Minnesota
928
100
82
82
49.4
50.6
28.6
25.4
22.8
23.1
79.5
9.0
2.4
9.1
St. Paul, Minnesota
905
100
77
77
49.2
50.8
26.3
27.1
25.2
21.2
26.5
28.2
9.9
35.5
Broome County, New York
1,019
100
75
75
48.3
51.7
26.3
25.7
24.9
22.8
88.6
6.2
2.8
2.4
Chautauqua County, New York
779
83
77
64
49.0
51.0
26.1
25.6
23.4
23.1
89.6
0.9
5.3
4.2
Jefferson County, New York
759
91
78
71
48.5
51.5
26.1
25.4
22.1
23.2
87.1
5.6
2.6
4.7
Rockland County, New York
839
100
78
78
48.7
51.3
25.6
25.4
25.2
23.4
56.8
19.4
15.0
8.9
Fayette County, Pennsylvania
979
88
78
69
47.3
52.7
28.9
25.1
23.8
21.9
91.7
6.7
0.7
0.9
Luzerne County, Pennsylvania
1,236
100
82
82
48.3
51.7
26.4
25.2
24.5
23.6
90.2
1.6
5.6
2.6
Tioga County, Pennsylvania
1,044
100
84
84
48.9
51.1
26.7
25.8
24.8
22.4
86.0
1.6
6.1
6.2
Large cities/urban communities
Boston, Massachusetts
1,161
100
66
66
48.3
51.7
29.4
23.2
24.4
22.9
11.2
51.9
27.6
9.3
Cleveland, Ohio
940
100
73
73
51.0
49.0
36.3
25.3
19.0
19.4
15.5
72.5
10.0
2.0
DeKalb County, Georgia
2,197
100
83
83
49.9
50.1
31.3
24.1
23.0
21.3
9.5
80.1
5.2
5.2
Hillsborough County, Florida
644
100
71
71
51.9
48.1
28.6
27.0
23.2
21.2
21.6
45.4
27.0
6.0
New Orleans, Louisiana
2,034
100
88
88
50.8
49.2
29.0
24.4
23.2
23.1
5.3
88.9
2.2
3.6
Philadelphia, Pennsylvania
1,295
100
73
73
50.3
49.7
29.7
25.3
30.3
14.4
7.7
67.9
10.2
14.2
Salinas, California
1,270
100
83
83
49.4
50.6
26.1
26.4
24.8
22.5
15.1
0.9
74.6
9.3
San Antonio, Texas
1,317
100
64
64
49.4
50.6
33.5
26.1
20.6
19.7
2.2
8.0
88.0
1.8
Santa Clara County, California
1,429
88
85
75
49.3
50.7
26.0
25.4
25.7
22.6
7.9
0.9
57.6
33.6
Tribe
Cherokee Nation, OklahomaΆ
650
100
78
78
47.9
52.1
28.2
26.5
23.5
21.8
43.3
0.5
1.9
54.4
United States
14,041
81
84
68
49.5
50.5
29.0
26.2
23.4
21.3
60.3
15.1
16.9
7.7
* Weighted population estimates for the United States and each site.
† Non-Hispanic.
§ American Indian or Alaska Native, Asian, Native Hawaiian or other Pacific Islander, and multiple race (non-Hispanic).
Ά The Cherokee Nation Steps community comprises a 14-county service delivery area that is nonreservation based. It includes all racial/ethnic groups residing in the service delivery area. Therefore, Cherokee Nation students might belong to an ethnicity other than Cherokee.
Return to top.
Table 2

TABLE 2. Percentage of high school students who ever smoked cigarettes, by sex — selected Steps communities, Youth Risk Behavior Survey, 2007
Lifetime cigarette use*
Lifetime daily cigarette use†
Female
Male
Total
Female
Male
Total
Steps community
%
CI§
%
CI
%
CI
%
CI
%
CI
%
CI
State-coordinated small cities/
rural communities
Santa Cruz County, Arizona
57.8
51.3–64.1
66.4
60.8–71.6
62.0
57.1–66.7
9.3
7.0–12.3
11.1
8.6–14.2
10.2
8.3–12.4
Yuma County, Arizona
52.2
46.0–58.3
60.5
54.9–65.7
56.2
51.3–61.1
7.6
5.6–10.4
13.0
9.5–17.4
10.3
8.0–13.0
Mesa County, Colorado
49.6
42.6–56.7
51.6
46.3–56.8
50.7
45.9–55.4
10.6
7.2–15.5
13.2
9.9–17.3
11.9
9.4–15.0
Pueblo County, Colorado
63.4
56.5–69.9
61.5
55.5–67.3
62.4
56.7–67.8
12.5
9.4–16.4
14.2
10.6–18.6
13.3
10.5–16.7
Teller County, Colorado
52.5
44.4–60.4
45.3
38.6–52.1
48.8
43.5–54.0
17.6
12.2–24.8
14.3
10.8–18.7
16.0
12.6–20.2
Weld County, Colorado
50.4
44.0–56.7
51.6
46.5–56.6
50.9
46.7–55.2
9.5
7.3–12.3
9.8
7.3–13.0
9.6
7.8–11.8
Minneapolis, Minnesota
41.2
35.2–47.3
44.0
38.0–50.1
42.7
37.8–47.7
3.7
2.3–5.8
6.6
4.3–10.2
5.1
3.6–7.2
Rochester, Minnesota
31.7
25.6–38.4
37.9
30.2–46.4
34.9
28.6–41.8
6.6
4.2–10.2
8.5
5.4–13.2
7.7
5.4–10.7
St. Paul, Minnesota
48.3
40.6–56.2
48.8
42.4–55.2
48.6
42.5–54.9
7.9
4.6–13.2
9.0
6.0–13.1
8.4
5.9–11.8
Broome County, New York
41.7
36.5–47.2
33.5
28.8–38.6
37.7
33.6–41.9
13.6
9.9–18.4
6.0
4.3–8.2
9.7
7.4–12.6
Chautauqua County, New York
37.4
31.1–44.2
38.6
31.1–46.7
38.1
32.0–44.6
11.1
8.2–14.9
8.6
5.2–14.1
10.0
7.3–13.5
Jefferson County, New York
47.5
38.4–56.7
51.9
44.7–59.1
49.9
42.9–56.9
12.5
8.9–17.4
13.0
8.9–18.5
12.9
9.9–16.5
Rockland County, New York
36.0
30.7–41.8
36.8
30.5–43.6
36.4
31.7–41.4
6.7
4.6–9.9
8.0
5.6–11.4
7.4
5.7–9.6
Fayette County, Pennsylvania
57.3
50.9–63.4
55.7
50.5–60.7
56.5
52.5–60.4
15.6
12.4–19.5
15.5
12.1–19.6
15.6
13.3–18.1
Luzerne County, Pennsylvania
52.1
47.8–56.4
52.3
46.5–58.0
52.3
48.2–56.3
16.7
13.6–20.2
20.5
16.1–25.7
18.7
15.7–22.0
Tioga County, Pennsylvania
55.1
49.6–60.4
52.8
48.2–57.4
54.0
49.9–58.0
17.2
13.8–21.2
22.1
17.6–27.3
19.8
16.7–23.2
Large cities/urban communities
Boston, Massachusetts
43.3
38.1–48.6
41.7
36.9–46.6
42.6
38.6–46.8
5.4
3.5–8.1
6.2
4.3–9.0
5.8
4.2–8.0
Cleveland, Ohio
51.6
47.2–56.0
56.1
51.0–61.1
53.8
50.5–57.2
6.5
4.5–9.4
8.4
5.3–13.2
7.4
5.6–9.8
DeKalb County, Georgia
42.3
38.8–45.9
49.0
45.8–52.2
45.6
43.1–48.2
3.1
2.1–4.6
6.7
5.3–8.3
4.9
4.0–5.9
Hillsborough County, Florida
40.0
34.5–45.8
38.9
30.8–47.8
39.5
34.1–45.3
2.5
1.2–5.0
6.3
3.7–10.7
4.5
2.8–7.0
New Orleans, Louisiana
45.8
42.4–49.2
49.2
45.1–53.4
47.4
44.5–50.3
5.8
4.6–7.3
8.2
6.3–10.7
6.9
5.7–8.4
Philadelphia, Pennsylvania
42.1
35.8–48.6
46.0
40.0–52.1
44.1
38.8–49.5
4.9
3.2–7.5
5.4
3.7–7.9
5.1
4.0–6.6
Salinas, California
38.9
33.7–44.4
49.1
43.0–55.2
44.0
39.9–48.2
3.4
2.1–5.5
4.0
2.5–6.4
3.7
2.6–5.2
San Antonio, Texas
58.6
54.4–62.6
62.9
58.5–67.1
60.7
57.6–63.7
7.2
5.3–9.7
7.6
5.3–10.6
7.5
6.0–9.3
Santa Clara County, California
36.9
32.3–41.7
39.9
34.8–45.1
38.6
34.8–42.6
3.4
2.0–5.6
7.2
4.5–11.4
5.5
3.8–7.8
Tribe
Cherokee Nation, Oklahoma
60.9
50.5–70.5
67.1
60.6–73.0
64.2
56.3–71.4
22.4
17.0–29.0
17.7
13.6–22.6
20.1
16.4–24.2
Median
47.9
49.1
48.7
7.7
8.5
9.0
Range
31.7–63.4
33.5–67.1
34.9–64.2
2.5–22.4
4.0–22.1
3.7–20.1
United States
48.8
45.6–52.1
51.8
48.4–55.3
50.3
47.2–53.5
11.8
9.8–14.1
13.0
10.9–15.4
12.4
10.4–14.7
* Ever tried cigarette smoking, even one or two puffs.
† Ever smoked at least one cigarette every day for 30 days.
§ 95% confidence interval.
Return to top.
Table 3

TABLE 3. Percentage of high school students who currently smoked cigarettes, by sex — selected Steps communities, Youth Risk Behavior Survey, 2007
Current cigarette use*
Current frequent cigarette use†
Female
Male
Total
Female
Male
Total
Steps community
%
CI§
%
CI
%
CI
%
CI
%
CI
%
CI
State-coordinated small cities/
rural communities
Santa Cruz County, Arizona
22.8
18.0–28.6
28.9
24.1–34.3
25.8
22.4–29.6
3.7
2.0–6.7
6.0
4.0–8.8
4.8
3.4–6.7
Yuma County, Arizona
15.0
11.9–18.8
23.2
18.4–28.8
19.0
15.6–23.0
2.5
1.4–4.5
8.0
5.4–11.5
5.2
3.7–7.3
Mesa County, Colorado
14.7
10.6–20.2
18.5
14.4–23.4
16.6
13.4–20.4
5.7
3.6–9.0
6.6
4.5–9.4
6.1
4.6–8.1
Pueblo County, Colorado
18.7
15.3–22.7
21.7
17.4–26.9
20.3
17.1–23.9
5.1
3.3–7.9
9.7
6.8–13.5
7.4
5.5–9.9
Teller County, Colorado
22.2
16.1–29.7
16.4
12.3–21.5
19.2
15.4–23.7
11.9
7.2–19.0
7.5
4.8–11.5
9.7
6.8–13.6
Weld County, Colorado
15.7
12.6–19.5
16.2
12.6–20.7
15.9
13.3–18.9
5.8
4.1–8.2
4.3
2.7–6.9
5.1
3.7–6.9
Minneapolis, Minnesota
8.5
5.5–12.8
10.6
7.5–14.7
9.6
7.2–12.8
2.0
0.8–4.9
3.5
1.9–6.6
2.7
1.6–4.7
Rochester, Minnesota
13.5
9.8–18.4
13.5
9.0–19.9
13.6
10.1–18.2
5.2
3.1–8.5
5.8
3.5–9.4
5.5
3.9–7.7
St. Paul, Minnesota
11.7
8.0–16.8
14.0
10.8–17.9
12.8
10.2–16.0
3.7
1.8–7.4
7.0
4.7–10.3
5.4
3.7–7.7
Broome County, New York
15.0
10.8–20.5
10.0
8.0–12.3
12.6
9.9–15.9
7.4
4.9–10.9
4.7
3.2–6.8
6.0
4.4–8.1
Chautauqua County, New York
12.4
8.8–17.2
11.4
7.9–16.3
11.9
8.9–15.7
6.6
3.8–11.1
6.2
3.5–10.7
6.4
4.3–9.4
Jefferson County, New York
16.8
12.2–22.8
17.3
13.3–22.1
17.1
13.6–21.4
8.9
6.0–13.0
10.0
6.6–14.8
9.5
7.2–12.6
Rockland County, New York
11.7
8.4–16.1
10.5
7.4–14.7
11.1
8.5–14.4
3.0
1.6–5.7
4.8
3.1–7.5
3.9
2.7–5.7
Fayette County, Pennsylvania
21.9
17.6–26.9
23.6
19.0–28.9
22.9
19.7–26.5
11.5
8.5–15.3
12.4
9.3–16.3
12.0
9.8–14.6
Luzerne County, Pennsylvania
19.9
16.1–24.4
23.0
18.6–28.2
21.7
18.3–25.5
11.3
8.7–14.6
15.8
12.1–20.2
13.7
11.2–16.7
Tioga County, Pennsylvania
21.3
17.6–25.5
20.9
16.5–26.2
21.1
17.7–25.0
10.7
8.2–13.9
13.0
9.7–17.2
11.9
9.6–14.6
Large cities/urban communities
Boston, Massachusetts
8.3
5.8–11.7
9.2
6.8–12.2
8.7
6.8–11.1
1.9
0.9–3.8
3.8
2.2–6.5
2.9
1.7–4.7
Cleveland, Ohio
8.1
5.8–11.2
13.4
9.6–18.3
10.8
8.5–13.6
3.2
1.9–5.3
5.4
3.6–8.1
4.4
3.3–5.9
DeKalb County, Georgia
7.0
5.5–9.0
10.0
8.1–12.2
8.5
7.2–10.0
1.4
0.7–2.5
4.2
3.0–5.9
2.8
2.1–3.8
Hillsborough County, Florida
5.7
3.2–10.2
8.8
4.9–15.4
7.2
4.5–11.4
0.7
0.2–2.3
4.2
2.3–7.8
2.4
1.4–4.0
New Orleans, Louisiana
7.9
6.4–9.8
11.9
9.4–14.9
9.9
8.3–11.7
1.9
1.2–3.0
5.5
3.8–7.7
3.6
2.7–4.7
Philadelphia, Pennsylvania
7.0
5.1–9.5
8.1
5.4–12.0
7.7
6.0–9.8
2.2
1.0–4.6
3.5
1.9–6.3
2.8
1.7–4.5
Salinas, California
6.0
4.0–8.9
10.4
7.6–14.0
8.2
6.4–10.4
1.7
0.8–3.7
2.7
1.6–4.6
2.2
1.5–3.3
San Antonio, Texas
16.7
13.9–19.9
17.9
14.4–21.9
17.4
15.1–20.0
2.2
1.3–3.8
3.0
1.7–5.2
2.8
1.8–4.1
Santa Clara County, California
7.1
5.1–9.8
11.4
8.5–15.2
9.3
7.3–11.6
0.9
0.4–1.9
3.7
2.1–6.6
2.3
1.4–3.9
Tribe
Cherokee Nation, Oklahoma
28.6
22.7–35.3
28.4
22.6–34.9
28.6
23.4–34.4
13.0
10.6–15.8
10.6
6.8–16.3
11.7
9.3–14.7
Median
14.1
13.8
13.2
3.7
5.6
5.1
Range
5.7–28.6
8.1–28.9
7.2–28.6
0.7–13.0
2.7–15.8
2.2–13.7
United States
18.7
16.5–21.1
21.3
18.3–24.6
20.0
17.6–22.6
7.4
5.9–9.2
8.7
7.2–10.5
8.1
6.7–9.8
* Smoked cigarettes on at least 1 day during the 30 days before the survey.
† Smoked cigarettes on 20 or more days during the 30 days before the survey.
§ 95% confidence interval.
Return to top.
Table 4

TABLE 4. Percentage of high school students who currently smoked more than 10 cigarettes per day* and who tried to quit smoking cigarettes,† by sex — selected Steps communities, Youth Risk Behavior Survey, 2007
Smoked more than 10 cigarettes per day
Tried to quit smoking cigarettes
Female
Male
Total
Female
Male
Total
Steps community
%
CI§
%
CI
%
CI
%
CI
%
CI
%
CI
State-coordinated small cities/
rural communities
Santa Cruz County, Arizona
—Ά
—
7.2
3.7–13.7
4.7
2.3–9.4
—
—
46.5
36.9–56.4
49.4
41.1–57.7
Yuma County, Arizona
0.1
0.0–1.0
13.7
7.3–24.3
8.2
4.2–15.1
49.9
37.4–62.5
48.5
36.7–60.5
49.0
39.1–58.9
Mesa County, Colorado
—
—
—
—
8.9
4.1–18.1
—
—
—
—
52.2
41.6–62.5
Pueblo County, Colorado
—
—
—
—
6.3
3.0–12.8
—
—
—
—
51.1
43.5–58.7
Teller County, Colorado
—
—
—
—
15.8
9.8–24.4
—
—
—
—
55.1
46.6–63.4
Weld County, Colorado
—
—
—
—
7.7
4.5–12.9
—
—
—
—
51.3
43.4–59.1
Minneapolis, Minnesota
—
—
—
—
—
—
—
—
—
—
—
—
Rochester, Minnesota
—
—
—
—
6.4
3.5–11.4
—
—
—
—
46.4
36.6–56.5
St. Paul, Minnesota
—
—
—
—
2.4
0.7–7.9
—
—
—
—
—
—
Broome County, New York
—
—
—
—
14.6
8.6–23.7
—
—
—
—
43.2
32.6–54.4
Chautauqua County, New York
—
—
—
—
—
—
—
—
—
—
—
—
Jefferson County, New York
—
—
—
—
13.7
7.3–24.3
—
—
—
—
51.7
43.3–60.1
Rockland County, New York
—
—
—
—
—
—
—
—
—
—
—
—
Fayette County, Pennsylvania
—
—
14.0
7.7–24.0
12.8
7.8–20.5
—
—
55.7
45.7–65.3
61.9
54.9–68.5
Luzerne County, Pennsylvania
10.5
5.8–18.1
19.8
13.4–28.3
15.5
11.2–21.0
58.5
48.8–67.5
48.1
38.2–58.2
52.8
45.8–59.6
Tioga County, Pennsylvania
11.4
6.9–18.1
—
—
13.8
9.8–19.1
53.4
43.2–63.2
—
—
55.1
48.1–61.8
Large cities/urban communities
Boston, Massachusetts
—
—
—
—
—
—
—
—
—
—
—
—
Cleveland, Ohio
—
—
—
—
—
—
—
—
—
—
—
—
DeKalb County, Georgia
—
—
—
—
7.8
4.7–12.6
—
—
—
—
53.4
45.6–61.0
Hillsborough County, Florida
—
—
—
—
—
—
—
—
—
—
—
—
New Orleans, Louisiana
—
—
—
—
7.1
3.9–12.6
—
—
—
—
54.8
45.5–63.7
Philadelphia, Pennsylvania
—
—
—
—
—
—
—
—
—
—
—
—
Salinas, California
—
—
—
—
—
—
—
—
—
—
—
—
San Antonio, Texas
0.0
—
2.4
0.8–7.2
2.2
0.9–5.2
50.3
41.1–59.6
50.0
40.6–59.4
50.2
43.9–56.6
Santa Clara County, California
—
—
—
—
4.2
1.6–10.6
—
—
—
—
45.5
34.0–57.4
Tribe
Cherokee Nation, Oklahoma
—
—
—
—
9.9
5.6–16.9
—
—
—
—
57.0
49.6–64.2
Median
5.3
13.7
8.0
51.8
48.5
51.7
Range
0.0–11.4
2.4–19.8
2.2–15.8
49.9–58.5
46.5–55.7
43.2–61.9
United States
7.1
5.4–9.3
13.8
11.4–16.7
10.7
9.0–12.6
55.1
50.9–59.3
45.1
42.1–48.1
49.7
47.2–52.2
* On the days they smoked during the 30 days before the survey, among students who currently smoked cigarettes.
† During the 12 months before the survey, among students who currently smoked cigarettes.
§ 95% confidence interval.
Ά Not available.
Return to top.
Table 5

TABLE 5. Percentage of high school students who smoked a whole cigarette for the first time before age 13 years and who smoked cigarettes on school property,* by sex — selected Steps communities, Youth Risk Behavior Survey, 2007
Smoked a whole cigarette before age 13 years
Smoked cigarettes on school property
Female
Male
Total
Female
Male
Total
Steps community
%
CI†
%
CI
%
CI
%
CI
%
CI
%
CI
State-coordinated small cities/
rural communities
Santa Cruz County, Arizona
10.4
7.4–14.3
17.5
13.8–21.9
13.9
11.5–16.6
2.5
1.4–4.5
6.3
4.1–9.7
4.4
3.0–6.3
Yuma County, Arizona
10.4
8.0–13.4
16.1
13.2–19.6
13.2
11.3–15.4
1.5
0.8–3.0
5.9
3.5–9.5
3.7
2.4–5.6
Mesa County, Colorado
10.9
7.7–15.3
15.6
12.3–19.5
13.3
10.9–16.3
6.6
4.3–9.9
5.5
3.7–8.2
6.0
4.5–8.1
Pueblo County, Colorado
13.5
10.4–17.4
19.5
15.2–24.7
16.7
14.0–19.9
7.6
5.4–10.6
10.2
7.4–13.9
8.9
7.0–11.2
Teller County, Colorado
13.8
9.8–19.2
13.6
10.2–17.9
13.9
11.1–17.2
10.8
7.3–15.8
5.0
3.1–7.9
7.9
5.8–10.8
Weld County, Colorado
12.0
9.0–15.9
15.1
11.6–19.4
13.5
11.0–16.5
7.0
5.0–9.8
6.6
4.7–9.2
6.8
5.2–8.8
Minneapolis, Minnesota
7.9
5.3–11.4
8.9
5.7–13.5
8.3
6.0–11.5
0.9
0.4–2.1
2.6
1.3–4.9
1.8
1.1–3.0
Rochester, Minnesota
6.3
4.1–9.8
8.1
5.3–12.1
7.5
5.5–10.2
2.4
1.3–4.6
4.3
2.7–6.9
3.5
2.3–5.1
St. Paul, Minnesota
7.9
5.4–11.4
11.8
8.8–15.8
9.9
7.6–12.9
3.1
1.8–5.4
5.0
2.9–8.4
4.0
2.6–6.3
Broome County, New York
10.9
7.7–15.2
7.7
5.5–10.7
9.5
7.4–12.1
5.5
3.1–9.8
4.0
2.6–6.1
4.8
3.1–7.3
Chautauqua County, New York
8.7
6.0–12.5
11.5
8.1–16.0
10.1
7.4–13.6
2.1
0.9–4.9
3.1
1.5–6.4
2.6
1.4–4.9
Jefferson County, New York
10.6
7.5–14.7
13.4
9.3–19.1
12.2
9.5–15.6
2.3
1.1–4.7
5.6
3.2–9.7
4.1
2.6–6.5
Rockland County, New York
4.4
2.6–7.1
6.6
4.3–9.8
5.5
4.0–7.5
3.1
1.8–5.4
4.1
2.4–7.1
3.6
2.3–5.6
Fayette County, Pennsylvania
15.8
12.5–19.7
17.9
14.2–22.4
16.9
14.3–19.9
2.3
1.3–4.2
8.2
5.6–11.7
5.4
3.9–7.3
Luzerne County, Pennsylvania
11.5
9.2–14.4
12.4
9.5–15.9
12.1
10.3–14.3
4.6
3.1–6.9
9.6
6.7–13.7
7.4
5.6–9.7
Tioga County, Pennsylvania
16.2
12.8–20.4
20.6
16.8–24.9
18.5
15.6–21.8
2.9
1.8–4.7
6.5
4.2–9.8
4.7
3.3–6.7
Large cities/urban communities
Boston, Massachusetts
6.4
4.6–8.8
8.8
6.3–12.2
7.9
6.2–10.0
2.7
1.5–4.6
4.1
2.5–6.7
3.4
2.3–5.1
Cleveland, Ohio
12.9
9.6–17.0
15.4
11.3–20.7
14.1
11.1–17.7
3.2
1.8–5.4
6.8
4.3–10.5
5.0
3.7–6.9
DeKalb County, Georgia
7.4
5.8–9.4
15.0
12.7–17.6
11.2
9.7–12.8
1.7
1.1–2.5
4.2
3.1–5.6
2.9
2.3–3.7
Hillsborough County, Florida
12.5
8.7–17.7
9.3
5.5–15.3
11.3
9.0–14.1
0.9
0.2–3.3
2.7
1.2–6.0
1.7
0.9–3.5
New Orleans, Louisiana
11.2
9.0–13.8
15.4
12.5–18.8
13.3
11.4–15.5
1.6
1.0–2.5
4.4
3.1–6.2
3.0
2.2–4.0
Philadelphia, Pennsylvania
8.5
6.5–11.0
11.5
8.5–15.5
9.9
8.0–12.2
1.8
0.7–4.5
3.0
1.6–5.4
2.6
1.5–4.5
Salinas, California
6.4
4.4–9.2
12.1
9.0–16.0
9.2
7.2–11.9
1.0
0.4–2.7
2.8
1.6–4.9
1.9
1.2–3.1
San Antonio, Texas
16.1
12.9–19.8
18.1
14.7–22.1
17.2
14.8–19.9
3.7
2.4–5.6
5.2
3.6–7.4
4.6
3.5–6.0
Santa Clara County, California
7.3
5.5–9.6
11.3
7.6–16.4
9.6
7.1–13.0
1.3
0.6–2.6
4.6
3.0–6.9
3.0
2.0–4.4
Tribe
Cherokee Nation, Oklahoma
20.6
14.3–28.8
20.4
13.2–30.2
20.5
14.8–27.8
4.5
2.1–9.3
4.3
2.2–8.2
4.4
2.6–7.3
Median
10.7
13.5
12.1
2.6
4.8
4.0
Range
4.4–20.6
6.6–20.6
5.5–20.5
0.9–10.8
2.6–10.2
1.7–8.9
United States
11.9
10.3–13.6
16.4
13.5–19.7
14.2
12.2–16.5
4.8
3.8–6.1
6.5
5.5–7.7
5.7
4.7–6.8
* On at least 1 day during the 30 days before the survey.
† 95% confidence interval.
Return to top.
Table 6

TABLE 6. Percentage of high school students who usually obtained their own cigarettes by buying them in a store or gas station,* by sex — selected Steps communities, Youth Risk Behavior Survey, 2007
Female
Male
Total
Steps community
%
CI†
%
CI
%
CI
State-coordinated small cities/
rural communities
Santa Cruz County, Arizona
—§
—
20.9
15.5–27.4
19.3
14.5–25.3
Yuma County, Arizona
—
—
11.0
6.1–19.1
11.4
7.8–16.4
Mesa County, Colorado
—
—
—
—
8.4
4.1–16.5
Pueblo County, Colorado
—
—
—
—
6.9
3.6–12.6
Teller County, Colorado
—
—
—
—
—
—
Weld County, Colorado
—
—
—
—
8.6
4.5–16.0
Minneapolis, Minnesota
—
—
—
—
—
—
Rochester, Minnesota
—
—
—
—
5.8
2.2–14.3
St. Paul, Minnesota
—
—
—
—
—
—
Broome County, New York
—
—
—
—
—
—
Chautauqua County, New York
—
—
—
—
—
—
Jefferson County, New York
—
—
—
—
8.5
3.4–19.6
Rockland County, New York
—
—
—
—
—
—
Fayette County, Pennsylvania
—
—
—
—
15.4
9.0–25.0
Luzerne County, Pennsylvania
—
—
26.8
19.5–35.7
20.5
15.2–27.2
Tioga County, Pennsylvania
—
—
—
—
10.1
5.7–17.3
Large cities/urban communities
Boston, Massachusetts
—
—
—
—
—
—
Cleveland, Ohio
—
—
—
—
—
—
DeKalb County, Georgia
—
—
—
—
25.1
18.4–33.3
Hillsborough County, Florida
—
—
—
—
—
—
New Orleans, Louisiana
—
—
—
—
24.4
17.8–32.5
Philadelphia, Pennsylvania
—
—
—
—
—
—
Salinas, California
—
—
—
—
—
—
San Antonio, Texas
—
—
—
—
11.2
7.3–16.9
Santa Clara County, California
—
—
—
—
23.2
13.8–36.3
Tribe
Cherokee Nation, Oklahoma
—
—
—
—
11.5
5.4–22.7
Median
—
20.9
11.4
Range
—
11.0–26.8
5.8–25.1
United States
11.3
8.0–15.6
20.0
16.0–24.8
16.0
12.8–19.9
* During the 30 days before the survey, among students who were aged <18 years and who currently smoked cigarettes.
† 95% confidence interval.
§ Not available.
Return to top.
Table 7

TABLE 7. Percentage of high school students who ate fruits and vegetables* five or more times per day† and who drank a can, bottle, or glass of soda or pop§ at least one time per day,† by sex — selected Steps communities, Youth Risk Behavior Survey, 2007
Ate fruits and vegetables five or more times per day
Drank soda or pop at least one time per day
Female
Male
Total
Female
Male
Total
Steps community
%
CIΆ
%
CI
%
CI
%
CI
%
CI
%
CI
State-coordinated small cities/
rural communities
Santa Cruz County, Arizona
16.2
12.6–20.6
18.4
14.3–23.3
17.4
15.0–20.2
14.5
11.2–18.5
22.5
19.0–26.4
18.6
15.9–21.7
Yuma County, Arizona
16.9
13.9–20.5
20.6
17.2–24.5
18.8
16.2–21.6
23.0
18.7–27.9
34.7
31.0–38.5
28.8
26.0–31.8
Mesa County, Colorado
10.8
8.1–14.4
17.7
14.2–21.9
14.3
12.0–16.9
21.2
17.1–25.9
30.8
26.9–34.9
26.1
23.4–28.9
Pueblo County, Colorado
16.1
12.6–20.5
18.7
14.7–23.5
17.4
14.4–20.8
23.8
18.8–29.6
29.8
25.0–35.1
26.9
23.1–31.1
Teller County, Colorado
17.9
14.7–21.7
18.4
13.4–24.9
18.2
15.2–21.7
12.1
8.7–16.7
29.9
25.4–34.8
21.4
17.7–25.6
Weld County, Colorado
16.1
12.7–20.2
20.1
17.1–23.5
18.0
15.4–21.0
19.6
16.2–23.5
32.8
28.6–37.2
26.2
23.4–29.2
Minneapolis, Minnesota
19.8
14.4–26.6
20.7
17.1–24.9
20.2
16.9–23.9
20.2
15.7–25.7
23.2
19.0–28.0
21.6
18.2–25.4
Rochester, Minnesota
16.3
13.1–20.1
15.7
12.0–20.1
16.1
13.4–19.2
11.5
8.3–15.7
23.3
18.8–28.6
17.9
14.2–22.3
St. Paul, Minnesota
21.2
16.6–26.6
26.4
21.7–31.8
23.9
20.2–28.0
21.3
16.8–26.5
26.4
21.5–31.9
23.9
20.3–27.8
Broome County, New York
20.5
16.4–25.4
19.8
15.9–24.4
20.5
17.9–23.3
19.0
15.0–23.7
29.6
25.2–34.3
24.6
21.4–28.2
Chautauqua County, New York
21.2
17.0–26.1
22.4
18.3–27.1
21.8
18.9–25.0
18.6
14.1–24.0
33.1
28.7–37.9
26.1
22.4–30.0
Jefferson County, New York
17.0
12.8–22.2
17.9
13.7–23.1
17.6
14.9–20.7
20.5
16.6–25.0
36.5
30.5–43.0
28.7
24.9–32.7
Rockland County, New York
13.1
9.8–17.3
14.6
11.3–18.6
13.9
11.2–16.9
14.5
11.2–18.7
20.0
15.8–24.9
17.3
14.3–20.8
Fayette County, Pennsylvania
16.3
12.7–20.6
15.5
12.2–19.5
15.9
13.6–18.6
27.0
22.2–32.3
43.1
38.2–48.1
35.4
31.7–39.3
Luzerne County, Pennsylvania
19.1
15.5–23.2
15.5
13.2–18.0
17.3
15.4–19.4
22.1
18.9–25.6
40.1
35.6–44.7
31.4
29.0–34.0
Tioga County, Pennsylvania
20.7
17.5–24.3
22.2
18.2–26.7
21.4
18.7–24.4
27.2
23.7–31.0
37.1
32.8–41.6
32.3
29.2–35.7
Large cities/urban communities
Boston, Massachusetts
—††
—
—
—
—
—
25.1
21.2–29.5
30.1
25.8–34.7
27.7
24.7–31.0
Cleveland, Ohio
17.4
14.7–20.4
20.0
16.9–23.5
18.7
16.6–21.1
37.3
32.7–42.2
35.6
30.4–41.1
36.4
32.5–40.5
DeKalb County, Georgia
19.4
17.0–21.9
22.7
20.5–25.1
21.0
19.5–22.6
23.9
21.1–27.1
29.4
26.6–32.3
26.7
24.6–28.9
Hillsborough County, Florida
14.6
10.5–19.8
19.4
14.5–25.6
17.0
13.6–21.0
28.5
22.2–35.7
24.6
19.5–30.5
26.6
22.7–31.0
New Orleans, Louisiana
20.4
17.9–23.2
23.5
20.8–26.5
22.0
19.9–24.3
34.4
31.4–37.6
31.9
28.8–35.2
33.2
30.6–35.8
Philadelphia, Pennsylvania
16.7
13.8–20.1
16.2
12.4–20.9
16.6
13.9–19.7
27.9
23.2–33.1
30.8
25.7–36.4
29.1
25.0–33.6
Salinas, California
17.7
14.5–21.4
16.5
13.3–20.3
17.0
14.7–19.7
12.1
9.7–15.0
21.3
17.0–26.4
16.7
14.0–19.9
San Antonio, Texas
14.4
11.6–17.8
19.7
16.5–23.4
17.0
14.7–19.5
28.0
24.4–31.9
36.5
32.1–41.1
32.4
29.2–35.6
Santa Clara County, California
17.0
14.4–20.0
20.6
16.8–24.9
19.0
16.7–21.5
17.7
13.9–22.3
23.7
20.2–27.7
20.8
18.3–23.5
Tribe
Cherokee Nation, Oklahoma
16.6
11.9–22.6
19.2
13.9–25.9
17.9
15.0–21.2
37.4
30.4–45.0
52.9
44.7–61.1
45.3
40.0–50.7
Median
17.0
19.4
17.9
21.7
30.4
26.6
Range
10.8–21.2
14.6–26.4
13.9–23.9
11.5—37.4
20.0–52.9
16.7–45.3
United States
19.9
18.0–22.0
22.9
21.1–24.8
21.4
19.8–23.1
29.0
25.9–32.2
38.6
35.6–41.6
33.8
31.0–36.8
* 100% fruit juice, fruit, green salad, potatoes (excluding French fries, fried potatoes, or potato chips), carrots, or other vegetables.
† During the 7 days before the survey.
§ Not including diet soda or diet pop.
Ά 95% confidence interval.
†† Not available.
Return to top.
Table 8

TABLE 8. Percentage of high school students who met recommended levels of physical activity* and who did not participate in 60 or more minutes of physical activity on any day,† by sex — selected Steps communities, Youth Risk Behavior Survey, 2007
Met recommended levels of physical activity
Did not participate in 60 or more minutes
of physical activity on any day
Female
Male
Total
Female
Male
Total
Steps community
%
CI§
%
CI
%
CI
%
CI
%
CI
%
CI
State-coordinated small cities/
rural communities
Santa Cruz County, Arizona
18.4
14.9–22.5
37.4
31.7–43.5
27.7
23.8–32.0
40.6
36.3–45.2
20.2
16.3–24.8
30.5
27.3–33.8
Yuma County, Arizona
23.4
19.3–28.0
36.8
30.8–43.2
30.0
26.6–33.7
41.1
36.3–46.1
20.7
16.9–25.1
30.9
27.6–34.3
Mesa County, Colorado
29.2
24.8–34.1
49.6
44.7–54.4
39.5
35.9–43.2
28.1
23.2–33.6
14.0
10.8–17.9
21.0
18.1–24.2
Pueblo County, Colorado
31.3
26.7–36.3
44.4
38.0–51.0
38.0
34.1–42.1
26.0
20.9–31.8
15.3
11.2–20.5
20.5
17.0–24.5
Teller County, Colorado
35.2
29.8–41.1
38.2
31.5–45.4
36.7
32.6–41.0
24.0
19.2–29.6
12.5
9.5–16.4
18.2
14.9–22.0
Weld County, Colorado
25.2
21.3–29.5
41.5
36.7–46.6
33.3
29.6–37.2
26.6
22.3–31.5
16.8
13.0–21.5
21.8
18.2–25.8
Minneapolis, Minnesota
30.8
26.2–35.7
45.7
39.0–52.5
38.3
34.5–42.2
20.7
16.1–26.0
17.0
13.7–20.9
19.0
15.9–22.6
Rochester, Minnesota
36.4
30.3–43.0
53.9
49.5–58.2
45.0
41.3–48.8
10.5
8.2–13.4
11.5
8.7–15.1
10.9
9.2–13.0
St. Paul, Minnesota
35.9
30.8–41.4
53.7
47.9–59.4
45.0
40.4–49.7
16.8
13.3–21.0
11.3
8.3–15.3
13.9
11.6–16.6
Broome County, New York
41.4
35.1–48.1
52.1
46.3–57.9
46.9
41.9–51.9
14.0
10.1–19.2
10.9
8.4–14.0
12.5
9.9–15.7
Chautauqua County, New York
50.1
43.9–56.3
60.6
54.2–66.7
55.5
50.8–60.2
7.8
4.9–12.1
7.5
5.2–10.7
7.6
5.7–10.1
Jefferson County, New York
47.8
41.8–53.9
57.2
50.8–63.5
52.5
48.1–56.9
13.9
10.1–18.9
8.8
5.9–12.9
11.4
9.1–14.2
Rockland County, New York
37.5
32.5–42.9
54.7
48.9–60.4
46.4
41.9–50.9
20.5
16.6–25.1
8.6
5.3–13.6
14.4
11.6–17.8
Fayette County, Pennsylvania
38.6
33.7–43.7
57.6
52.5–62.6
48.6
44.8–52.5
12.0
8.7–16.3
5.1
3.5–7.4
8.3
6.4–10.8
Luzerne County, Pennsylvania
40.7
35.6–46.0
59.1
54.5–63.6
50.2
46.3–54.1
13.2
10.6–16.3
7.8
5.5–11.0
10.4
8.6–12.7
Tioga County, Pennsylvania
44.9
39.6–50.3
57.3
52.6–61.8
51.1
47.6–54.7
11.7
9.1–14.9
6.8
5.0–9.2
9.3
7.7–11.2
Large cities/urban communities
Boston, Massachusetts
25.4
21.5–29.7
32.6
27.9–37.8
29.0
25.8–32.6
34.8
30.5–39.3
21.2
16.9–26.2
27.8
24.8–31.1
Cleveland, Ohio
26.0
21.1–31.5
43.6
38.7–48.6
34.6
30.4–39.1
28.6
25.1–32.4
15.9
12.4–20.1
22.4
20.2–24.7
DeKalb County, Georgia
26.8
24.0–29.7
44.8
41.8–47.8
35.7
33.6–37.9
27.3
24.6–30.2
16.8
14.6–19.3
22.1
20.2–24.1
Hillsborough County, Florida
22.6
16.8–29.5
44.8
37.3–52.7
33.3
29.0–37.8
31.4
24.4–39.4
14.4
10.3–19.7
23.1
18.6–28.3
New Orleans, Louisiana
30.7
27.5–34.1
42.4
38.7–46.1
36.4
33.6–39.2
28.5
25.7–31.6
18.6
16.5–21.0
23.6
21.6–25.7
Philadelphia, Pennsylvania
24.3
19.8–29.4
40.1
33.9–46.6
32.0
28.0–36.3
31.9
27.2–36.9
18.7
14.6–23.7
25.6
22.1–29.4
Salinas, California
34.2
29.7–39.0
50.3
45.3–55.2
42.3
38.9–45.9
17.8
14.5–21.5
9.7
7.7–12.2
13.7
11.8–15.8
San Antonio, Texas
29.1
25.2–33.2
52.2
48.2–56.1
40.8
37.7–44.0
24.5
21.1–28.3
10.9
8.5–14.0
17.7
15.4–20.4
Santa Clara County, California
40.1
34.7–45.7
50.8
45.7–55.9
45.5
41.1–50.0
15.1
12.5–18.2
9.1
6.5–12.5
12.0
9.9–14.5
Tribe
Cherokee Nation, Oklahoma
33.2
28.5–38.2
61.4
53.9–68.4
47.7
43.7–51.6
17.7
14.4–21.5
9.3
4.8–17.2
13.5
10.1–17.7
Median
32.2
49.9
40.1
22.3
12.0
17.9
Range
18.4–50.1
32.6–61.4
27.7–55.5
7.8–41.1
5.1–21.2
7.6–30.9
United States
25.6
22.8–28.6
43.7
41.1–46.4
34.7
32.5–37.0
31.8
29.2–34.5
18.0
16.4–19.8
24.9
23.2–26.6
* Were physically active doing any kind of physical activity that increased their heart rate and made them breathe hard some of the time for a total of at least 60 minutes per day on 5 or more days during the 7 days before the survey.
† Did not participate in 60 or more minutes of any kind of physical activity that increased their heart rate and made them breathe hard some of the time on at least 1 day during the 7 days before the survey.
§ 95% confidence interval.
Return to top.
Table 9

TABLE 9. Percentage of high school students who played video or computer games or used a computer* for 3 or more hours per day† and who watched 3 or more hours per day of television,† by sex — selected Steps communities, Youth Risk Behavior Survey, 2007
Used computers 3 or more hours per day
Watched television 3 or more hours per day
Female
Male
Total
Female
Male
Total
Steps community
%
CI§
%
CI
%
CI
%
CI
%
CI
%
CI
State-coordinated small cities/
rural communities
Santa Cruz County, Arizona
27.1
21.9–33.2
21.0
17.9–24.4
24.2
20.9–27.9
42.8
37.2–48.6
32.2
28.0–36.7
37.5
33.9–41.2
Yuma County, Arizona
18.2
14.8–22.1
22.0
18.4–26.0
20.1
17.6–22.8
36.4
32.1–41.0
29.0
24.8–33.6
32.8
29.5–36.3
Mesa County, Colorado
11.2
8.8–14.3
25.2
21.5–29.1
18.3
15.8–21.2
17.9
14.1–22.5
23.4
19.1–28.3
20.7
18.2–23.4
Pueblo County, Colorado
15.7
11.3–21.4
26.9
22.5–31.8
21.2
17.5–25.5
30.5
25.3–36.2
28.9
23.9–34.3
29.6
25.7–33.9
Teller County, Colorado
16.4
11.6–22.7
23.5
19.6–27.9
20.2
16.3–24.7
16.4
12.6–21.1
20.4
16.0–25.7
18.8
15.8–22.3
Weld County, Colorado
12.6
10.0–15.8
19.0
15.3–23.2
15.8
13.2–18.8
26.0
22.1–30.3
23.9
19.6–28.8
25.0
21.6–28.7
Minneapolis, Minnesota
13.1
10.5–16.3
20.9
17.5–24.7
17.1
14.9–19.6
34.0
29.1–39.2
28.0
23.3–33.2
30.7
27.2–34.5
Rochester, Minnesota
13.3
9.9–17.6
22.4
18.8–26.6
18.1
15.4–21.1
14.7
11.1–19.4
20.9
17.5–24.7
18.0
15.3–21.0
St. Paul, Minnesota
16.0
12.6–20.0
25.2
19.9–31.3
20.5
17.4–24.1
34.9
29.4–40.8
32.0
26.1–38.5
33.4
28.7–38.3
Broome County, New York
20.9
17.2–25.1
25.2
21.4–29.5
23.3
20.2–26.7
24.7
19.9–30.2
25.3
21.7–29.3
25.1
21.6–29.0
Chautauqua County, New York
18.8
15.5–22.7
24.8
19.8–30.6
22.0
19.2–25.1
24.4
20.2–29.2
26.5
21.2–32.6
25.4
22.5–28.6
Jefferson County, New York
15.5
12.0–19.8
30.0
25.2–35.3
23.0
19.7–26.7
26.0
20.5–32.4
31.1
24.5–38.5
28.5
23.7–33.9
Rockland County, New York
28.2
23.3–33.7
29.4
23.9–35.4
28.8
24.4–33.5
28.9
22.9–35.7
38.2
31.2–45.8
33.6
28.4–39.3
Fayette County, Pennsylvania
21.4
17.7–25.6
33.0
27.5–38.9
27.5
23.8–31.5
30.6
25.7–36.0
36.5
31.7–41.7
33.7
30.4–37.2
Luzerne County, Pennsylvania
26.3
22.0–31.1
36.2
32.7–39.9
31.5
28.5–34.7
25.0
20.9–29.6
30.3
26.7–34.2
27.8
24.9–31.0
Tioga County, Pennsylvania
19.7
16.5–23.2
24.1
19.7–29.1
21.9
18.9–25.3
25.1
21.4–29.2
28.1
24.0–32.6
26.7
23.7–30.0
Large cities/urban communities
Boston, Massachusetts
21.3
17.7–25.5
29.8
25.6–34.3
25.7
22.8–28.8
41.2
36.1–46.5
43.2
38.4–48.1
42.1
38.6–45.7
Cleveland, Ohio
22.8
18.7–27.4
32.9
28.0–38.2
27.8
24.5–31.4
59.8
52.7–66.5
54.2
49.9–58.5
57.2
52.5–61.7
DeKalb County, Georgia
21.7
19.6–24.0
26.0
23.2–29.0
23.8
22.1–25.6
53.1
49.2–57.0
51.7
48.0–55.4
52.3
49.3–55.3
Hillsborough County, Florida
24.1
19.5–29.3
26.1
21.0–32.0
25.1
21.8–28.7
44.1
36.9–51.5
42.6
36.8–48.7
43.3
37.7–49.1
New Orleans, Louisiana
27.4
24.5–30.5
28.8
25.8–32.0
28.0
25.9–30.3
55.2
51.1–59.3
46.2
42.2–50.2
50.5
47.4–53.7
Philadelphia, Pennsylvania
26.0
22.4–29.9
33.7
28.1–39.7
29.6
26.2–33.2
53.3
43.8–62.5
51.4
44.3–58.4
52.2
44.9–59.5
Salinas, California
17.5
15.0–20.4
27.8
24.0–32.0
22.7
20.4–25.1
30.8
26.5–35.5
34.2
30.4–38.1
32.5
29.4–35.8
San Antonio, Texas
19.5
16.5–23.0
28.9
24.6–33.7
24.3
21.7–27.1
43.7
39.8–47.7
47.9
43.6–52.1
45.7
42.6–48.8
Santa Clara County, California
23.1
20.0–26.6
32.0
26.5–38.0
27.8
24.7–31.2
39.0
34.7–43.4
40.5
35.8–45.4
39.8
36.2–43.6
Tribe
Cherokee Nation, Oklahoma
9.8
6.8–14.0
24.2
19.8–29.2
17.3
14.8–20.1
30.8
23.2–39.6
35.2
31.2–39.5
33.2
29.0–37.8
Median
19.6
26.0
23.1
30.8
32.1
33.0
Range
9.8–28.2
19.0–36.2
15.8–31.5
14.7–59.8
20.4–54.2
18.0–57.2
United States
20.6
18.6–22.7
29.1
26.6–31.8
24.9
22.9–27.0
33.2
30.7–35.9
37.5
35.0–40.0
35.4
33.1–37.7
* For something that was not school work.
† On an average school day.
§ 95% confidence interval.
Return to top.
Table 10

TABLE 10. Percentage of high school students who attended physical education (PE) classes, by sex — selected Steps communities, Youth Risk Behavior Survey, 2007
Attended PE classes*
Attended PE classes daily†
Female
Male
Total
Female
Male
Total
Steps community
%
CI§
%
CI
%
CI
%
CI
%
CI
%
CI
State-coordinated small cities/
rural communities
Santa Cruz County, Arizona
35.2
29.0–42.0
57.1
49.2–64.7
46.3
39.7–52.9
28.3
21.9–35.9
42.3
33.8–51.3
35.3
28.5–42.7
Yuma County, Arizona
38.8
29.2–49.2
53.3
45.6–60.8
46.0
39.1–53.1
28.6
20.3–38.6
37.4
29.9–45.5
32.9
26.5–39.9
Mesa County, Colorado
36.2
31.0–41.7
51.2
44.8–57.5
43.9
39.5–48.5
32.5
27.7–37.6
44.0
37.6–50.5
38.4
34.0–43.0
Pueblo County, Colorado
45.2
37.5–53.1
62.4
56.3–68.1
54.1
47.9–60.2
34.5
27.8–41.8
48.5
41.0–56.0
41.4
35.7–47.4
Teller County, Colorado
50.9
40.7–61.1
69.2
61.3–76.1
60.4
52.8–67.6
2.6
1.2–5.5
7.4
3.9–13.7
5.1
2.9–8.9
Weld County, Colorado
40.1
34.5–46.0
58.5
51.6–65.0
49.3
43.8–55.0
4.8
2.8–7.9
7.5
4.9–11.3
6.2
4.5–8.4
Minneapolis, Minnesota
35.0
30.5–39.8
42.5
35.8–49.4
38.7
33.9–43.8
23.5
19.2–28.4
26.2
20.1–33.4
24.9
20.4–29.9
Rochester, Minnesota
38.4
29.8–47.7
50.3
42.4–58.3
44.5
36.8–52.4
32.0
24.5–40.6
39.5
33.1–46.1
35.5
29.2–42.3
St. Paul, Minnesota
33.3
24.9–42.8
41.6
33.3–50.4
37.5
30.4–45.2
25.5
17.1–36.2
26.9
20.5–34.4
26.3
19.7–34.2
Broome County, New York
98.4
97.0–99.2
92.0
88.0–94.7
95.0
92.6–96.7
4.4
2.3–8.3
6.1
3.8–9.7
5.4
3.5–8.2
Chautauqua County, New York
96.6
93.7–98.2
92.7
89.3–95.1
94.7
92.2–96.4
2.9
1.3–6.5
7.0
4.5–10.9
5.0
3.1–8.0
Jefferson County, New York
95.6
92.9–97.3
95.5
90.9–97.8
95.5
92.7–97.3
2.4
0.9–5.8
2.4
1.1–5.3
2.4
1.3–4.4
Rockland County, New York
96.1
92.9–97.9
96.1
92.8–97.9
96.1
93.9–97.5
3.3
1.8–6.1
4.9
2.9–8.1
4.2
2.6–6.6
Fayette County, Pennsylvania
64.6
57.1–71.4
67.5
61.7–72.7
66.1
60.8–71.0
32.5
25.9–39.8
32.4
27.6–37.6
32.4
28.0–37.2
Luzerne County, Pennsylvania
72.9
65.4–79.2
75.3
68.9–80.7
74.2
68.2–79.4
9.4
6.0–14.4
11.9
9.2–15.2
10.8
8.2–14.0
Tioga County, Pennsylvania
69.3
62.1–75.6
69.3
61.2–76.4
69.3
62.8–75.1
42.2
35.5–49.2
40.9
33.7–48.6
41.5
35.9–47.3
Large cities/urban communities
Boston, Massachusetts
27.9
21.6–35.3
31.9
25.4–39.2
29.9
24.1–36.4
6.0
3.4–10.6
6.2
3.6–10.3
6.1
3.7–9.9
Cleveland, Ohio
21.6
16.4–27.9
29.6
24.5–35.3
25.5
21.0–30.6
13.6
8.9–20.4
17.2
12.2–23.8
15.3
11.0–21.0
DeKalb County, Georgia
35.6
29.3–42.5
45.3
40.1–50.6
40.4
35.4–45.6
27.0
21.2–33.7
29.5
25.2–34.2
28.2
23.8–33.0
Hillsborough County, Florida
22.2
16.4–29.3
39.5
31.4–48.2
30.8
25.0–37.1
13.8
10.2–18.5
23.8
17.2–31.8
18.7
15.0–23.0
New Orleans, Louisiana
52.6
46.1–59.1
55.9
50.9–60.9
54.4
49.4–59.2
29.3
23.8–35.6
29.3
25.0–34.0
29.2
24.9–34.0
Philadelphia, Pennsylvania
40.2
26.9–55.1
47.9
37.8–58.2
43.9
33.0–55.3
17.9
12.2–25.5
23.1
14.9–34.1
20.3
14.2–28.1
Salinas, California
46.8
38.3–55.5
54.0
45.7–62.1
50.4
42.6–58.2
26.8
19.7–35.3
26.1
20.7–32.3
26.5
21.0–32.8
San Antonio, Texas
44.2
39.2–49.3
55.3
49.9–60.6
50.0
45.6–54.3
35.9
31.4–40.7
45.2
39.6–51.0
40.8
36.6–45.2
Santa Clara County, California
69.0
59.6–77.0
76.2
68.0–82.9
72.8
64.7–79.6
46.4
35.2–58.0
47.0
34.0–60.4
46.4
34.7–58.6
Tribe
Cherokee Nation, Oklahoma
33.0
25.0–42.3
49.2
40.3–58.0
41.5
34.5–48.8
29.3
21.6–38.4
44.4
37.4–51.5
37.2
31.7–43.1
Median
42.2
55.6
49.6
26.1
26.5
26.4
Range
21.6–98.4
29.6–96.1
25.5–96.1
2.4–46.4
2.4–48.5
2.4–46.4
United States
49.4
41.8–56.9
57.7
51.7–63.5
53.6
47.0–60.1
27.3
22.1–33.2
33.2
28.4–38.5
30.3
25.4–35.8
* On 1 or more days in an average week when they were in school.
† 5 days in an average week when they were in school.
§ 95% confidence interval.
Return to top.
Table 11

TABLE 11. Percentage of high school students who played on at least one sports team,* by sex — selected Steps communities, Youth Risk Behavior Survey, 2007
Female
Male
Total
Steps community
%
CI†
%
CI
%
CI
State-coordinated small cities/
rural communities
Santa Cruz County, Arizona
43.0
38.1–48.0
58.9
53.3–64.2
50.8
46.5–55.1
Yuma County, Arizona
35.1
30.1–40.5
52.9
46.6–59.1
43.9
39.4–48.6
Mesa County, Colorado
50.3
44.1–56.5
59.8
53.9–65.3
55.1
50.4–59.7
Pueblo County, Colorado
54.4
47.8–60.9
63.9
57.6–69.8
59.5
54.7–64.1
Teller County, Colorado
57.7
51.6–63.6
62.2
56.2–67.8
60.0
55.1–64.7
Weld County, Colorado
52.4
47.1–57.6
61.2
56.5–65.8
57.0
53.0–60.9
Minneapolis, Minnesota
45.6
39.1–52.2
63.1
56.4–69.3
54.3
49.0–59.6
Rochester, Minnesota
62.0
54.9–68.6
69.7
64.9–74.0
66.0
61.5–70.2
St. Paul, Minnesota
49.3
42.4–56.2
56.7
51.9–61.4
52.9
48.0–57.9
Broome County, New York
59.7
52.9–66.1
64.9
60.1–69.4
62.2
57.9–66.4
Chautauqua County, New York
67.5
61.4–73.1
74.4
68.6–79.4
71.0
66.4–75.3
Jefferson County, New York
66.4
59.1–73.0
63.1
57.8–68.2
64.7
60.4–68.8
Rockland County, New York
56.5
50.9–61.9
67.3
61.1–72.9
62.1
57.7–66.3
Fayette County, Pennsylvania
47.2
40.9–53.6
58.0
51.5–64.2
52.9
47.8–57.9
Luzerne County, Pennsylvania
55.0
49.6–60.3
62.3
57.5–66.8
58.7
54.8–62.4
Tioga County, Pennsylvania
61.0
55.3–66.4
60.5
55.5–65.2
60.8
56.9–64.5
Large cities/urban communities
Boston, Massachusetts
43.7
38.9–48.6
61.0
56.3–65.5
52.6
49.0–56.1
Cleveland, Ohio
39.9
34.4–45.6
53.1
45.4–60.7
46.4
41.8–51.0
DeKalb County, Georgia
46.9
43.2–50.6
58.6
55.3–62.0
52.8
50.1–55.5
Hillsborough County, Florida
48.2
42.8–53.7
57.2
50.2–63.9
52.5
48.0–57.0
New Orleans, Louisiana
41.9
38.8–45.1
63.2
59.9–66.5
52.4
49.9–54.9
Philadelphia, Pennsylvania
35.0
27.5–43.4
56.6
51.3–61.7
45.4
40.3–50.7
Salinas, California
43.9
38.5–49.4
53.4
48.9–57.9
48.7
45.2–52.2
San Antonio, Texas
42.0
37.7–46.4
59.4
55.3–63.5
50.7
47.8–53.6
Santa Clara County, California
49.4
42.2–56.7
61.9
57.4–66.3
55.8
51.5–60.1
Tribe
Cherokee Nation, Oklahoma
48.9
42.0–55.7
70.8
65.3–75.7
60.1
55.7–64.3
Median
49.1
61.1
54.7
Range
35.0–67.5
52.9–74.4
43.9–71.0
United States
50.4
47.1–53.7
62.1
59.5–64.7
56.3
53.7–58.9
* Run by their school or community groups during the 12 months before the survey.
† 95% confidence interval.
Return to top.
Table 12

TABLE 12. Percentage of high school students who were obese*† and who were overweight,†§ by sex — selected Steps communities, Youth Risk Behavior Survey (YRBS), 2007
Obese
Overweight
Female
Male
Total
Female
Male
Total
Steps community
%
CIΆ
%
CI
%
CI
%
CI
%
CI
%
CI
State-coordinated small cities/
rural communities
Santa Cruz County, Arizona
7.3
4.4–11.9
16.7
13.7–20.2
12.2
10.2–14.5
16.8
13.7–20.4
17.1
13.0–22.1
17.0
14.4–19.8
Yuma County, Arizona
10.6
8.0–13.9
22.5
19.4–26.0
16.9
14.5–19.5
18.5
14.7–23.1
17.5
14.7–20.8
18.0
16.0–20.3
Mesa County, Colorado
6.4
4.0–10.0
9.2
6.9–12.1
7.8
6.1–10.1
9.3
6.5–12.9
12.0
9.3–15.4
10.7
8.7–13.0
Pueblo County, Colorado
8.4
5.9–11.8
15.7
12.2–19.9
12.2
9.8–15.0
14.2
10.8–18.5
13.2
10.4–16.5
13.7
11.4–16.3
Teller County, Colorado
2.4
1.2–4.8
6.8
4.4–10.4
4.6
3.1–6.8
6.3
4.4–9.0
10.1
6.8–14.8
8.3
6.2–10.9
Weld County, Colorado
7.1
5.1–9.7
16.5
13.5–20.1
11.9
10.1–14.0
13.2
10.6–16.5
11.5
9.0–14.6
12.3
10.4–14.5
Minneapolis, Minnesota
11.2
6.4–19.1
15.8
11.8–20.8
13.6
10.4–17.5
16.1
12.0–21.1
13.1
10.3–16.6
14.5
12.2–17.3
Rochester, Minnesota
3.4
1.9–6.0
12.0
9.2–15.5
7.8
6.3–9.6
13.1
10.1–16.9
12.8
10.0–16.2
12.9
11.0–15.2
St. Paul, Minnesota
12.3
9.1–16.4
17.3
13.2–22.2
14.9
12.3–17.9
14.2
10.7–18.5
13.5
10.3–17.5
13.8
11.4–16.6
Broome County, New York
7.3
5.1–10.2
12.9
9.8–16.9
10.2
8.3–12.5
13.1
10.2–16.9
15.7
12.5–19.6
14.5
12.3–17.0
Chautauqua County, New York
9.5
6.6–13.6
16.1
12.9–19.9
12.9
10.5–15.8
15.4
10.5–21.9
16.8
13.2–21.1
16.1
12.7–20.2
Jefferson County, New York
7.3
5.0–10.6
22.0
13.9–32.9
15.0
9.7–22.4
15.7
12.1–20.2
14.2
10.3–19.2
14.9
12.6–17.5
Rockland County, New York
8.6
5.8–12.6
16.6
12.5–21.7
12.8
10.0–16.1
12.2
8.7–17.0
15.5
12.6–19.0
13.9
11.6–16.7
Fayette County, Pennsylvania
10.7
8.3–13.8
19.8
16.2–24.0
15.6
13.4–18.1
14.4
11.4–18.2
15.5
12.1–19.7
15.0
12.4–18.1
Luzerne County, Pennsylvania
6.8
4.6–9.9
14.1
11.1–17.7
10.6
8.6–13.0
14.3
11.8–17.4
15.0
12.1–18.3
14.7
12.7–16.8
Tioga County, Pennsylvania
9.9
8.0–12.3
17.2
13.6–21.5
13.7
11.4–16.3
21.1
18.0–24.5
17.0
13.7–20.8
19.0
16.8–21.3
Large cities/urban communities
Boston, Massachusetts
11.3
8.8–14.4
17.8
14.3–21.9
14.7
12.5–17.3
22.1
18.6–26.0
15.5
12.6–19.1
18.6
16.4–21.1
Cleveland, Ohio
14.4
11.6–17.8
18.1
14.3–22.7
16.3
14.2–18.6
25.3
20.2–31.2
14.6
11.4–18.5
19.9
16.9–23.2
DeKalb County, Georgia
13.4
11.5–15.5
12.8
10.7–15.3
13.1
11.7–14.7
16.9
14.8–19.2
15.8
13.4–18.6
16.3
14.9–17.9
Hillsborough County, Florida
11.1
7.3–16.7
16.7
12.9–21.4
13.9
11.1–17.2
15.0
10.9–20.4
14.9
10.9–20.0
14.9
12.3–18.0
New Orleans, Louisiana
12.7
10.7–15.0
20.6
17.5–24.1
16.7
14.6–18.9
20.2
17.7–23.0
14.6
12.5–17.0
17.4
15.8–19.2
Philadelphia, Pennsylvania
12.4
9.7–15.6
15.1
12.6–18.0
13.7
11.5–16.4
20.0
15.2–25.8
15.0
12.3–18.2
17.5
14.7–20.6
Salinas, California
8.9
6.1–12.9
22.3
18.8–26.2
15.8
13.6–18.4
18.3
15.4–21.6
18.9
15.6–22.7
18.6
16.7–20.7
San Antonio, Texas
16.4
13.5–19.7
23.8
20.5–27.5
20.2
18.0–22.6
21.3
18.4–24.4
17.1
13.9–20.9
19.1
16.9–21.6
Santa Clara County, California
8.0
5.7–11.2
16.9
13.5–20.8
12.6
10.5–15.1
21.9
18.1–26.3
17.8
14.5–21.6
19.8
17.1–22.7
Tribe
Cherokee Nation, Oklahoma
12.1
9.1–15.8
24.7
19.4–31.0
18.6
15.1–22.8
19.3
13.5–26.7
15.1
11.3–19.8
17.1
13.2–21.9
Median
9.7
16.7
13.6
15.9
15.0
15.5
Range
2.4–16.4
6.8–24.7
4.6–20.2
6.3–25.3
10.1–18.9
8.3–19.9
United States
9.6
8.3–11.0
16.3
15.1–17.5
13.0
11.9–14.1
15.1
13.8–16.5
16.4
15.4–17.5
15.8
14.8–16.8
* Students who were >95th percentile for body mass index (BMI), by age and sex, based on reference data.
† Previous YRBS reports used the terms “overweight” to describe those youth with a BMI >95th percentile for age and sex and “at risk for overweight” for those with a BMI >85th percentile and <95th percentile. However, this report uses the terms “obese” and “overweight” in accordance with the 2007 recommendations from the Expert Committee on the Assessment, Prevention, and Treatment of Child and Adolescent Overweight and Obesity convened by the American Medical Association (AMA) and cofunded by AMA in collaboration with the Health Resources and Services Administration and CDC.
§ Students who were >85th percentile but <95th percentile for BMI, by age and sex, based on reference data.
Ά 95% confidence interval.
Return to top.
Table 13

TABLE 13. Percentage of high school students who described themselves as slightly or very overweight and who were trying to lose weight, by sex — selected Steps communities, Youth Risk Behavior Survey, 2007
Described themselves as overweight
Were trying to lose weight
Female
Male
Total
Female
Male
Total
Steps community
%
CI*
%
CI
%
CI
%
CI
%
CI
%
CI
State-coordinated small cities/
rural communities
Santa Cruz County, Arizona
39.0
33.6–44.8
24.6
20.9–28.8
31.7
28.0–35.7
66.9
61.2–72.2
39.4
35.4–43.6
53.1
49.3–56.9
Yuma County, Arizona
37.2
32.5–42.3
31.7
28.2–35.4
34.4
31.5–37.4
62.5
57.2–67.5
40.3
35.8–45.0
51.3
47.1–55.5
Mesa County, Colorado
34.2
28.6–40.3
18.1
14.6–22.2
25.9
22.6–29.5
55.4
49.6–61.0
25.1
21.2–29.5
39.8
36.8–42.9
Pueblo County, Colorado
37.3
32.1–42.9
22.3
18.9–26.1
29.7
26.3–33.3
60.9
55.9–65.6
28.6
24.5–33.0
44.5
40.6–48.6
Teller County, Colorado
29.5
24.3–35.3
18.4
14.4–23.1
23.8
20.2–27.9
58.6
53.6–63.4
23.0
19.1–27.5
40.2
36.4–44.0
Weld County, Colorado
32.7
29.1–36.4
23.1
19.6–27.1
27.8
25.3–30.5
59.0
54.2–63.5
32.8
28.1–37.9
45.7
42.2–49.3
Minneapolis, Minnesota
31.0
25.5–37.1
17.2
12.9–22.5
24.0
20.6–27.7
46.9
41.0–52.9
25.4
20.5–30.9
36.2
32.8–39.7
Rochester, Minnesota
29.4
24.4–35.1
22.4
19.0–26.1
25.8
22.6–29.3
55.3
49.4–61.1
23.6
19.9–27.6
39.1
35.4–43.0
St. Paul, Minnesota
34.3
29.2–39.7
23.2
19.4–27.5
28.6
25.4–32.2
55.4
49.8–60.8
30.5
24.9–36.7
42.8
38.9–46.8
Broome County, New York
31.4
26.3–37.0
23.5
20.0–27.4
27.3
23.9–30.9
58.2
52.0–64.2
29.2
24.3–34.7
43.1
38.8–47.5
Chautauqua County, New York
33.5
26.8–40.9
25.0
21.2–29.2
29.2
25.6–33.0
61.6
55.4–67.5
32.0
27.3–37.1
46.4
42.7–50.2
Jefferson County, New York
31.3
25.8–37.4
27.4
19.7–36.7
29.2
23.6–35.6
59.8
54.1–65.3
33.5
26.7–41.0
46.2
41.5–51.1
Rockland County, New York
29.8
25.0–35.1
29.3
24.7–34.3
29.5
26.2–33.1
60.7
56.2–64.9
33.2
28.9–37.8
46.6
43.3–49.9
Fayette County, Pennsylvania
35.9
30.7–41.4
26.5
21.8–31.9
31.0
27.7–34.5
69.9
65.6–73.8
31.8
27.1–37.0
49.9
46.5–53.2
Luzerne County, Pennsylvania
32.8
28.4–37.5
23.2
19.2–27.7
27.8
24.7–31.1
60.6
56.4–64.6
25.9
22.2–29.9
42.6
39.4–45.9
Tioga County, Pennsylvania
38.0
34.1–42.1
26.2
21.9–30.9
32.0
28.9–35.3
59.2
54.7–63.6
30.4
26.3–34.9
44.6
41.2–48.1
Large cities/urban communities
Boston, Massachusetts
35.4
31.4–39.6
23.3
19.6–27.3
29.1
26.1–32.2
54.7
50.8–58.6
30.5
26.7–34.6
42.1
38.9–45.4
Cleveland, Ohio
31.5
27.1–36.2
19.9
16.3–24.1
25.9
22.5–29.5
46.0
40.3–51.8
27.6
23.7–31.8
37.0
33.1–41.1
DeKalb County, Georgia
30.1
27.4–32.9
16.1
13.8–18.6
23.1
21.3–25.0
51.3
48.4–54.1
26.1
23.4–28.9
38.6
36.3–41.0
Hillsborough County, Florida
32.5
26.7–38.9
21.1
16.4–26.7
27.1
23.2–31.3
56.6
48.7–64.1
27.9
22.7–33.9
42.7
38.1–47.4
New Orleans, Louisiana
24.8
21.8–28.0
17.3
14.5–20.7
21.1
19.0–23.5
46.5
42.8–50.2
30.4
26.6–34.5
38.5
35.5–41.6
Philadelphia, Pennsylvania
27.4
23.6–31.6
18.9
15.6–22.7
23.1
20.5–26.0
45.5
40.6–50.5
27.0
22.6–31.9
36.4
32.8–40.2
Salinas, California
41.7
36.9–46.6
31.1
26.3–36.3
36.3
32.8–40.0
65.2
60.6–69.5
37.2
32.6–42.0
51.0
47.3–54.7
San Antonio, Texas
36.0
31.8–40.3
29.9
26.6–33.5
32.8
30.1–35.6
61.1
57.1–64.9
46.0
41.3–50.8
53.4
50.4–56.5
Santa Clara County, California
44.2
39.3–49.2
28.6
24.4–33.2
36.3
32.7–40.0
60.7
56.5–64.7
35.5
30.5–40.8
47.9
44.2–51.7
Tribe
Cherokee Nation, Oklahoma
37.1
30.8–44.0
25.3
18.7–33.1
30.8
26.7–35.3
64.6
57.4–71.1
33.0
28.3–38.1
48.2
43.6–52.9
Median
33.1
23.2
28.8
59.1
30.4
43.8
Range
24.8–44.2
16.1–31.7
21.1–36.3
45.5–69.9
23.0–46.0
36.2–53.4
United States
34.5
32.9–36.1
24.2
23.0–25.3
29.3
28.2–30.4
60.3
58.4–62.1
30.4
28.8–32.1
45.2
43.8–46.7
* 95% confidence interval.
Return to top.
Table 14

TABLE 14. Percentage of high school students who ate less food, fewer calories, or low-fat foods* and who exercised,* by sex — selected Steps communities, Youth Risk Behavior Survey, 2007
Ate less food, fewer calories, or low-fat foods
to lose weight or to keep from gaining weight
Exercised to lose weight
or to keep from gaining weight
Female
Male
Total
Female
Male
Total
Steps community
%
CI†
%
CI
%
CI
%
CI
%
CI
%
CI
State-coordinated small cities/
rural communities
Santa Cruz County, Arizona
52.9
47.7–58.1
32.0
27.5–36.8
42.7
39.1–46.4
70.6
64.7–75.9
61.7
56.7–66.5
65.9
61.6–69.9
Yuma County, Arizona
49.2
44.5–53.9
32.0
28.3–36.0
40.6
37.4–43.9
67.5
62.1–72.5
59.2
55.4–63.0
63.4
59.8–66.9
Mesa County, Colorado
50.1
45.8–54.5
20.4
17.1–24.1
34.9
31.9–38.1
68.4
63.2–73.2
48.5
43.2–53.9
58.3
54.4–62.1
Pueblo County, Colorado
51.7
45.9–57.4
22.7
19.1–26.6
36.9
33.4–40.4
73.2
67.8–78.0
55.1
49.3–60.7
64.1
59.9–68.1
Teller County, Colorado
54.4
48.7–60.0
20.1
16.9–23.8
36.8
33.2–40.7
74.2
69.1–78.7
50.1
44.2–56.0
61.8
58.2–65.4
Weld County, Colorado
52.3
48.4–56.1
28.6
24.2–33.5
40.4
37.6–43.4
72.3
68.0–76.1
58.8
53.8–63.7
65.5
62.3–68.6
Minneapolis, Minnesota
39.1
34.3–44.1
21.7
17.5–26.6
30.7
27.1–34.6
55.6
49.9–61.2
50.8
45.8–55.8
53.2
49.1–57.2
Rochester, Minnesota
51.5
46.9–56.0
20.7
17.1–24.9
36.0
32.8–39.4
73.9
69.1–78.1
44.8
40.7–49.0
59.2
55.7–62.6
St. Paul, Minnesota
43.8
38.4–49.5
24.1
19.1–30.0
33.8
30.3–37.6
59.3
54.7–63.7
53.5
46.9–60.0
56.4
51.9–60.8
Broome County, New York
50.8
45.4–56.2
26.3
22.3–30.7
38.2
34.4–42.2
72.5
68.0–76.6
51.6
47.9–55.3
61.7
58.6–64.7
Chautauqua County, New York
53.9
47.9–59.9
29.4
23.9–35.6
41.5
37.0–46.1
75.9
70.8–80.3
55.7
48.6–62.6
65.7
61.8–69.4
Jefferson County, New York
54.5
47.5–61.3
25.4
20.6–30.8
39.6
35.5–43.7
77.8
72.7–82.1
57.7
52.0–63.3
67.3
63.7–70.7
Rockland County, New York
55.1
49.4–60.7
29.8
25.5–34.6
42.2
38.8–45.7
70.3
64.7–75.3
59.0
53.5–64.2
64.5
60.9–67.9
Fayette County, Pennsylvania
62.2
57.1–67.0
29.0
24.3–34.2
44.7
41.2–48.2
78.4
74.5–81.9
53.8
48.4–59.1
65.5
62.0–68.8
Luzerne County, Pennsylvania
59.6
55.6–63.4
27.8
24.2–31.8
43.3
40.2–46.4
73.7
69.5–77.5
54.9
50.7–59.0
63.9
60.7–67.0
Tioga County, Pennsylvania
52.2
47.2–57.2
23.8
20.7–27.2
37.9
35.0–40.8
71.6
66.9–75.8
54.8
49.7–59.7
63.1
59.3–66.7
Large cities/urban communities
Boston, Massachusetts
—§
—
—
—
—
—
—
—
—
—
—
—
Cleveland, Ohio
32.4
28.1–37.0
28.6
23.2–34.8
30.6
27.6–33.8
46.8
40.9–52.8
54.3
49.2–59.3
50.4
47.0–53.8
DeKalb County, Georgia
39.2
36.3–42.2
25.6
22.8–28.7
32.5
30.3–34.8
56.8
53.9–59.6
54.2
50.6–57.8
55.6
53.2–57.9
Hillsborough County, Florida
44.8
38.5–51.3
23.7
17.5–31.3
34.7
29.8–40.0
57.8
52.1–63.4
49.7
42.7–56.6
53.8
49.6–57.9
New Orleans, Louisiana
35.2
32.1–38.5
25.4
22.4–28.6
30.5
28.1–32.9
53.1
50.0–56.2
54.7
50.8–58.6
53.8
51.2–56.3
Philadelphia, Pennsylvania
34.9
28.9–41.4
24.0
20.6–27.8
30.0
26.3–33.9
47.3
41.8–52.9
49.2
44.8–53.6
48.3
44.5–52.0
Salinas, California
49.0
44.4–53.6
29.0
25.2–33.2
38.9
35.5–42.5
67.2
62.8–71.2
62.1
57.5–66.5
64.6
61.1–67.9
San Antonio, Texas
45.5
41.6–49.4
33.4
29.5–37.7
39.2
36.5–42.0
63.9
60.3–67.3
68.3
64.1–72.4
66.2
63.5–68.8
Santa Clara County, California
48.4
44.4–52.3
26.9
23.2–30.9
37.6
34.8–40.4
68.9
63.9–73.5
63.6
59.4–67.7
66.1
62.7–69.3
Tribe
Cherokee Nation, Oklahoma
57.6
53.0–62.2
24.7
20.8–29.1
40.6
36.9–44.5
65.2
60.4–69.7
48.2
40.6–55.8
56.5
50.8–62.0
Median
50.8
25.6
37.9
68.9
54.7
63.1
Range
32.4–62.2
20.1–33.4
30.0–44.7
46.8–78.4
44.8–68.3
48.3–67.3
United States
53.2
51.2–55.1
28.3
27.2–29.5
40.6
39.4–41.9
67.0
65.2–68.7
55.0
53.6–56.4
60.9
59.8–62.1
* To lose weight or to keep from gaining weight during the 30 days before the survey.
† 95% confidence interval.
§ Not available.
Return to top.
Table 15

TABLE 15. Percentage of high school students who did not eat for 24 or more hours* and who took diet pills, powders, or liquids,*† by sex — selected Steps communities, Youth Risk Behavior Survey, 2007
Did not eat for 24 or more hours to
lose weight or to keep from gaining weight
Took diet pills, powders, or liquids
to lose weight or to keep from gaining weight†
Female
Male
Total
Female
Male
Total
Steps community
%
CI§
%
CI
%
CI
%
CI
%
CI
%
CI
State-coordinated small cities/
rural communities
Santa Cruz County, Arizona
18.1
14.4–22.6
8.5
6.0–12.0
13.5
11.1–16.4
9.6
6.8–13.4
7.2
5.3–9.8
8.4
6.6–10.7
Yuma County, Arizona
16.3
13.5–19.5
10.3
7.2–14.4
13.3
11.1–15.9
7.2
4.8–10.6
8.1
6.1–10.9
7.7
5.9–9.9
Mesa County, Colorado
15.2
11.8–19.3
7.7
5.4–10.9
11.4
9.5–13.6
6.4
4.3–9.6
6.8
4.6–10.0
6.6
5.0–8.7
Pueblo County, Colorado
14.2
10.9–18.4
9.6
6.9–13.2
11.9
9.9–14.4
10.0
7.3–13.4
8.7
6.0–12.4
9.4
7.6–11.6
Teller County, Colorado
15.2
11.1–20.5
7.0
4.6–10.5
11.0
9.0–13.4
9.2
6.7–12.5
7.2
4.7–11.1
8.2
6.5–10.2
Weld County, Colorado
16.8
13.2–21.3
7.5
5.2–10.8
12.1
9.9–14.7
9.4
7.1–12.4
6.9
4.8–9.8
8.1
6.5–10.1
Minneapolis, Minnesota
14.7
10.7–19.8
6.8
4.7–9.8
10.9
8.5–14.0
3.9
2.5–6.0
5.6
3.4–8.9
4.9
3.4–6.9
Rochester, Minnesota
12.7
9.3–17.0
3.9
2.4–6.6
8.6
6.8–10.7
4.1
2.3–7.2
3.2
1.6–6.1
3.6
2.4–5.5
St. Paul, Minnesota
8.8
6.0–12.9
4.4
2.7–6.9
6.5
5.0–8.5
4.4
2.4–7.6
2.3
1.1–4.5
3.4
2.2–5.2
Broome County, New York
12.2
9.9–14.8
8.7
5.8–12.9
10.7
8.7–13.1
4.6
3.1–6.9
7.6
5.0–11.4
6.4
4.6–8.7
Chautauqua County, New York
11.3
8.6–14.7
6.8
4.3–10.6
9.2
7.3–11.4
5.5
3.4–8.7
4.1
2.5–6.5
4.9
3.4–6.9
Jefferson County, New York
13.3
9.8–17.7
7.2
4.8–10.6
10.1
8.1–12.7
6.0
3.8–9.6
4.8
2.9–8.1
5.6
3.7–8.5
Rockland County, New York
11.1
7.7–15.7
6.2
3.9–9.7
8.6
6.5–11.3
4.6
2.8–7.3
6.8
3.9–11.4
5.7
3.9–8.1
Fayette County, Pennsylvania
15.0
11.6–19.2
7.3
5.0–10.7
11.0
9.0–13.3
8.0
5.7–11.0
6.7
4.8–9.3
7.3
5.8–9.1
Luzerne County, Pennsylvania
14.9
11.7–18.8
7.2
5.0–10.1
11.0
8.9–13.5
4.2
2.9–6.2
5.2
3.5–7.7
4.8
3.7–6.2
Tioga County, Pennsylvania
18.5
14.6–23.0
8.4
6.3–11.2
13.5
11.2–16.1
7.0
5.0–9.6
4.5
2.9–6.8
5.7
4.5–7.2
Large cities/urban communities
Boston, Massachusetts
14.3
11.4–17.8
11.1
8.8–13.9
12.8
10.7–15.1
5.9
4.0–8.5
6.2
3.9–9.8
6.2
4.6–8.3
Cleveland, Ohio
14.3
11.6–17.6
9.3
6.4–13.4
11.9
9.8–14.4
2.7
1.7–4.3
6.3
4.1–9.7
4.6
3.3–6.3
DeKalb County, Georgia
11.4
9.6–13.3
7.9
6.3–9.8
9.6
8.4–11.0
4.3
3.2–5.7
4.4
3.1–6.0
4.5
3.5–5.6
Hillsborough County, Florida
13.0
9.2–18.0
9.2
5.8–14.3
11.2
8.4–14.8
7.3
4.4–11.7
7.0
4.3–11.3
7.3
5.1–10.4
New Orleans, Louisiana
17.7
15.3–20.4
12.7
10.5–15.4
15.3
13.5–17.3
7.0
5.5–8.8
9.2
7.5–11.3
8.0
6.8–9.5
Philadelphia, Pennsylvania
11.0
8.1–14.8
9.0
6.3–12.6
10.0
7.8–12.7
3.6
2.2–5.8
6.4
4.1–9.8
5.2
3.8–7.1
Salinas, California
13.3
10.5–16.6
4.3
2.7–6.6
8.7
7.1–10.7
5.9
4.0–8.8
3.2
2.1–4.8
4.5
3.5–5.9
San Antonio, Texas
13.7
10.9–17.0
8.4
6.3–11.1
11.0
9.4–12.8
6.8
4.9–9.4
4.1
2.9–5.8
5.4
4.3–6.9
Santa Clara County, California
14.1
11.4–17.3
6.9
4.5–10.5
10.6
8.7–12.9
8.4
6.3–11.3
4.3
2.5–7.2
6.3
4.8–8.4
Tribe
Cherokee Nation, Oklahoma
22.9
16.9–30.3
7.9
4.9–12.5
15.1
11.3–19.8
14.7
10.5–20.1
6.7
3.7–12.1
10.5
7.6–14.4
Median
14.2
7.8
11.0
6.2
6.3
5.9
Range
8.8–22.9
3.9–12.7
6.5–15.3
2.7–14.7
2.3–9.2
3.4–10.5
United States
16.3
15.2–17.3
7.3
6.1–8.6
11.8
11.0–12.6
7.5
6.6–8.4
4.2
3.5–5.1
5.9
5.2–6.5
* To lose weight or to keep from gaining weight during the 30 days before the survey.
† Without a doctor’s advice.
§ 95% confidence interval.
Return to top.
Table 16

TABLE 16. Percentage of high school students who vomited or took laxatives,* by sex — selected Steps communities, Youth Risk Behavior Survey, 2007
Female
Male
Total
Steps community
%
CI†
%
CI
%
CI
State-coordinated small cities/
rural communities
Santa Cruz County, Arizona
11.8
8.7–15.9
4.6
2.7–7.8
8.3
6.2–10.9
Yuma County, Arizona
8.7
6.6–11.5
8.0
5.0–12.5
8.4
6.5–10.7
Mesa County, Colorado
4.6
3.0–7.0
1.2
0.6–2.5
2.9
1.9–4.3
Pueblo County, Colorado
7.8
5.5–10.9
5.4
2.8–10.2
6.7
4.8–9.3
Teller County, Colorado
7.3
4.8–10.9
7.1
4.9–10.2
7.2
5.4–9.4
Weld County, Colorado
7.6
5.8–9.9
6.2
3.9–9.6
6.9
5.3–8.9
Minneapolis, Minnesota
5.1
3.4–7.7
3.7
1.9–7.1
4.6
3.0–6.8
Rochester, Minnesota
5.2
3.3–8.0
2.4
1.3–4.4
3.9
2.7–5.6
St. Paul, Minnesota
3.6
2.1–6.2
2.0
0.9–4.2
2.8
1.8–4.4
Broome County, New York
7.4
4.8–11.3
4.5
2.7–7.4
6.2
4.3–8.9
Chautauqua County, New York
3.7
2.3–6.0
3.7
1.9–7.1
3.7
2.4–5.6
Jefferson County, New York
6.6
4.2–10.1
1.4
0.6–3.4
4.1
2.9–5.9
Rockland County, New York
5.1
2.9–8.7
4.8
2.3–9.7
4.9
2.9–8.2
Fayette County, Pennsylvania
4.4
2.8–6.8
2.4
1.3–4.4
3.3
2.2–5.0
Luzerne County, Pennsylvania
4.6
3.0–7.0
3.4
2.2–5.2
4.0
3.0–5.4
Tioga County, Pennsylvania
4.1
2.4–6.9
4.1
2.6–6.3
4.1
3.0–5.7
Large cities/urban communities
Boston, Massachusetts
6.3
4.1–9.6
6.0
4.1–8.9
6.2
4.5–8.6
Cleveland, Ohio
6.2
4.4–8.6
6.9
4.6–10.1
6.5
4.8–8.8
DeKalb County, Georgia
6.0
4.8–7.5
4.1
2.9–5.7
5.1
4.2–6.2
Hillsborough County, Florida
6.8
4.7–9.8
4.3
2.3–7.9
5.5
3.9–7.8
New Orleans, Louisiana
6.7
5.3–8.4
9.1
7.2–11.4
7.9
6.6–9.3
Philadelphia, Pennsylvania
3.9
2.6–5.9
5.9
3.9–8.8
4.8
3.5–6.7
Salinas, California
7.0
5.3–9.2
3.6
2.1–5.9
5.3
4.2–6.6
San Antonio, Texas
6.6
4.6–9.3
3.1
1.9–5.1
4.8
3.6–6.4
Santa Clara County, California
5.1
3.7–7.0
2.0
1.1–3.7
3.9
2.7–5.6
Tribe
Cherokee Nation, Oklahoma
7.9
4.0–15.2
1.2
0.4–3.6
4.4
2.7–7.0
Median
6.2
4.1
4.8
Range
3.6–11.8
1.2–9.1
2.8–8.4
United States
6.4
5.5–7.4
2.2
1.7–2.8
4.3
3.7–5.0
* To lose weight or to keep from gaining weight during the 30 days before the survey.
† 95% confidence interval.
Return to top.
Table 17

TABLE 17. Percentage of high school students who had lifetime asthma* and who had current asthma,† by sex — selected Steps communities, Youth Risk Behavior Survey, 2007
Lifetime asthma
Current asthma
Female
Male
Total
Female
Male
Total
Steps community
%
CI§
%
CI
%
CI
%
CI
%
CI
%
CI
State-coordinated small cities/
rural communities
Santa Cruz County, Arizona
16.6
12.9–21.1
18.3
14.6–22.8
17.6
14.7–21.0
7.9
5.6–11.1
6.7
4.4–9.9
7.2
5.5–9.4
Yuma County, Arizona
16.1
13.1–19.6
18.8
15.6–22.5
17.4
15.2–19.9
7.8
5.7–10.4
8.5
6.6–10.9
8.1
6.7–9.7
Mesa County, Colorado
16.5
13.2–20.5
19.8
16.2–24.1
18.2
15.6–21.1
9.6
6.9–13.0
10.4
7.5–14.1
10.0
7.8–12.6
Pueblo County, Colorado
26.4
22.5–30.6
26.7
22.3–31.7
26.8
23.4–30.5
13.5
10.1–17.7
12.3
9.9–15.1
13.1
10.9–15.7
Teller County, Colorado
24.3
19.8–29.4
18.2
15.1–21.8
21.3
18.4–24.5
13.4
10.3–17.2
7.8
5.6–10.8
10.6
8.4–13.2
Weld County, Colorado
22.0
18.0–26.6
24.9
21.1–29.0
23.4
20.7–26.3
11.4
9.1–14.2
11.7
9.0–15.1
11.5
9.7–13.6
Minneapolis, Minnesota
21.5
17.6–25.8
18.8
14.6–23.8
20.2
17.2–23.5
14.5
11.4–18.2
7.9
5.5–11.3
11.2
9.1–13.6
Rochester, Minnesota
25.2
20.7–30.3
21.3
17.3–25.9
23.1
19.9–26.8
16.0
11.7–21.5
9.7
7.0–13.3
12.9
10.0–16.4
St. Paul, Minnesota
18.5
14.6–23.2
15.3
11.3–20.4
16.8
14.0–20.2
10.6
7.8–14.3
5.9
3.6–9.7
8.2
6.1–11.0
Broome County, New York
26.5
22.5–30.9
24.7
19.9–30.2
25.7
22.3–29.5
14.5
11.3–18.4
12.8
9.1–17.7
13.7
11.3–16.6
Chautauqua County, New York
25.6
20.5–31.3
27.4
22.7–32.5
26.5
23.5–29.7
18.1
14.5–22.3
15.4
11.7–20.2
16.7
14.1–19.8
Jefferson County, New York
24.8
18.2–32.8
23.6
18.5–29.6
24.1
19.2–30.0
16.2
10.9–23.4
13.2
9.2–18.6
14.7
10.5–20.1
Rockland County, New York
24.8
21.1–28.9
25.7
21.6–30.2
25.2
22.2–28.5
11.8
8.9–15.5
11.0
8.1–14.8
11.4
9.2–14.0
Fayette County, Pennsylvania
19.0
15.5–23.0
19.7
16.5–23.4
19.3
16.9–22.0
10.5
7.7–14.1
9.0
6.5–12.3
9.7
7.7–12.2
Luzerne County, Pennsylvania
19.1
15.1–24.0
18.6
14.7–23.3
18.9
15.6–22.7
10.8
7.9–14.6
7.6
5.9–9.8
9.2
7.3–11.5
Tioga County, Pennsylvania
19.4
16.5–22.5
18.1
14.0–22.9
18.7
16.3–21.3
8.6
6.4–11.3
7.4
5.1–10.6
8.0
6.4–9.9
Large cities/urban communities
Boston, Massachusetts
27.8
23.5–32.6
25.9
21.8–30.5
26.8
23.7–30.1
16.4
13.5–19.9
11.9
9.0–15.4
14.1
12.0–16.5
Cleveland, Ohio
18.0
14.9–21.7
26.0
21.4–31.2
21.9
19.2–24.8
11.2
8.8–14.3
12.9
9.8–16.7
12.0
10.1–14.3
DeKalb County, Georgia
23.5
21.4–25.8
26.9
24.2–29.8
25.3
23.6–27.1
13.1
11.1–15.4
11.7
9.9–13.8
12.5
11.1–13.9
Hillsborough County, Florida
25.0
20.4–30.2
28.8
22.4–36.1
26.9
23.0–31.2
13.7
9.7–19.1
15.9
11.0–22.3
14.7
11.3–18.9
New Orleans, Louisiana
25.6
23.2–28.1
31.6
28.5–34.9
28.5
26.5–30.5
12.8
10.5–15.5
12.3
10.3–14.8
12.5
10.9–14.4
Philadelphia, Pennsylvania
24.8
21.1–29.0
24.5
20.0–29.6
24.7
21.9–27.8
14.2
10.8–18.5
11.2
8.9–14.0
12.7
10.5–15.4
Salinas, California
20.0
16.5–24.1
17.3
14.7–20.3
18.6
16.5–21.0
10.1
7.5–13.5
6.8
5.1–8.9
8.4
6.7–10.5
San Antonio, Texas
17.3
14.6–20.4
16.9
13.6–20.8
17.4
15.2–19.8
9.5
7.5–12.0
7.3
5.3–10.0
8.5
7.0–10.3
Santa Clara County, California
18.8
14.8–23.6
23.3
18.6–28.7
21.3
18.8–24.0
8.5
6.1–11.7
7.8
6.0–10.0
8.4
7.1–9.8
Tribe
Cherokee Nation, Oklahoma
18.7
13.6–25.2
20.3
15.1–26.7
19.5
15.2–24.6
9.3
6.3–13.6
6.6
4.3–10.1
7.9
5.6–10.9
Median
21.8
22.3
21.6
11.6
10.0
11.3
Range
16.1–27.8
15.3–31.6
16.8–28.5
7.8–18.1
5.9–15.9
7.2–16.7
United States
20.7
19.2–22.2
19.9
18.6–21.3
20.3
19.2–21.4
12.5
11.3–13.8
9.3
8.4–10.3
10.9
10.1–11.9
* Ever told by a doctor or nurse that they had asthma.
† Ever told by a doctor or nurse that they had asthma and still have asthma.
§ 95% confidence interval.
Return to top.
Table 18

TABLE 18. Percentage of high school students who went to an emergency room or urgent care center because of their asthma,* by sex — selected Steps communities, Youth Risk Behavior Survey, 2007
Female
Male
Total
Steps community
%
CI†
%
CI
%
CI
State-coordinated small cities/
rural communities
Santa Cruz County, Arizona
—§
—
—
—
—
—
Yuma County, Arizona
—
—
—
—
—
—
Mesa County, Colorado
—
—
—
—
—
—
Pueblo County, Colorado
—
—
—
—
32.1
23.7–41.8
Teller County, Colorado
—
—
—
—
—
—
Weld County, Colorado
—
—
—
—
12.6
7.1–21.5
Minneapolis, Minnesota
—
—
—
—
17.6
9.5–30.3
Rochester, Minnesota
—
—
—
—
15.6
9.7–24.2
St. Paul, Minnesota
—
—
—
—
—
—
Broome County, New York
—
—
—
—
16.3
10.8–23.7
Chautauqua County, New York
—
—
—
—
17.6
10.5–28.0
Jefferson County, New York
—
—
—
—
—
—
Rockland County, New York
—
—
—
—
—
—
Fayette County, Pennsylvania
—
—
—
—
—
—
Luzerne County, Pennsylvania
—
—
—
—
23.6
16.1–33.3
Tioga County, Pennsylvania
—
—
—
—
—
—
Large cities/urban communities
Boston, Massachusetts
—
—
—
—
29.8
20.8–40.8
Cleveland, Ohio
—
—
—
—
37.0
28.3–46.7
DeKalb County, Georgia
44.1
35.9–52.7
29.6
21.0–39.9
37.7
31.4–44.4
Hillsborough County, Florida
—
—
—
—
—
—
New Orleans, Louisiana
—
—
—
—
—
—
Philadelphia, Pennsylvania
—
—
—
—
30.3
22.8–39.1
Salinas, California
—
—
—
—
—
—
San Antonio, Texas
—
—
—
—
—
—
Santa Clara County, California
—
—
—
—
26.8
16.4–40.7
Tribe
Cherokee Nation, Oklahoma
—
—
—
—
—
—
Median
44.1
29.6
25.2
Range
44.1–44.1
29.6–29.6
12.6–37.7
United States
—
—
—
—
—
—
* One or more times during the 12 months before the survey, among students who currently have asthma.
† 95% confidence interval.
§ Not available.
Return to top.

Use of trade names and commercial sources is for identification only and does not imply endorsement by the U.S. Department of Health and Human Services.


References to non-CDC sites on the Internet are provided as a service to MMWR readers and do not constitute or imply endorsement of these organizations or their programs by CDC or the U.S. Department of Health and Human Services. CDC is not responsible for the content of pages found at these sites. URL addresses listed in MMWR were current as of the date of publication.

All MMWR HTML versions of articles are electronic conversions from typeset documents. This conversion might result in character translation or format errors in the HTML version. Users are referred to the electronic PDF version (http://www.cdc.gov/mmwr) and/or the original MMWR paper copy for printable versions of official text, figures, and tables. An original paper copy of this issue can be obtained from the Superintendent of Documents, U.S. Government Printing Office (GPO), Washington, DC 20402-9371; telephone: (202) 512-1800. Contact GPO for current prices.

**Questions or messages regarding errors in formatting should be addressed to mmwrq@cdc.gov.

Date last reviewed: 11/12/2008

HOME  |  ABOUT MMWR  |  MMWR SEARCH  |  DOWNLOADS  |  RSSCONTACT
POLICY  |  DISCLAIMER  |  ACCESSIBILITY

Safer, Healthier People

Morbidity and Mortality Weekly Report
Centers for Disease Control and Prevention
1600 Clifton Rd, MailStop E-90, Atlanta, GA 30333, U.S.A

USA.GovDHHS

Department of Health
and Human Services