 |
|
|
|
|
|
|
| ||||||||||
|
|
|
|
|
|
|
||||
| ||||||||||
|
|
|
|
|
Persons using assistive technology might not be able to fully access information in this file. For assistance, please send e-mail to: mmwrq@cdc.gov. Type 508 Accommodation and the title of the report in the subject line of e-mail. Youth Tobacco Surveillance --- United States, 2001--2002LaTisha Marshall, MPH1
Corresponding author: LaTisha Marshall, MPH, Office on Smoking and Health, National Center for Chronic Disease Prevention and Health Promotion, CDC, 1600 Clifton Rd., NE, MS K-50, Atlanta, GA 30333. Telephone: 770-488-5902; Fax: 770-488-5848; E-mail: lnl9@cdc.gov. AbstractProblem/Condition: Cigarette smoking is the leading preventable cause of death in the United States, accounting for approximately 440,000 deaths each year. The prevalence of cigarette smoking nationwide among high school students (grades 9--12) increased during the 1990s, peaking during 1996--1997, and then declined. Approximately 80% of tobacco users initiate use before age 18 years. An estimated 6.4 million children aged <18 years who are living today will die prematurely as adults because they began to smoke cigarettes during adolescence. The annual health-related economic cost associated with tobacco use exceeds $167 billion. Because of these health and economic consequences, CDC has recommended that states establish and maintain comprehensive tobacco-control programs to reduce tobacco use among youth. Reporting Period: This report covers data collected during January 2001--December 2002. Description of the System: The National Youth Tobacco Survey (NYTS) and state youth tobacco surveys (YTS) were developed to provide states with data to support the design, implementation, and evaluation of comprehensive tobacco-control programs. NYTS is representative of middle and high school students in the 50 states and the District of Columbia. During spring 2002, a total of 26,149 students in 246 schools completed NYTS questionnaires. Weighted data for the YTS were achieved by 13 states in 2001 and by 20 states in 2002; state sample sizes varied (range: 982--38,934). This report summarizes data from the 2002 NYTS and the 2001 and 2002 YTS. Results and Interpretation: Findings from the 2002 NYTS indicate that current use of any tobacco product ranged from 13.3% among middle school students to 28.2% among high school students. Cigarette smoking was the most prevalent form of tobacco use, with 9.8% of middle school students and 22.5% of high school students reporting that they currently smoke cigarettes. Cigar smoking was the second most prevalent form of tobacco use, with 6.0% of middle school students and 11.6% of high school students reporting that they currently smoke cigars. Among current cigarette smokers, 41.8% of middle school students and 52.0% of high school students reported that they usually smoke Marlboro® cigarettes. Black middle school and high school students who smoke were more likely to smoke Newport® cigarettes than any other brand (58.3% and 66.8%, respectively). Among middle school students aged <18 years, 75.9% were not asked to show proof of age when they bought or tried to buy cigarettes, and 63.4% were not refused purchase because of their age. Among high school students aged <18 years, 58.5% were not asked to show proof of age when they bought or tried to buy cigarettes, and 60.6% were not refused purchase because of their age. Nearly half (49.6%) of middle school students and 62.1% of high school students who smoke reported a desire to stop smoking cigarettes, with 55.4% of middle school students and 53.1% of high school students reported having made at least one cessation attempt during the 12 months preceding the survey. Among students who have never smoked cigarettes, 21.3% of middle school students and 22.9% of high school students were susceptible to initiating cigarette smoking in the next year. Exposure to secondhand smoke (i.e., environmental tobacco smoke) was high. During the week before the survey, 1) 88.3% of middle school students and 91.4% of high school students who currently smoke cigarettes and 47.1% of middle school students and 53.3% of high school students who have never smoked cigarettes were in the same room with someone who was smoking cigarettes; 2) 81.7% of middle school students and 83.7% of high school students who currently smoke cigarettes and 31.5% of middle school students and 29.1% of high school students who have never smoked cigarettes rode in a car with someone who was smoking cigarettes; and 3) 71.5% of middle school students and 57.5% of high school students who currently smoke cigarettes and 33.3% of middle school students and 29.9% of high school students who have never smoked cigarettes lived in a home in which someone else smoked cigarettes. Media and advertising influence was also noted, with 58.1% of middle school students and 54.9% of high school students who currently use tobacco and 11.0% of middle school students and 13.7% of high school students who have never used tobacco reporting that they would wear or use an item with a tobacco company name or logo on it. Although 84.6% of middle school students and 91.2% of high school students had seen or heard antismoking commercials on television or radio, 89.9% of middle school students and 91.3% of high school students also had seen actors using tobacco on television or in the movies. Public Health Actions: Health and education officials use YTS and NYTS data to plan, evaluate, and improve national and state programs to prevent and control youth tobacco use. States can use these data in presentations to their state legislators to demonstrate the need for funding comprehensive tobacco-control programs, including tobacco cessation and prevention programs for youth. IntroductionCigarette smoking is the leading preventable cause of death in the United States (1), accounting for approximately 440,000 deaths each year (2). The prevalence of cigarette smoking nationwide among high school (grades 9--12) students increased during the 1990s (3), peaking during 1996--1997, then declined (4,5). Approximately 80% of tobacco users initiate use before age 18 years (6). An estimated 6.4 million children aged <18 years who are living today will die prematurely as adults because they began to smoke cigarettes during adolescence (7). The annual health-related economic costs associated with tobacco use exceed $167 billion (2). The National Youth Tobacco Survey (NYTS) and state youth tobacco surveys (YTS) were developed to provide states with the data necessary to support the design, implementation, and evaluation of a comprehensive tobacco-control program (8,9). Certain states have data regarding the prevalence of selected tobacco use behaviors among high schools students from the Youth Risk Behavior Surveillance System (YRBSS). YTS supplements YRBSS by providing more comprehensive data regarding tobacco use (bidis?,* cigarettes, cigars, kreteks,† pipes, and smokeless tobacco); exposure to secondhand smoke; smoking cessation; school curriculum; minors' ability to purchase or obtain tobacco products; knowledge and attitudes about tobacco and familiarity with protobacco and antitobacco media messages; and by providing information regarding both middle school (grades 6--8) and high school students. First conducted during fall 1999 (10) and then again during spring 2000 and 2002, NYTS is representative of all middle school and high school students in the 50 states and the District of Columbia. Funding for the first 3 years of NYTS was provided by the American Legacy Foundation (ALF) (District of Columbia), and all surveys were conducted during the spring semester of even years by ORC Macro (Calverton, Maryland). Implementation of the spring 2004 NYTS was supported and directed by CDC's Office on Smoking and Health. YTS was first conducted in 1998, with three states participating. Since then, the number of participating states has increased substantially; by the end of 2002, a total of 45 states and DC had conducted the YTS at least once, and 42 states and the District of Columbia had obtained weighted data that would provide representative estimates. Certain states conduct surveys annually, whereas others do so every other year or periodically. This report summarizes data from the 2002 NYTS and the 2001 and 2002 YTS. MethodsSamplingNYTS The 2002 NYTS consisted of two components: 1) a newly drawn sample of 215 middle schools and high schools and 2) a panel sample of 83 middle schools and high schools drawn from schools that were selected to participate in the 2000 NYTS. The newly drawn sample employed a three-stage cluster sample deign. The first-stage sampling frame contained 1,307 primary sampling units (PSUs) consisting of large counties or groups of smaller, adjacent counties. From these PSUs, 20 strata were formed by the United States being divided into four census regions, and then PSUs in each region were categorized into one of five "truth" levels, from lowest (1) to highest (5). These levels each represent and measure a different level of exposure to ALF's national truth® antitobacco campaign (11). Of these, 100 PSUs were selected with a probability proportional to size (PPS) method in which school enrollment was the measure of size. At the second sampling stage, 200 public and private schools that contained any or all of the eligible grades were selected from the 100 PSUs with a probability proportional to weighted school enrollment. In addition, 15 small schools were selected from 15 PSUs that were selected randomly from the sample PSUs. Schools with substantial numbers of Asian, black, and Hispanic students were sampled at higher rates than all other schools. At the third sampling stage, approximately five intact classes of a required subject (e.g., English or social studies) were randomly selected from a class schedule provided by each participating school. Class schedules were constructed to ensure that all students in the eligible grades were accounted for once and were not duplicated. All students in the selected classes were eligible to participate in the survey. The 83 panel sample schools were selected from the same 20 strata. Of these schools, 69 participated in the 2002 NYTS. The same data collection protocols were followed in panel schools as in the newly selected schools. Including both newly drawn and panel schools together, 298 schools were selected initially. Two schools were subsequently determined to be ineligible and were not replaced. One school had been part of the panel sample that was slated for participation in the 2000 NYTS sample but did not in fact participate and thus was ineligible for the 2002 survey. Students at the second school were predominantly Spanish speaking; because no Spanish version of the 2002 NYTS was available, and a substantial number of students were unable to read English at a level that would permit participation, the school was deemed ineligible. After exclusion of these two schools, 296 schools were determined to be eligible to participate in the survey. A weighting factor was applied to each student record to adjust for nonresponse and for varying probabilities of selection, including taking into account the correct probabilities of selection for newly selected schools versus panel schools and those resulting from oversampling Asian, black, and Hispanic students. The numbers of students in other racial/ethnic populations were too low for meaningful analysis.§ Weights were adjusted to ensure that the weighted proportions of students in each grade matched national population proportions. Final adjusted weights were scaled to ensure that the weighted count of students was equal to the total sample size. SUDAAN (11) was used to compute 95% confidence intervals (CIs). Two-sided t-tests were conducted to test for statistically significant differences between prevalence estimates. If the p-value was <0.05, then results were considered statistically significant. In certain instances, although CIs overlapped, the differences between the estimates were statistically significant on the basis of the t-tests. Only those comparisons that were determined to be statistically significant by the t-test are discussed in this report. NYTS produced a nationally representative sample of public and private middle school and high school students in all 50 states and the District of Columbia. Of the 296 eligible schools, 246 participated, and 26,149 questionnaires were completed by middle school and high school students in 246 schools. The school response rate was 83.1%, and the student response rate was 90.6%, resulting in an overall response rate (the school response rate multiplied by the student response rate) of 75.3%. YTS YTS employed a two-stage cluster sample design. The first-stage sampling frame included separate lists of public middle schools and high schools containing any or all of the eligible grades. Schools were selected with a probability proportional to school enrollment size. The number of schools selected varied by state. At the second sampling stage, classes were randomly selected from a class schedule provided by each participating school. Class schedules were constructed to ensure that all students in the eligible grades were counted once and were not duplicated. All students in the selected classes were eligible to participate in the survey. The number of classes selected varied by state. SAS (12) and SUDAAN (13) were used to compute 95% CIs. A total of 40 states conducted YTS in either 2001 or 2002; one state, Florida, conducted the survey during both years. Of the 41 state surveys conducted during 2001--2002, a total of 11 (Florida, Idaho, Louisiana, Maine, Michigan, Nevada, Pennsylvania, Rhode Island, South Carolina, Texas, and Utah) were conducted in spring 2001; six (California, Georgia, New Hampshire, New Jersey, South Dakota, and Virginia) in fall 2001; 20 (Alabama, Arkansas, Connecticut, Delaware, Florida, Illinois, Iowa, Kentucky, Maryland, Massachusetts, Minnesota, Nebraska, New York, North Carolina, Ohio, Oklahoma, Tennessee, Vermont, West Virginia, and Wisconsin) in spring 2002; and four (Indiana, Kansas, Mississippi, and New Mexico) in fall 2002. Of the 41 states that conducted the survey, 33 achieved an overall response rate of >60% at either the middle or high school level or both (Table 1). These states' data were weighted, and YTS surveys produced state-representative samples of middle and high school students. Data are presented in this report only for states for which data were weighted. Data for 11 states (Arkansas, California, Indiana, Louisiana, Maine, Minnesota, Nevada, New Mexico, South Carolina, Tennessee, and Virginia) for which data were not weighted at either the middle or high school level or both are not included in this report. Data for Utah also were excluded from this report at the request of the Utah Department of Health. YTS student sample sizes varied (range: 982--38,934). School response rates varied (range: 71.4%--100.0%), as did student response rates (range: 72.0%--95.8%) and overall response rates (range: 60.2%--91.2%). Data CollectionSurvey procedures were designed to protect student privacy by ensuring that student participation was anonymous and voluntary. The survey was administered during one class period. Students completed a self-administered questionnaire in the classroom, recording their responses on an answer sheet. Questions varied by state. Both the YTS and NYTS questionnaires contained questions concerning tobacco use (bidis, cigarettes, cigars, kreteks, pipes, and smokeless tobacco), exposure to secondhand smoke, smoking cessation, school curriculum, minors' ability to purchase or obtain tobacco products, knowledge and attitudes about tobacco, and familiarity with protobacco and antitobacco media messages. Before the surveys were conducted, local parental permission procedures were followed, and state institutional review board criteria also were followed. ResultsPrevalence of Tobacco UseLifetime Tobacco Use Lifetime use was defined by asking whether students have ever 1) tried cigarettes, even one or two puffs; 2) tried smoking cigars, cigarillos, or little cigars, even one or two puffs; 3) used chewing tobacco, snuff, or dip, such as Redman®, Levi Garret®, Beechnut®, Skoal®, Skoal Bandits®, or Copenhagen®; 4) tried smoking bidis, even one or two puffs¶; 5) tried smoking kreteks, even one or two puffs?¶; or 6) tried smoking bidis, kreteks, both, or neither.** Middle School. Nationally, cigarettes were the most prevalent form of tobacco ever used (33.1%) among middle school students (Figure 1), with non-Hispanic black (37.9%) and Hispanic (35.8%)†† students significantly more likely than white (31.3%) and Asian (24.5%) students to have ever smoked cigarettes. Cigars were the second most prevalent form of tobacco ever used (16.7%), with male students (22.0%) significantly more likely than female students (11.5%) and Hispanic students (19.1%) significantly more likely than white (16.1%)†† or Asian (12.7%)†† students to have ever smoked cigars. Smokeless tobacco was the third most prevalent form of tobacco ever used (8.2%), with male students (12.4%) significantly more likely than female students (3.9%) and white students (8.7%) significantly more likely than Hispanic (6.0%) or Asian (4.6%)†† students to have ever used smokeless tobacco. The percentage of students reporting they had ever smoked bidis was 4.3%, with male students (5.6%) significantly more likely than female students (3.1%) and black (5.5%) and Hispanic (6.2%) students significantly more likely than white students (3.2%) to have ever smoked bidis. The percentage of students who had ever smoked kreteks was 5.2%. No significant differences were identified among subgroups (Table 2). Among the 31 states that asked students any or all of these questions, the percentage of students varied that had ever smoked cigarettes (range: 18.5% [New Hampshire]--50.0% [Louisiana]; median: 32.0%). Among 29 states, the percentage of students varied that had ever smoked cigars (range: 11.0% [New Hampshire]--28.5% [Louisiana]; median: 17.3%) (Table 3). Among 31 states, the percentage of students varied that had ever used smokeless tobacco (range: 5.5% [Maine]--22.3% [Kentucky]; median: 10.7%). Among 28 states, the percentage of students varied that had ever smoked bidis (range: 3.3% [Iowa]--10.7% [Louisiana]; median: 5.4%) or kreteks (range: 2.2% [New Hampshire]--7.7% [Texas]; median: 3.1%). High School. Nationally, cigarettes were the most prevalent form of tobacco ever used (57.4%) among high school students (Figure 1), with male students (59.6%) significantly more likely than female students (55.3%)††; white (57.2%), black (57.5%), and Hispanic (61.4%) students significantly more likely than Asian students (40.4%); and Hispanic students significantly more likely than white students†† to have ever smoked cigarettes. Cigars were the second most prevalent form of tobacco ever used (34.7%), with male students (44.4%) significantly more likely than female students (25.0%); white students (36.7%) significantly more likely than black (29.5%) or Asian (15.9%) students; and black and Hispanic (33.6%) students significantly more likely than Asian students to have ever smoked cigars. Smokeless tobacco was the third most prevalent form of tobacco ever used by students (16.2%), with male students (25.9%) significantly more likely than female students (6.4%); white students (19.6%) significantly more likely than black (7.0%), Hispanic (10.2%), or Asian (4.7%) students; and Hispanic students significantly more likely than black†† or Asian students to have ever used smokeless tobacco. The percentage of students reporting that they had ever smoked bidis was 8.5%, with male students (10.9%) significantly more likely than female students (6.0%); Hispanic (10.4%) students significantly more likely than white (7.7%)†† or Asian (6.3%) students to have ever smoked bidis; and black students (10.1%)†† significantly more likely than Asian students to have ever smoked bidis. The percentage of students reporting that they had ever smoked kreteks was 9.2%, with white (10.3%) and Hispanic (8.1%)†† students significantly more likely than black students (5.1%) to have ever smoked kreteks (Table 2). Among the 25 states that asked students any or all of these questions, the percentage of students who had ever smoked cigarettes varied (range: 51.2% [Maryland]--69.7% [West Virginia]; median: 60.6%). Among 23 states, the percentage of students who had ever smoked cigars varied (range: 30.3% [Florida, Spring 2002]--48.3% [Kentucky]; median: 38.8%). The percentage of students varied that had ever used smokeless tobacco (range: 10.5% [Florida, Spring 2002]--30.6% [Kentucky]; median: 20.0%), smoked bidis (range: 6.6% [Iowa]--18.8% [Rhode Island]; median: 11.0%), and smoked kreteks (range: 4.6% [Kansas]--12.6% [Rhode Island]; median: 8.6%) (Table 3). Current Tobacco Use Students were asked on how many of the preceding 30 days they had used cigarettes, cigars, smokeless tobacco, pipe tobacco, bidis, or kreteks¶. Current tobacco use was defined as use of any tobacco product on >1 of the preceding 30 days. Middle School. Nationally, 13.3% of students were current users of any tobacco product (Figure 2), with male students (14.7%) significantly more likely than female students (11.7%)†† and white (13.2%),†† black (13.5%),†† and Hispanic (12.5%)†† students significantly more likely than Asian students (8.6%) to currently use any tobacco product. Cigarettes were the most prevalent form of tobacco currently used (9.8%), with no significant differences among subgroups. Cigars were the second most prevalent form of tobacco currently used (6.0%), with male students (7.9%) significantly more likely than female students (4.1%) to currently smoke cigars. Smokeless tobacco and pipe tobacco were the third most prevalent forms of tobacco currently used (3.5%). Male students (5.3%) were significantly more likely than female students (1.6%) and white students (3.8%) were significantly more likely than black (2.3%) students to currently use smokeless tobacco. Male students (5.1%) were significantly more likely than female students (1.9%) and Hispanic students (4.3%)†† were significantly more likely than white students (2.8%) to currently smoke pipe tobacco. The percentage of students reporting that they currently smoke bidis was 2.4%, with male students (3.1%) significantly more likely than female students (1.7%) to currently smoke bidis. Hispanic (2.9%)†† and black (3.1%)†† students were significantly more likely than white students (1.8%) to currently smoke bidis. The percentage of students reporting they currently smoke kreteks was 2.0%, with male students (2.7%) significantly more likely than female students (1.1%) and Hispanic students (2.6%)†† significantly more likely than white students (1.5%) to currently smoke kreteks (Table 4). Among the 31 states that asked students any or all of these questions, the percentage of students who were current users of any form of tobacco varied (range: 7.4% [New Hampshire]--26.3% [Louisiana]; median: 13.2%). The percentage of students who currently smoke cigarettes varied (range: 5.1% [New Hampshire]--17.1% [Louisiana]; median: 9.2%). Among 29 states, the percentage of students varied that currently smoke cigars (range: 1.9% [New Hampshire]--12.5% [Louisiana]; median: 5.0%) or use smokeless tobacco (range: 1.2% [Massachusetts]--10.9% [Kentucky]; median: 3.2%). Among 27 states, the percentage of students who currently smoke pipe tobacco varied (range: 1.9% [Delaware]--6.3% [Louisiana]; median: 3.1%). Among 28 states, the percentage of students who currently smoke bidis varied (range: 1.5% [Iowa]--7.1% [Louisiana]; median: 3.2%). The state YTS survey did not ask about current use of kreteks (Table 5). High School. Nationally, 28.2% of students were current users of any tobacco product (Figure 2), with male students (32.6%) significantly more likely than female students (23.7%); white students (30.9%) significantly more likely than black (21.7%), Hispanic (24.1%), or Asian (14.6%) students; and black and Hispanic students significantly more likely than Asian students to currently use any tobacco product. Cigarettes were the most prevalent form of tobacco currently used (22.5%), with male students (23.9%)†† significantly more likely than female students (21.0%); white students (25.2%) significantly more likely than black (13.8%), Hispanic (19.8%), or Asian (12.2%) students; and Hispanic students significantly more likely than black or Asian students to currently smoke cigarettes. Cigars were the second most prevalent form of tobacco currently used (11.6%), with male students (16.9%) significantly more likely than female students (6.2%) and white (11.8%), black (12.0%), and Hispanic (10.8%) students significantly more likely than Asian students (5.4%) to currently smoke cigars. Smokeless tobacco was the third most prevalent form of tobacco used (5.9%), with male students (10.5%) significantly more likely than female students (1.2%); white students (7.3%) significantly more likely than black (1.8%), Hispanic (3.3%), or Asian (2.1%) students; and Hispanic students†† significantly more likely than black students to currently use smokeless tobacco. Pipe tobacco was the fourth most prevalent form of tobacco currently used (3.2%), with male students (5.0%) significantly more likely than female students (1.4%) and Hispanic students (4.6%) significantly more likely than white (2.8%) or Asian (2.7%)†† students to currently smoke pipe tobacco. The prevalence of use of bidis (2.6%) was similar to that for kreteks (2.7%), with male students (3.7%) significantly more likely than female students (1.5%) and Hispanic students (3.5%)†† significantly more likely than white students (2.2%) to currently smoke bidis. Male students (3.5%) also were significantly more likely than female students (1.8%) to currently smoke kreteks (Table 4). Among the 25 states that asked students any or all of these questions, the percentage of students that were current users of any form of tobacco varied (range: 24.3% [Florida, Spring 2002]--44.3% [Kentucky]; median: 32.0%); the percentage that currently smoke cigarettes also varied (range: 17.8% [Florida, Spring 2002]--34.2% [Kentucky]; median: 25.4%). Among 23 states, the percentage of students who currently smoke cigars varied (range: 9.1% [Connecticut]--17.1% [New Jersey]; median: 13.2%). Among 25 states, the percentage of students who currently use smokeless tobacco varied (range: 3.1% [Connecticut]--13.5% [Kentucky]; median: 6.9%). Among 21 states, the percentage of students who currently smoke pipe tobacco varied (range: 2.7% [Delaware and Wisconsin]--6.9% [Maryland]; median: 4.0%). Among 23 states, the percentage of students who currently smoke bidis varied (range: 2.7% [Iowa]--9.5% [Rhode Island]; median: 5.5%); YTS did not ask about current use of kreteks (Table 5). Ever Smoked Cigarettes Daily Students were asked if they had ever smoked cigarettes daily. Daily use was defined as ever having smoked at least one cigarette every day for 30 days. Middle School. Nationally, 5.8% of students had ever smoked cigarettes daily (Figure 3), with white students (6.2%) significantly more likely than black (4.4%)†† or Hispanic students (4.2%)†† to have ever smoked cigarettes daily (Table 6). Among the 30 states that asked this question, the percentage of students who had ever smoked cigarettes daily varied (range: 2.4% [Kansas]--10.8% [Louisiana]; median: 4.9%) (Table 7). High School. Nationally, 17.0% of students had ever smoked cigarettes daily (Figure 3), with white students (19.7%) significantly more likely than black (9.8%), Hispanic (12.1%), or Asian (10.1%) students to have ever smoked cigarettes daily (Table 6). Among the 24 states that asked this question, the percentage of students who had ever smoked cigarettes daily varied (range: 13.3% [Florida, Spring 2002]--29.1% [West Virginia]; median: 19.1%) (Table 7). Number of Cigarettes Smoked Per Day Among Current Cigarette Smokers Current cigarette smokers were asked how many cigarettes they smoked per day on the days they smoked during the preceding 30 days. Middle School. Nationally, 16.6% of current cigarette smokers had smoked six or more cigarettes per day on the days they smoked (Figure 3), with male students (19.8%)†† significantly more likely than female students (12.7%) to have smoked six or more cigarettes per day on the days they smoked (Table 6). Among the 31 states that asked this question, the percentage of current cigarette smokers that smoked six or more cigarettes per day on the days they smoked varied (range: 8.9% [Minnesota]--25.9% [Vermont]; median: 15.7%) (Table 7). High School. Nationally, 31.3% of current cigarette smokers had smoked six or more cigarettes per day on the days they smoked (Figure 3), with male students (34.4%)†† significantly more likely than female students (27.9%) and white students (34.5%) significantly more likely than black (20.4%) or Hispanic (19.6%) students to have smoked six or more cigarettes per day on the days they smoked (Table 6). Among the 25 states that asked this question, the percentage of current cigarette smokers that smoked six or more cigarettes per day on the days they smoked varied (range: 21.7% [Kansas]--44.0% [Kentucky]; median: 30.7%) (Table 7). Age of Initiation of Tobacco Use Cigarettes Middle School. Nationally, 8.1% of students first smoked a whole cigarette before age 11 years (Figure 4), with male students (9.8%) significantly more likely than female students (6.5%) to have done so (Table 8). Among the 30 states that asked this question, the percentage of students who first smoked a whole cigarette before age 11 years varied (range: 4.9% [Maryland]--14.3% [Louisiana]; median: 8.9%) (Table 9). High School. Nationally, 6.7% of students first smoked a whole cigarette before age 11 years (Figure 4), with male students (8.4%) significantly more likely than female students (5.0%) to have done so (Table 8). Among the 24 states that asked this question, the percentage of students who first smoked a whole cigarette before age 11 years varied (range: 5.7% [Connecticut]--11.9% [Florida]; median: 9.0%) (Table 9). Cigars** Middle Schools. Among the 27 states that asked a question concerning cigar use, the percentage of students who first smoked a cigar before age 11 years varied (range: 2.9% [Connecticut]--8.9% [Louisiana]; median: 5.1%) (Table 9). High Schools. Among the 20 states that asked a question concerning cigar use, the percentage of students who first smoked a cigar before age 11 years varied (range: 2.6% [Delaware]--6.4% [West Virginia]; median: 4.3%) (Table 9). Smokeless Tobacco** Middle Schools. Among the 27 states that asked a question concerning smokeless tobacco use, the percentage of students who initiated use of smokeless tobacco before age 11 years varied (range: 1.2% [Massachusetts]--10.2% [Kentucky]; median: 3.5%) (Table 9). High Schools. Among the 21 states that asked a question concerning smokeless tobacco use, the percentage of students who initiated use of smokeless tobacco before age 11 years varied (range: 1.3% [Massachusetts]--8.7% [Kentucky]; median: 3.2%) (Table 9). Established Use of Tobacco Products Smoked >100 Cigarettes in Lifetime Middle School. Nationally, 10.6% of students who had ever smoked cigarettes had smoked >100 cigarettes during their lifetime (Figure 5), with male students (12.2%) significantly more likely than female students (8.6%)†† and white students (12.9%) significantly more likely than black (5.7%) or Hispanic (5.6%) students to have done so (Table 10). Among the 30 states that asked this question, the percentage of middle school students that had ever smoked cigarettes reported smoking >100 cigarettes varied (range: 5.9% [New Jersey]--17.5% [Kentucky]; median: 10.1%) (Table 11). High School. Nationally, 28.0% of students who had ever smoked cigarettes had smoked >100 cigarettes in their lifetime (Figure 5), with male students (29.8%)†† significantly more likely than female students (26.0%); white students (33.5%) significantly more likely than black (12.1%), Hispanic (18.4%), or Asian (23.2%) students; and Hispanic and Asian students significantly more likely than black students to have done so (Table 10). Among the 24 states that asked this question, the percentage of high school students that had ever smoked cigarettes reported smoking >100 cigarettes varied (range: 20.3% [Texas]--39.2% [Kentucky]; median: 29.0%) (Table 11). Frequent Use of Tobacco Products Students were asked on how many of the preceding 30 days they had used a tobacco product. Frequent cigarette smoking was defined as having smoked on >20 of the preceding 30 days. Questions also were asked regarding frequent use of cigars, smokeless tobacco, pipes, bidi,** and kreteks.** Middle School. Nationally, 2.5% of students were frequent cigarette smokers (Figure 5), with white students (2.7%)†† significantly more likely than Hispanic students (1.5%) to smoke cigarettes frequently. Overall, 1.5% of students were frequent users of cigars, smokeless tobacco, pipes, bidis, or kreteks (Table 10). Among the 31 states that asked students any or all of these questions, the percentage of students who were frequent cigarette smokers varied (range: 1.1% [New Jersey]--5.4% [West Virginia]; median: 2.4%) (Table 11). Among 29 states, the percentage of students who were frequent cigar smokers varied (range: 0.1% [New Hampshire]--2.0% [Alabama]; median: 0.7%). Among the 31 states, the percentage of students who were frequent smokeless tobacco users varied (range: 0.2% [New Hampshire and Wisconsin]--3.1% [Kentucky]; median: 0.8%). Among 27 states, the percentage of students who were frequent smokers of pipe tobacco varied (range: 0.2% [Kansas]--1.1% [Kentucky]; median: 0.6%). Among 28 states, the percentage of students who were frequent bidi smokers varied (range: 0.1% [New Hampshire]--1.0% [Alabama]; median: 0.4%). High School. Nationally, 11.1% of students were frequent cigarette smokers (Figure 5), with white students (13.4%) significantly more likely than black (5.4%), Hispanic (6.2%), or Asian (7.0%) students to frequently smoke cigarettes. Overall, students who were frequent users of cigars, smokeless tobacco, pipes, bidis, and kreteks, accounted for <2.5% of students (Table 10). Among the 25 states that asked any or all of these questions, the percentage of students who were frequent cigarette smokers varied (range: 7.4% [Florida, Spring 2002]--20.2% [Kentucky]; median: 12.0%). Among 23 states, the percentage of students who were frequent cigar smokers varied (range: 0.4% [Wisconsin]--2.2% [North Carolina]; median: 1.3%). Among 25 states, the percentage of students who were frequent smokeless tobacco users varied (range: 0.3% [Connecticut]--4.9% [Kentucky]; median: 1.9%). Among 21 states, the percentage of students who were frequent smokers of pipe tobacco varied (range: none [Wisconsin]--1.7% [New York]; median: 0.7%). Among 23 states, the percentage of students who were frequent bidi smokers varied (range: 0.2% [Ohio]--1.8% [New York]; median: 0.8%) (Table 11). Brand of Cigarettes Usually Smoked Current cigarette smokers were asked what brand of cigarettes they had usually smoked during the preceding 30 days. Options included American Spirit®,¶ Basic®, Camel®, Doral®, GPC®, Kool®,¶ Lucky Strike®,¶ Marlboro®, Newport®, Parliament®,¶ Virginia Slims®, "some other brand," and "no usual brand." Because of low use of all brands other than Camel, Marlboro, and Newport, all other specific brands were subsumed in "some other brand." Middle School. Nationally, 41.8% of current cigarette smokers identified Marlboro as the brand they usually smoked, followed by Newport (26.3%), other brands (17.4%), no usual brand (8.8%), and Camel (5.8%) (Figure 6). Among current smokers, white (47.6%), Hispanic (46.9%), and Asian (30.9%)†† students were significantly more likely than black students (9.0%) to smoke Marlboro; and black students (58.3%) were significantly more likely than white (22.3%), Hispanic (20.4%), or Asian (25.0%) students to smoke Newport (Table 12). Among the 29 states that asked this question, the percentage of current cigarette smokers who usually smoked one of these three specific brands varied: Marlboro (range: 24.4% [Delaware]--63.5% [New Hampshire]; median: 43.9%), Newport (range: 2.1% [Idaho]--52.7% [Delaware]; median: 16.7%), and Camel (range: 2.4% [Delaware]--26.0% [Idaho]; median: 5.5%) (Table 13). High School. Nationally, 52.0% of current cigarette smokers identified Marlboro as the brand they usually smoked, followed by Newport (21.6%), other brands (11.7%), Camel (8.7%), and no usual brand (6.0%) (Figure 6). Among current smokers, white (56.6%), Hispanic (53.0%), and Asian (55.1%) students were significantly more likely than black students (12.8%) to smoke Marlboro; black students (66.8%) were significantly more likely than white (16.6%), Hispanic (21.5%), and Asian (16.4%) students to smoke Newport; and white students (9.5%) were significantly more likely than black (4.5%)†† or Hispanic (5.0%)†† students to smoke Camel (Table 12). Among the 23 states that asked this question, the percentage of current cigarette smokers varied who usually smoked one these three brands varied: Marlboro (range: 31.9% [Delaware]--64.4% [Texas]; median: 52.4%), Newport (range: 6.9% [Oklahoma]--55.0% [Delaware]; median: 19.5%), and Camel (range: 1.6% [Delaware]--21.8% [Wisconsin]; median: 9.5%) (Table 13). Susceptibility Among Students Who Have Never Smoked Cigarettes Students who have never smoked cigarettes were defined as not susceptible to initiating cigarette smoking during the next year if they responded that 1) they would not smoke a cigarette soon, 2) they definitely would not smoke a cigarette during the next year, and 3) they definitely would not smoke a cigarette offered to them by one of their best friends. This definition has been published previously (13). All other students were classified as susceptible to initiating cigarette smoking during the next year. Middle School. Nationally, 21.3% of students who have never smoked cigarettes were susceptible to initiating cigarette smoking during the next year. No significant differences were identified among subgroups (Table 14). Among the 29 states that asked this series of questions, the percentage of students who have never smoked cigarettes who were susceptible to initiating cigarette smoking during the next year varied (range: 17.4% [Idaho]--33.3% [New Jersey]; median: 23.9%) (Table 15). High School. Nationally, 22.9% of students who have never smoked cigarettes were susceptible to initiating cigarette smoking in the next year. Among students who have never smoked cigarettes, Hispanic students (31.7%) were significantly more likely than white (21.6%) or black students (18.4%) and Asian students (30.4%) were significantly more likely than black†† students to be susceptible to initiating cigarette smoking in the next year (Table 14). Among the 23 states that asked this series of questions, the percentage of students who have never smoked cigarettes who were susceptible to initiating cigarette smoking in the next year varied (range: 18.4% [Florida, Spring 2000]--35.4% [New Jersey]; median: 23.8%) (Table 15). Knowledge and Attitudes Regarding Tobacco UseSocial Influence One or More Closest Friends Smoke Cigarettes Students were asked how many of their four closest friends smoke cigarettes. Students were considered to have never smoked cigarettes if they answered "no" to whether they have tried or experimented with cigarette smoking, even one or two puffs. Middle School. Nationally, current cigarette smokers (89.7%) were significantly more likely than students who have never smoked cigarettes (15.4%) to report that one or more of their closest friends smoked cigarettes (Figure 7). No significant differences were observed among subgroups of students who have never smoked cigarettes. Among current cigarette smokers, female students (92.9%)†† were significantly more likely than male students (86.5%) to report that one or more of their best friends smoked cigarettes (Table 16). Among the 31 states that asked this question, the percentage of students who reported that one or more of their closest friends smoked cigarettes varied among students who have never smoked cigarettes (range: 13.1% [Massachusetts]--27.9% [West Virginia]; median: 18.6%) and among current cigarette smokers (range: 80.2% [Maryland and Wisconsin]--92.1% [Delaware]; median: 86.6%) (Table 17). High School. Nationally, current cigarette smokers (91.2%) were significantly more likely than students who have never smoked cigarettes (27.8%) to report that one or more of their closest friends smoke cigarettes (Figure 7). Among students who have never smoked cigarettes, Hispanic students (31.5%) were significantly more likely than black (25.4%)†† or Asian (24.1%)†† students to report that one or more of their closest friends smoke cigarettes. Among current cigarette smokers, white (92.6%) and Hispanic (90.2%)†† students were significantly more likely than black students (82.2%) to report that one or more of their closest friends smoke cigarettes (Table 16). Among the 25 states that asked this question, the percentage of students who reported that one or more of their closest friends smoked cigarettes varied among students who have never smoked cigarettes (range: 25.3% [Massachusetts]--47.5% [West Virginia]; median: 35.9%) and among current cigarette smokers (range: 81.2% [Connecticut]--95.1% [Iowa]; median: 90.6%) (Table 17). One or More Closest Friends Use Smokeless Tobacco Middle School. Nationally, current smokeless tobacco users (74.2%) were significantly more likely than students who have never used this product (6.4%) to report that one or more of their closest friends used smokeless tobacco (Figure 7). Among students who have never used smokeless tobacco, white (6.6%)†† and Hispanic (6.7%) students were significantly more likely than black students (4.2%) to report that one or more of their best friends use smokeless tobacco; no significant differences were identified among current smokeless tobacco users (Table 16). Among the 29 states that asked this question, the percentage of students who reported that one or more of their closest friends used smokeless tobacco varied among students who have never used smokeless tobacco (range: 6.2% [New York]--22.8% [Kentucky]; median: 12.8%) and among current smokeless tobacco users (range: 59.7% [Illinois]--90.1% [South Dakota]; median: 73.7%) (Table 17). High School. Nationally, current smokeless tobacco users (83.0%) were significantly more likely than students who have never used this product (11.8%) to report that one or more of their closest friends use smokeless tobacco (Figure 7). Among students who have never used smokeless tobacco, male students (13.6%)†† were significantly more likely than female students (10.4%); white students (13.9%) significantly more likely than black (6.0%), Hispanic (9.8%), or Asian (7.0%) students; and Hispanic students significantly more likely than black students to report that one or more of their closest friends use smokeless tobacco. Among current smokeless tobacco users, male students (84.9%) were significantly more likely than female students (66.4%) to report that one or more of their closest friends used smokeless tobacco (Table 16). Among the 23 states that asked this question, the percentage of students who reported that one or more of their closest friends used smokeless tobacco varied among students who have never used smokeless tobacco (range: 9.1% [Massachusetts]--29.6% [West Virginia]; median: 19.6%) and among current users of smokeless tobacco (range: 67.5% [Connecticut]--90.8% [Ohio]; median: 82.6%) (Table 17). Social Perception Regarding Cigarette Use Think that Cigarette Smokers Have More Friends Middle School. Nationally, current cigarette smokers (42.9%) were significantly more likely than students who have never smoked cigarettes (14.2%) to think that cigarette smokers have more friends (Figure 8). Among students who have never smoked cigarettes, black (21.1%) and Hispanic (16.4%)†† students were significantly more likely than white students (12.3%), and black students were significantly more likely than Hispanic†† and Asian (13.6%) students to think that cigarette smokers have more friends. Among current cigarette smokers, black (51.7%) and Hispanic (51.3%) students were significantly more likely than white students (37.8%) to think that cigarette smokers have more friends (Table 18). Among the 31 states that asked this question, the percentage of students who think that cigarette smokers have more friends varied among students who have never smoked cigarettes (range: 5.8% [Idaho and Iowa]--22.4% [Mississippi]; median: 12.0%) and among current cigarette smokers (range: 31.0% [Iowa]--56.7% [Maryland]; median: 43.6) (Table 19). High School. Nationally, current cigarette smokers (23.4%) were significantly more likely than students who have never smoked cigarettes (10.9%) to think that cigarette smokers have more friends (Figure 8). Among students who have never smoked cigarettes, male students (12.4%) were significantly more likely than female students (9.5%),†† and black (17.5%), Hispanic (15.7%), and Asian (14.7%)†† students were significantly more likely than white students (8.2%) to think that cigarette smokers have more friends. Among current cigarette smokers, male students (28.8%) were significantly more likely than female students (17.3%); black (42.0%), Hispanic (29.5%), and Asian (41.7%) students significantly more likely than white students (19.4%); and black students were significantly more likely than Hispanic students to think that cigarette smokers have more friends (Table 18). Among the 25 states that asked this question, the percentage of students who think that cigarette smokers have more friends varied among students who have never smoked cigarettes (range: 8.1% [Iowa]--22.4% [Mississippi]; median: 13.6%) and among current cigarette smokers (range: 23.1% [Ohio]--42.1% [Mississippi]; median: 28.0%) (Table 19). AccessHow Current Cigarette Smokers Aged <18 Years Usually Acquired Cigarettes Current cigarette smokers aged <18 years were asked how they usually had acquired cigarettes during the preceding 30 days. Options included 1) in a store, 2) from a vending machine, 3) someone else bought them, 4) borrowed them from someone else, 5) stole them (asked on NYTS), 6) took them from a store or family member (asked on YTS), 7) person aged >18 years gave them, and 8) obtained them some other way. Middle School. Nationally, the most common means by which current cigarette smokers usually acquired their cigarettes were 1) obtained some other way (25.0%) , 2) borrowed them from someone (24.9%), 3) had someone else buy them (21.7%), or 4) stole them (11.5%) (Figure 9). Among current cigarette smokers, white students (23.9%) were significantly more likely usually to have someone else buy their cigarettes for them than Hispanic students (14.7%) (Table 20). Hispanic (8.5%)†† students were significantly more likely than white (4.5%) students usually to buy their cigarettes in a store. Among the 31 states that asked this question, for the majority of states, the most common ways by which middle school students aged <18 years who currently smoke usually acquired their cigarettes were similar nationwide: borrowed cigarettes (range: 9.3% [Maine]--36.5% [Nebraska]; median 26.6%), had someone else buy cigarettes for them (range: 13.1% [New Jersey]--32.2% [South Dakota]; median: 23.6%), and acquired their cigarettes some other way (range: 9.3% [New Hampshire]--30.8% [Massachusetts]; median: 18.1%) (Table 21). High School. Nationally, the most common means by which current cigarette smokers aged <18 years usually acquired their cigarettes was by having someone else buy them (28.7%), buying them in a store (24.7%), or borrowing them from someone (20.6%) (Figure 9). A total of 11.1% of current cigarette smokers reported that they were given cigarettes by a person aged >18 years. Among current cigarette smokers aged <18 years, female students (32.8%) were significantly more likely than male students (24.6%)†† and white students (30.4%) were significantly more likely than Hispanic (22.1%)†† or black (20.4%)†† students usually to have someone else buy their cigarettes for them. Male students (31.2%) were significantly more likely than female students (18.1%) to purchase their cigarettes in a store. Female students (14.1%) were more likely than male students (8.2%) to be given cigarettes by a person aged >18 years. Hispanic students (14.6%)†† were more likely than white students (8.5%) to obtain their cigarettes some other way. Male students (4.3%)†† were more likely than female students (2.2%) and black students (6.6%)†† were significantly more likely than white students (2.5%) usually to steal their cigarettes (Table 20). Among the 25 states that asked this question, ways by which current smokers aged <18 years usually obtained cigarettes varied: had someone else buy them (range: 19.8% [Connecticut]--43.2% [Iowa]; median: 31.9%), purchased them in a store (range: 6.9% [Nebraska]--33.7% [New Jersey]; median: 20.9%), and borrowed them (range: 18.3% [Delaware]--30.5% [Massachusetts]; median: 25.1%) (Table 21). Where Current Cigarette Smokers Aged <18 Years Bought Last Pack of Cigarettes Current cigarette smokers aged <18 years were asked where they bought their last pack of cigarettes during the preceding 30 days. Response categories differed between the national and state surveys. NYTS response options were gas station, convenience store, discount store, grocery store, drug store, vending machine, and restaurant. YTS response options were gas station, convenience store, grocery store, drug store, vending machine, Internet, and other. The "other" category varied among the states. Middle School. Nationally, the most common locations where current cigarette smokers bought their last pack of cigarettes were a gas station (44.7%), a convenience store (23.0%), and a vending machine (11.6%) (Figure 10). Among current cigarette smokers, white students (48.1%)†† were significantly more likely than black students (33.3%) to have bought their last pack of cigarettes at a gas station. White students (6.3%) also were significantly more likely than black (1.6%)†† or Hispanic students (2.0%)†† to have bought their last pack of cigarettes at a discount store. Hispanic (11.1%)†† and black students (16.2%)†† were significantly more likely than white students (4.0%) to have bought their last pack of cigarettes at a grocery store (Table 22). Among the 29 states that asked this question, percentages varied of current cigarette smokers who purchased their last pack of cigarettes at a gas station (range: 9.7% [Massachusetts]--38.6% [New York]; median: 22.2%), at a convenience store (range: 3.2% [Iowa]--31.4% [New York]; median: 13.0%), from a vending machine (range: 0.9% [Iowa]--15.6% [Maine]; median: 3.9%), and in another location (range: 2.9% [Texas§§]--68.2% [Iowa]; median: 50.7%) (Table 23). High School. Nationally, the most common locations where high school students aged <18 years who are current cigarette smokers bought their last pack of cigarettes were a gas station (57.0%) and a convenience store (27.8%) (Figure 10). Among current cigarette smokers aged <18 years, white students (61.1%) were significantly more likely than black (37.3%) or Hispanic (46.6%)†† students to have bought their last pack of cigarettes at a gas station, and Hispanic students (9.8%)†† were significantly more likely than white students (4.5%) to have bought their last pack of cigarettes at a grocery store (Table 22). Among the 23 states that asked this question, percentages varied of current smokers aged <18 years who purchased their last pack of cigarettes at a gas station (range: 20.2% [New Jersey]--63.2% [Illinois]; median: 44.4%), at a convenience store (range: 13.5% [Wisconsin]--52.7% [New Jersey]; median: 22.5%), and in another location (range: 2.1% [Texas§§]--30.8% [Alabama]; median: 21.6%) (Table 23). EnforcementCurrent Cigarette Smokers Aged <18 Years Not Asked for Proof of Age Middle School. Nationally, 75.9% of current cigarette smokers aged <18 years were not asked to show proof of age when purchasing or attempting to purchase cigarettes from a store (Figure 11). No significant differences were identified among current cigarette smoker subgroups (Table 24). Among the 26 states that asked this question, the percentage of current cigarette smokers who were not asked to show proof of age when purchasing or attempting to purchase cigarettes at a store varied (range: 57.8% [Delaware]--92.6% [Georgia]; median: 74.2%) (Table 25). High School. Nationally, 58.5% of current cigarette smokers aged <18 years were not asked to show proof of age when purchasing or attempting to purchase cigarettes from a store (Figure 11). Among current smokers aged <18 years, black students (69.3%)†† were significantly more likely than white students (57.0%) to report that they were not asked to show proof of age (Table 24). Among the 24 states that asked this question, the percentage of current smokers aged <18 years who were not asked to show proof of age when purchasing or attempting to purchase cigarettes from a store varied (range: 54.3% [New York]--72.1% [Iowa]; median: 62.3%) (Table 25). Current Cigarette Smokers Aged <18 Years Not Refused Purchase Middle School. Nationally, 63.4% of current cigarette smokers were not refused purchase of cigarettes because of their age (Figure 11). No significant differences were identified among subgroups of current smokers (Table 24). Among the 26 states that asked this question, the percentage of current smokers who were not refused purchase of cigarettes because of their age varied (range: 54.3% [Florida, Spring 2002]--78.2% [Minnesota]; median: 69.1%) (Table 25). High School. Nationally, 60.6% of current cigarette smokers aged <18 years were not refused purchase of cigarettes because of their age (Figure 11). No significant differences were identified among subgroups of current smokers aged <18 years (Table 24). Among the 24 states that asked this question, the percentage of current smokers aged <18 years who were not refused purchase of cigarettes because of their age varied (range: 49.7% [Illinois]--68.0% [Wisconsin]; median: 60.9%) (Table 25). Exposure to Media and Advertising Regarding TobaccoSaw or Heard Antismoking Commercials The following questions were used to ascertain students' exposure to anti-tobacco media messages during the preceding 30 days: 1) during the past 30 days, how often did you see anti-smoking commercials on TV¶ and 2) during the past 30 days, how often did you hear anti-smoking commercials on the radio.¶ Students were defined as exposed to these messages if they saw or heard such a message at least once. Middle School. Nationally, 84.6% of middle school students saw or heard antismoking commercials (Figure 12). Female students (87.4%) were significantly more likely than male students (81.9%) and white (85.4%)†† and Hispanic (85.3%)†† students were significantly more likely than black students (81.8%) to have seen or heard such commercials (Table 26). Among the 29 states that asked this question, the percentage of students who saw or heard antismoking commercials varied (range: 69.1% [Maryland public schools]--91.3% [Iowa]; median: 80.3%) (Table 27). High School. Nationally, 91.2% of high school students saw or heard antismoking commercials (Figure 12). Female students (92.3%)†† were significantly more likely than male students (90.1%) and white students (92.2%) significantly more likely than Hispanic (90.1%),†† black (88.7%), or Asian (88.3%)†† students to have seen or heard such commercials (Table 26). Among the 23 states that asked this question, the percentage of students who saw antismoking commercials on television or heard antismoking commercials on the radio varied (range: 78.1% [Maryland]--93.1% [Iowa]; median: 84.9%) (Table 27). Saw Tobacco Use on Television or in Movies Students were asked how often they see actors smoking¶ or using tobacco** when they watch TV or go to the movies. For YTS, students who were exposed to these images are defined as those who responded to this question with "most of the time" or "some of the time." Middle School. Nationally, 89.9% of students had seen actors smoking on television or in the movies (Figure 12), with white (90.3%) and black (90.3%)†† students significantly more likely than Asian students (84.0%) and Hispanic (89.6%)†† students significantly more likely than Asian students to have to have done so (Table 26). Among the 28 states that asked this question, the percentage of students who had seen actors using tobacco on television or in the movies varied (range: 78.1% [New Hampshire]--90.2% [New Jersey]; median: 83.6%) (Table 27). High School. Nationally, 91.3% of students had seen actors smoking on television or in the movies (Figure 12), with female students (92.4%) significantly more likely than male students (90.2%) to have done so (Table 26). Among the 22 states that asked this question, the percentage of students who had seen actors using tobacco on television or in the movies varied (range: 85.0% [Maryland public schools]--91.3% [New York]; median: 89.7%) (Table 27). Saw Advertisements for Tobacco Products on Internet Students were questioned regarding their exposure to advertisements for tobacco products on the Internet. For NYTS, students were asked: "When you are searching the Internet on a computer, how often do you see ads for cigarettes and other tobacco products?" and for YTS, students were asked: "When you are using the Internet, how often do you see ads for tobacco products?" Middle School. Nationally, 42.7% of students had seen advertisements for tobacco products on the Internet (Figure 12), with Hispanic students (44.9%)†† significantly more likely than black students (41.3%) to have seen such advertisements (Table 26). Among the 27 states that asked this question, the percentage of students who had seen such advertisements varied (range: 25.3% [Texas]--43.9% [New York]; median: 34.1%) (Table 27). High School. Nationally, 33.5% of students had seen advertisements for tobacco products on the Internet (Figure 12), with Hispanic (38.4%) and black (36.9%)†† students significantly more likely than white students (31.7%) to have seen such advertisements (Table 26). Among the 21 states that asked this question, the percentage of students who had seen such advertisements varied (range: 19.6% [Massachusetts]--37.9% [Maryland]; median: 28.4%) (Table 27). Participated in Antitobacco Community EventsMiddle School. Nationally, current tobacco users (17.9%) were significantly more likely than students who have never used tobacco (11.7%) to have participated in a community event to discourage persons from using tobacco products (Figure 13). Among students who have never used tobacco, female students (13.0%)†† were significantly more likely than male students (10.2%) and black students (15.6%) were significantly more likely than white (11.0%), Hispanic (10.1%) or Asian (9.0%)†† students to have participated in such events. Among current tobacco users, black students (23.9%)†† were significantly more likely than white students (16.4%) to have participated in such events (Table 28). Among the 29 states that asked this question, the percentage of students who had participated in an antitobacco community event varied among students who have never used tobacco (range: 11.6% [New York]--33.8% [Idaho]; median: 23.7%) and among current tobacco users (range: 14.6% [Florida, spring 2002]--27.8% [Maryland]; median: 21.2%) (Table 29). High School. Nationally, 11.5% of students who have never used tobacco and 9.5% of current tobacco users participated in a community event to discourage persons from using tobacco products in the past year (Figure 13). Among students who have never used tobacco, female students (13.8%) were significantly more likely than male students (8.6%) and black students (14.4%)†† were significantly more likely than Hispanic students (9.7%) to have participated in such an event. Among current tobacco users, black (15.9%) and Hispanic (12.8%)†† students were significantly more likely than white students (7.8%) to have participated in such an event (Table 28). Among the 24 states that asked this question, the percentage of students who had participated in an antitobacco community event varied among students who have never used tobacco (range: 8.7% [Florida, spring 2002]--25.9% [Mississippi]; median: 15.4%) and among current tobacco users (range: 6.5% [Kentucky]--17.6% [Maryland public schools]; median: 11.4%) (Table 29). Receptivity to Tobacco Company MerchandiseBought or Received Item with Tobacco Company Name or Picture on It Middle School. Nationally, current tobacco users (41.8%) were significantly more likely than students who have never used tobacco (8.7%) to have bought or received anything with a tobacco company name or picture on it (e.g., sports gear, T-shirt, cigarette lighter, hat, jacket, or sunglasses that they purchased or received for free) (Figure 14). Among students who have never used tobacco, Hispanic students (9.2%)†† were significantly more likely than Asian students (5.7%) to have bought or received any such items; no significant differences were identified among current tobacco user subgroups (Table 30). Among the 30 states that asked this question, the percentage of students who had bought or received anything with a tobacco company name or picture on it varied among students who have never used tobacco (range: 6.4% [New York]--16.1% [Iowa]; median: 11.2%) and among current tobacco users (range: 31.9% [Rhode Island]--52.7% [Maine]; median: 43.4%) (Table 31). High School. Nationally, current tobacco users (31.3%) were significantly more likely than students who have never used tobacco (7.7%) to have bought or received anything with a tobacco company name or picture on it (Figure 14), with male students (34.6%) significantly more likely than female students (26.7%) to have bought or received such items (Table 30). Among the 25 states that asked this question, the percentage of students who had bought or received anything with a tobacco company name or picture on it varied among students who have never used tobacco (range: 5.7% [Kansas]--24.4% [Mississippi]; median: 11.9%) and among current tobacco users (range: 29.8% [Florida, spring 2001, and Rhode Island]--63.3% [Mississippi]; median: 39.4%) (Table 31). Would Wear or Use an Item with Tobacco Company Name or Picture on It Middle School. Nationally, current tobacco users (58.1%) were significantly more likely than students who have never used tobacco (11.0%) to report that they would wear or use items (e.g., sports gear, T-shirts, cigarette lighters, hats, jackets, or sunglasses) that had a tobacco company name or picture on it (Figure 14). Among students who have never used tobacco, male students (15.7%) were significantly more likely than female students (6.9%) and Hispanic students (12.7%)†† significantly more likely than black students (9.2%) to report that they would wear or use such items. Among current tobacco users, Hispanic students (60.9%)†† were significantly more likely than black students (49.9%) to report that they would wear or use such items (Table 30). Among the 31 states that asked this question, the percentage of students who would wear or use anything with a tobacco company name or picture on it varied among students who have never used tobacco (range: 7.9% [Rhode Island]--20.9% [Mississippi]; median: 11.6%) and among current tobacco users (range: 44.2% [Connecticut]--67.9% [Mississippi]; median: 54.7%) (Table 31). High School. Nationally, current tobacco users (54.9%) were significantly more likely than students who have never used tobacco (13.7%) to report that they would wear or use an item with a tobacco company name or picture on it (Figure 14). Among students who have never used tobacco, male students (19.0%) were significantly more likely than female students (9.3%) and Hispanic students (17.4%) were significantly more likely than white (13.1%), black (12.9%)†† or Asian (12.0%)†† students to report that they would wear or use such items. Among current tobacco users, male students (57.8%) were significantly more likely than female students (50.9%);†† white students (57.9%) were significantly more likely than black (37.1%) or Hispanic (51.7%)†† students; and Hispanic students were significantly more likely than black students to report that they would wear or use such items (Table 30). Among the 25 states that asked this question, the percentage of students who would wear or use anything with a tobacco company name or picture on it varied among students who have never used tobacco (range: 10.9% [Delaware]--24.4% [Mississippi]; median: 16.9%) and among current tobacco users (range: 48.2% [Delaware]--67.9% [Iowa]; median: 58.0%) (Table 31). Cessation Attempts and Desire to StopTried to Quit Smoking Cigarettes During Preceding 12 Months Middle School. Nationally, 55.4% of current cigarette smokers had tried to quit smoking during the preceding 12 months (Figure 15). No significant differences were identified among subgroups of current cigarette smokers (Table 32). Among the 30 states that asked this question, the percentage of current cigarette smokers who had tried to quit smoking in the 12 months preceding the survey varied (range: 47.5% [Illinois]--69.7% [Iowa]; median: 56.3%) (Table 33). High School. Nationally, 53.1% of current cigarette smokers had tried to quit smoking during the preceding 12 months (Figure 15). No significant differences were identified among subgroups of current cigarette smokers (Table 32). Among the 24 states that asked this question, the percentage of current cigarette smokers who had tried to quit smoking during the preceding 12 months varied (range: 41.8% [Texas]--64.4% [Wisconsin]; median: 57.5%) (Table 33). Desire to Stop Smoking Cigarettes Middle School. Nationally, 49.6% of current cigarette smokers reported that they wanted to stop smoking (Figure 15). No significant differences were identified among current cigarette smoker subgroups (Table 32). Among the 30 states that asked this question, the percentage of current smokers who wanted to stop smoking varied (range: 40.9% [Oklahoma]--65.9% [Iowa]; median: 52.2%) (Table 33). High School. Nationally, 62.1% of current cigarette smokers reported that they wanted to stop smoking (Figure 15), with white (63.2%)†† and black (68.2%)†† students significantly more likely than Hispanic students (56.6%) to want to stop smoking cigarettes (Table 32). Among the 24 states that asked this question, the percentage of current cigarette smokers who wanted to stop smoking varied (range: 47.7% [Georgia]--67.8% [Massachusetts]; median: 58.6%) (Table 33). Secondhand Cigarette SmokeWas in Same Room with Someone Who Was Smoking Cigarettes on >1 of Preceding 7 Days Middle School. Nationally, current cigarette smokers (88.3%) were significantly more likely than students who have never smoked cigarettes (47.1%) to have been in the same room with someone who was smoking cigarettes on >1 of the preceding 7 days (Figure 16). Among students who have never smoked cigarettes, female students (49.4%) were significantly more likely than male students (44.8%) students; white students (51.6%) were significantly more likely than black (43.4%), Hispanic (35.1%), or Asian (27.6%) students; black students were significantly more likely than Hispanic or Asian students; and Hispanic students†† were significantly more likely than Asian students to have been in the same room with someone who was smoking cigarettes on >1 of the preceding 7 days. Among current cigarette smokers, female students (91.5%) were significantly more likely than male students (84.8%)†† and white students (91.0%) were significantly more likely than black (77.7%) or Hispanic (84.1%)†† students to have been in the same room with someone who was smoking cigarettes on >1 of the preceding 7 days (Table 34). Among the 30 states that asked this question, the percentage of students who had been in the same room with someone who was smoking cigarettes on >1 of the preceding 7 days varied among students who have never smoked cigarettes (range: 31.1% [Texas]--63.3% [Kentucky]; median: 45.3%) and among current smokers (range: 73.5% [Texas]--90.8% [Pennsylvania]; median; 86.1%) (Table 35). High School. Nationally, current cigarette smokers (91.4%) were significantly more likely than students who have never smoked cigarettes (53.3%) to have been in the same room with someone who was smoking cigarettes on >1 of the preceding 7 days (Figure 16). Among students who have never smoked cigarettes, white students (56.4%) were significantly more likely than black (50.7%),†† Hispanic (44.1%), or Asian (46.6%) students and black students†† were significantly more likely than Hispanic students to have been in the same room with someone who was smoking cigarettes on >1 of the preceding 7 days. Among current cigarette smokers, female students (93.4%) were significantly more likely than male students (89.7%) and white students (93.4%) were significantly more likely than black (84.2%) or Hispanic (86.7%) students to have been in the same room with someone who was smoking cigarettes on >1 of the preceding 7 days (Table 34). Among the 24 states that asked this question, the percentage of students who had been in the same room with someone who was smoking cigarettes on >1 of the preceding 7 days varied among students who have never smoked cigarettes (range: 40.4% [Texas]--73.6% [Kentucky]; median: 53.0%) and among current smokers (range: 81.6% [Maryland]--95.9% [Kentucky]; median: 90.5%) (Table 35). Rode in Car with Someone Who Was Smoking Cigarettes on >1 of Preceding 7 Days Middle School. Nationally, current cigarette smokers (81.7%) were significantly more likely than students who have never smoked cigarettes (31.5%) to have ridden in a car with someone who was smoking cigarettes on >1 of the preceding 7 days (Figure 16). Among students who have never smoked cigarettes, white (33.4%) and black (33.3%) students were significantly more likely than Hispanic (22.5%) or Asian (22.1%) students to have ridden in a car with someone who was smoking cigarettes on >1 of the preceding 7 days. Among current cigarette smokers, female students (85.8%) were significantly more likely than male students (77.3%) and white students (84.3%) were significantly more likely than black (71.3%) or Hispanic (76.2%)†† students to have ridden in a car with someone who was smoking cigarettes on >1 of the preceding 7 days (Table 34). Among the 30 states that asked this question, the percentage of students who had ridden in a car with someone who was smoking cigarettes on >1 of the preceding 7 days varied among students who have never smoked cigarettes (range: 21.3% [Idaho]--49.8% [Kentucky]; median: 32.6%) and among current smokers (range: 70.0% [Massachusetts]--91.6% [Iowa]; median: 79.9%) (Table 35). High School. Nationally, current smokers (83.7%) were significantly more likely than students who have never smoked cigarettes (29.1%) to have ridden in a car with someone who was smoking cigarettes on >1 of the preceding 7 days (Figure 16). Among students who have never smoked cigarettes, female students (31.0%) were significantly more likely than male students (26.8%)††; white (29.6%) students were significantly more likely than Hispanic (25.0%)††or Asian (19.0%) students; black (34.2%) students were significantly more likely than Hispanic and Asian students; and Hispanic students were significantly more likely than Asian†† students to have ridden in a car with someone who was smoking cigarettes on >1 of the preceding 7 days. Among current cigarette smokers, female students (86.1%)†† were significantly more likely than male students (81.7%) and white (86.0%) and Asian (91.6%) students were significantly more likely than black (72.6%) or Hispanic (78.2%) students to have ridden in a car with someone who was smoking cigarettes on >1 of the preceding 7 days (Table 34). Among the 24 states that asked this question, the percentage of students who had ridden in a car with someone who was smoking cigarettes on >1 of the past 7 days varied among students who have never smoked cigarettes (range: 23.7% [Texas]--44.9% [Kentucky]; median: 30.7%) and among current cigarette smokers (range: 72.6% [Texas]--89.9% [Delaware]; median: 83.6%) (Table 35). Think That Secondhand Cigarette Smoke is Harmful to Them Middle School. Nationally, students who have never smoked cigarettes (91.1%) were significantly more likely than current cigarette smokers (78.6%) to think that secondhand cigarette smoke is harmful to them (Figure 16), with female students (93.4%) significantly more likely than male students (88.8%) and white (93.6%) and Asian (94.1%) students significantly more likely than black (84.6%) or Hispanic (87.1%) students to think that secondhand cigarette smoke is harmful to them. Among current smokers, female students (82.9%) were significantly more likely than male students (74.0%)†† and Asian students (91.0%) were significantly more likely than white (80.8%),†† black (72.2%), or Hispanic (75.6%) students to think that secondhand cigarette smoke is harmful to them (Table 34). Among the 31 states that asked this question, the percentage of students who think that secondhand cigarette smoke is harmful to them varied among students who have never smoked cigarettes (range: 87.0% [Louisiana]--96.0% [Maine]; median: 93.0%) and among current cigarette smokers (range: 70.6% [Texas]--89.7% [Nebraska]; median: 82.3%) (Table 35). High School. Nationally, students who have never smoked cigarettes (95.1%) were significantly more likely than current cigarette smokers (90.2%) to think that secondhand cigarette smoke is harmful to them (Figure 16), with female students (96.7%) significantly more likely than male students (93.2%) and white (96.7%) and Asian (96.9%) students were significantly more likely than black (90.2%) or Hispanic (91.2%) students to think that secondhand cigarette smoke is harmful to them. Among current cigarette smokers, female students (93.3%) were significantly more likely than male students (87.5%) and white students (92.6%) were significantly more likely than black (81.2%) or Hispanic (84.5%) students to think that secondhand cigarette smoke is harmful to them (Table 34). Among the 25 states that asked this question, the percentage of students who think that secondhand cigarette smoke is harmful to them varied among students who have never smoked cigarettes (range: 89.1% [Florida]--97.4% [Nebraska]; median: 94.4%) and among current cigarette smokers (range: 80.9% [Maryland]--92.7% [Pennsylvania]; median: 88.8%) (Table 35). Tobacco Use by Others in the HomeSomeone Else in Home Smokes Cigarettes Middle School. Nationally, current cigarette smokers (71.5%) were significantly more likely than students who have never smoked cigarettes (33.3%) to live in a home in which someone else smokes cigarettes (Figure 17). Among students who have never smoked cigarettes, black students (35.2%) were significantly more likely than Hispanic (29.7%)†† or Asian (26.6%)†† students to live in such a home. Among current cigarette smokers, white students (73.6%)†† were significantly more likely than Hispanic students (64.2%) students to live in such a home (Table 36). Among the 30 states that asked this question, the percentage of students who live in a home in which someone else smokes cigarettes varied among students who have never smoked cigarettes (range: 24.2% [Idaho]--45.0% [Kentucky]; median: 34.9%) and among current cigarette smokers (range: 58.0% [Illinois]--81.0% [Wisconsin]; median: 70.1%) (Table 37). High School. Nationally, current cigarette smokers (57.5%) were significantly more likely than students who have never smoked cigarettes (29.9%) to live in a home in which someone else smokes cigarettes (Figure 17). Among students who have never smoked cigarettes, black students (35.3%) were significantly more likely than white (29.7%),†† Hispanic (27.8%), or Asian (24.2%) students to live in such a home. Among current cigarette smokers, female students (62.2%) were significantly more likely than male students (53.3%) and Asian students (70.9%)†† significantly more likely than Hispanic (52.8%) students to live in such a home (Table 36). Among the 24 states that asked this question, the percentage of students who live in a home in which someone else smokes cigarettes varied among students who have never smoked cigarettes (range: 24.7% [Illinois]--37.5% [Kentucky]; median: 29.6%) and among current cigarette smokers (range: 48.6% [Connecticut]--66.3% [West Virginia]; median: 56.9%) (Table 37). Someone Else in Home Uses Smokeless Tobacco Students who have never used smokeless tobacco and current smokeless tobacco users were asked if anyone who lives with them now uses chewing tobacco, snuff, or dip.** Middle School. Among the 28 states that asked this question, the percentage of students who reported living in a home in which someone else uses smokeless tobacco varied among students who have never used smokeless tobacco (range: 3.2% [Massachusetts]--23.6% [West Virginia]; median: 10.3%) and among current users of smokeless tobacco (range: 24.3% [Delaware]--59.8% [Alabama]; median: 46.7%) (Table 37). High School. Among the 22 states that asked this question, the percentage of students who reported living in a home in which someone else uses smokeless tobacco varied among students who have never used smokeless tobacco (range: 1.9% [Massachusetts]--20.7% [West Virginia]; median: 8.8%) and among current smokeless tobacco users (range: 22.7% [Ohio]--48.1% [Georgia]; median: 37.1%) (Table 37). SchoolsPracticed Tobacco Refusal Skills as Part of School Curriculum During School Year Middle School. Nationally, 38.8% of students practiced (e.g., through role playing) ways to say "no" to tobacco as part of the school curriculum in any of their classes during the school year (Figure 18), with female students (41.9%)†† significantly more likely than male students (35.8%) and black (45.3%) students significantly more likely than white students (36.8%) to have done so (Table 38). Among the 29 states that asked this question, the percentage of students who practiced ways to say "no" to tobacco as part of the school curriculum varied (range: 23.5% [New Hampshire]--64.7% [Maryland]; median: 45.2%) (Table 39). High School. Nationally, 16.4% of students practiced ways to say "no" to tobacco as part of the school curriculum (Figure 18), with female (17.8%)†† students significantly more likely than male (14.9%) students and black (22.5%), Hispanic (20.5%), and Asian (21.5%)†† students significantly more likely than white students (14.0%) to have done so (Table 38). Among the 23 states that asked this question, the percentage of students who practiced ways to say "no" to tobacco as part of the school curriculum varied (range: 9.4% [New Hampshire]--32.1% [Maryland]; median: 17.5%) (Table 39). Tobacco Use on School Property Smoked Cigarettes on School Property during Preceding 30 Days Middle School. Nationally, 2.7% of students had smoked cigarettes on school property during the 30 days preceding the survey (Figure 18). No significant differences were identified among subgroups. Nationally, 26.7% of current smokers had smoked cigarettes on school property during the 30 days preceding the survey, with black (32.8%),†† Hispanic (32.1%),†† and Asian (48.2%)†† students significantly more likely than white (21.8%) students to have done so (Table 38). Among the 31 states that asked this question, the percentage of students who had smoked cigarettes on school property during the preceding 30 days varied among all students (range: 1.6% [Connecticut]--5.7% [Louisiana]; median: 3.1%) and among current cigarette smokers (range: 15.8% [Georgia]--41.3% [New Hampshire]; median: 27.6%) (Table 39). High School. Nationally, 8.1% of students had smoked cigarettes on school property during the 30 days preceding the survey (Figure 18), with male students (9.4%)†† significantly more likely than female students (6.7%); white students (8.8%) significantly more likely than black (4.8%) or Asian (5.3%)†† students; and Hispanic students (7.9%) significantly more likely than black students to have done so. Nationally, 35.8% of current smokers had smoked cigarettes on school property during the 30 days preceding the survey, with male (39.4%) students significantly more likely than female (31.7%)†† students to have done so (Table 38). Among the 25 states that asked this question, the percentage of students who had smoked cigarettes on school property during the preceding 30 days varied among all students (range: 4.9% [Florida, Spring 2002]--16.4% [Kentucky]; median: 10.1%) and among current cigarette smokers (range: 26.7% [Kansas]--57.0% [Rhode Island]; median: 36.0%) (Table 39). Used Smokeless Tobacco on School Property during Preceding 30 Days Middle School. Nationally, 1.9% of students had used smokeless tobacco on school property in the 30 days preceding the survey (Figure 18), with male students (2.7%) significantly more likely than female students (1.0%) to have done so. Nationally, 52.0% of users of smokeless tobacco reported using smokeless tobacco on school property in the 30 days preceding the survey, with black (65.4%)†† and Hispanic (64.8%)†† students significantly more likely than white (45.3%) students to have done so (Table 38). Among the 27 states that asked this question, the percentage of students who had used smokeless tobacco on school property during the preceding 30 days varied among all students (range: 0.8% [Iowa]--7.0% [Louisiana]; median: 2.0%) and among current users of smokeless tobacco (range: 20.9% [Kansas]--71.8% [Michigan]; median: 49.5%) (Table 39). High School. Nationally, 3.5% of students had used smokeless tobacco on school property during the 30 days preceding the survey (Figure 18), with male students (6.5%) significantly more likely than female students (0.4%); white students (4.2%) significantly more likely than black (1.1%), Hispanic (2.5%),†† or Asian (1.0%) students; and Hispanic students significantly more likely than black†† or Asian†† students to have done so (Table 38). Nationally, 59.1% of smokeless tobacco users reported using smokeless tobacco on school property in the 30 days preceding the survey, with male students (62.0%) significantly more likely than female (34.4%) students and Hispanic students (74.5%)†† significantly more likely than white students (57.3%) to have done so. Among the 22 states that asked this question, the percentage of students who had used smokeless tobacco on school property during the preceding 30 days varied among all students (range: 2.8% [Connecticut]--8.1% [West Virginia]; median: 4.5%) and among current smokeless tobacco users (range: 40.7% [Ohio]--83.0% [Rhode Island]; median: 57.8%) (Table 39). DiscussionCDC recommends that states establish comprehensive tobacco-control programs to reduce disease, disability, and death related to tobacco use by
These goals can be addressed through comprehensive tobacco use prevention and control programs that include best practices components (e.g., statewide, school, counter marketing, community, cessation, and enforcement programs) (8). The Task Force on Community Preventive Services recently evaluated the evidence of effectiveness of 14 selected interventions across these program and goal areas. Recommended interventions (i.e., those that showed either sufficient or strong evidence of effectiveness) included 1) increasing the unit price for tobacco products, 2) mass media campaigns implemented with additional interventions (e.g., tobacco product excise tax increases, school-based education, or other community programs), 3) community mobilization combined with additional interventions around minor's access, 4) smoking bans and restrictions, 5) health-care systems--level interventions (e.g., provider reminders alone or in combination with provider education), 6) reducing patient costs for cessation treatments, and 7) multicomponent patient telephone support for cessation (15,16). NYTS and YTS data can be used to monitor comprehensive tobacco-control programs and evaluate exposure to select intervention components and inform program planning, improvement, and effectiveness. Evaluation should include periodic and ongoing monitoring of tobacco related attitudes, behaviors, health outcomes, the prevalence of protobacco influences (e.g., advertising, promotions, and events that glamorize tobacco use), and measures of anti-tobacco influences. Ultimately, these data will help determine the effect of program elements on tobacco-related attitudes, behaviors, and policies. The following discussion provides examples in how youth surveillance and evaluation data are used for this purpose. Prevalence and Initiation of Tobacco UseYoung persons are at the greatest risk for initiating tobacco use, becoming addicted to tobacco, and establishing use patterns that can become lifelong. However, if young persons remain tobacco-free, the majority will never start using tobacco (6). Major risk factors for initiation include perceptions that tobacco use is common and normative and the availability and accessibility of tobacco products (6). NYTS and YTS data provide measures that can be used to plan, monitor, and evaluate efforts to prevent initiation and reduce smoking prevalence among young persons. Use of YTS as a Primary Source of Data for Evaluating Prevention Initiatives In 1999, the Minnesota state legislature approved the Tobacco Prevention Endowment. The Minnesota Department of Health's Tobacco Prevention and Control Section (MN-TPCS) was charged with administering the Endowment, and in 2000 the Minnesota Youth Tobacco Prevention Initiative, Minnesota's only statewide coordinated youth tobacco prevention program, was established. In 1999, the state legislature set a goal of a 30% reduction in tobacco use among youth by 2005, and MN-TPCS was required to identify and establish measurable indicators and outcomes to assess progress toward this goal. MN-TPCS uses the Minnesota Youth Tobacco Survey (MN YTS) as the primary data source for evaluation of the Minnesota Youth Tobacco Prevention Initiative. By monitoring trends from MN YTS, MN-TPCS was able to demonstrate movement toward the program's goal in its 2002 annual report to the legislature (17). MN YTS data indicated that, during 2000--2002, the percentage of middle school students who currently use some form of tobacco decreased 11%, from 12.6% to 11.2%, and the percentage of middle school students who currently smoke cigarettes decreased 21%, from 9.1% to 7.2%. The evaluation results from the MN YTS indicate that the Minnesota Youth Tobacco Prevention Initiative was on track to reach the 2005 goal. MN-TPCS estimates that achieving the goal would ultimately prevent approximately 1,700 premature deaths and save $480 million in heath-care costs every year in Minnesota. During the 2003 legislative session, the Minnesota state legislature approved an 80% reduction in MN-TPCS funding. MN YTS data will now be used to provide MN-TPCS with information on how this shift in programming affects these trends. Quitting Tobacco Use among Young PersonsYoung smokers become addicted to cigarettes and experience withdrawal symptoms similar to those reported by adults (6). Although evidence is limited regarding effective cessation programs among young persons, promising interventions and methods have emerged (18,19). To further this progress, state and national program providers and policy makers should continue to conduct scientifically sound youth cessation studies to produce quality data and address research gaps; develop and implement carefully considered youth cessation strategies; rigorously evaluate interventions using standardized methods; and uniformly report all results in the published literature (19,20). NYTS and YTS data provide measures for planning, monitoring, and evaluating efforts to promote quitting tobacco use among young persons. Use of YTS for Programmatic Decisions and Recommendations New Jersey uses YTS data to guide programmatic decisions and recommendations. Since its inception in January 2000, the Comprehensive Tobacco Control Program in the New Jersey Department of Health and Senior Services (NJ-CTCP) has carried out a full range of statewide and local initiatives to reduce tobacco use. One of five NJ-CTCP program goals is increasing the number of youth tobacco users who initiate cessation treatment (21). Program progress is evaluated by monitoring indicators related to short and long term outcomes of the program, especially those related to tobacco use knowledge, attitudes, and behaviors. NJ-CTCP uses the New Jersey Youth Tobacco Survey (NJ YTS) as the primary evaluation system for youth tobacco use in the state to measure these and other types of youth indicators (22). NJ-CTCP used NJ YTS data to demonstrate that youth cigarette smokers are interested in quitting. Nicotine dependence was demonstrated among current smokers, and a strong inverse association was identified between current smokers' level of confidence that they could successfully quit and how many cigarettes they smoked per day; these factors present challenges to cessation efforts. When 1999 and 2001 NJ YTS data were compared, no significant differences in interest in quitting, indicators of nicotine dependence, or quit attempts were identified. However, several important changes were noted with respect to physician tobacco counseling, a critical precursor to cessation treatment. During 1999--2001, the percentage of high school smokers who reported that they were asked about their smoking status while visiting their doctor increased 30%. NJ-CTCP continues to focus on developing options for improving overall youth smoking cessation. The program focus on making age-appropriate tobacco dependence treatment programs readily available and accessible to increase youth cessation in the state. To address this need, NJ-CTCP has implemented a youth cessation curriculum in several New Jersey high schools and established a new initiative to train pediatricians to identify and treat tobacco dependence. Exposure to Secondhand SmokeExposure to secondhand smoke has direct health consequences for youth such as causing lower respiratory illness and exacerbating asthma (6). In addition, exposure to smoking by others contributes to perceptions that tobacco use is normative (6). Interventions to reduce secondhand smoke exposure provide immediate protection for young persons in schools, public places, homes, and cars. NYTS and YTS data provide measures important to planning, monitoring, and evaluating efforts to reduce exposure to secondhand smoke among young persons. Use of YTS as an Evaluation System In New Hampshire, YTS is used as an evaluation system to inform program planning, assessment, and effectiveness. The New Hampshire Department of Health and Human Service's Tobacco Prevention and Control Program (NH-TPCP) has adopted all four of the National Tobacco Control Program's (NTCP) goal areas and is based on CDC/OSH's Best Practices for Comprehensive Tobacco Control Programs (8). NH-TPCP's comprehensive program relies on the ongoing collection and detailed analysis of surveillance and evaluation data to determine program efficacy. NH-TPCP uses YTS data to measure overall program progress toward decreasing exposure to secondhand smoke among young persons aged 11--17 years and to guide program efforts in this area. NH-TPCP logic models and action plans connects the activity of providing community education on topics of secondhand smoke and promoting smoke-free homes and vehicles to outputs such as the recipients of the secondhand smoke education being exposed to pro-health/anti-tobacco messages. Outputs are further linked to Specific-Measurable-Achievable-Relevant and Time bound (SMART) outcome objectives such as decreasing the percentage of youth who report exposure to secondhand smoke and increasing the percentage of youth who report that they think that secondhand smoke is harmful. NH-TPCP uses NH YTS as the primary data source for measuring these objectives, with specific YTS questions directly providing the needed indicators. Disparities in Tobacco UseTobacco-related measures often vary across different population groups (23). Analysis and review of data by different demographic characteristics (e.g., sex, race/ethnicity, or education level) can assist in targeting culturally appropriate programs that address varying levels of tobacco-related problems. YTS and NYTS data provide measures important to planning, monitoring, and evaluating efforts to reduce disparities in tobacco use among young persons. Use of YTS to Identify Disparities in Tobacco Use In Kansas, YTS is used as an integral component to identifying and eliminating disparities in tobacco use. The Kansas Department of Health and Environment's Tobacco Use Prevention Program (KS-TUPP) has recognized the need for local tobacco control activities, programs, and monitoring to achieve lasting progress toward Kansas' and the Nation's goals and objectives. KS-TUPP's primary role is to provide resources and technical assistance to community coalitions for the development, enhancement, and evaluation of state and local tobacco-control initiatives. From this local-level focus, they have built a broad network of local, regional, and state coalitions. In keeping with their community focus, and goal of eliminating tobacco-related disparities among specific populations, KS-TUPP has issued a request for proposals for addressing tobacco use among minority youth for the last 3 years. Using 2000 YTS data, KS-TUPP identified sub-state areas in which Hispanic youth showed substantially higher rates of current tobacco use and current cigarette smoking than Hispanic youth at the state level. In 2002, three Hispanic organizations were funded to address this disparity by implementing policy, media, and community mobilization prevention strategies to generate awareness and change in tobacco use knowledge, attitudes, and behavior among Hispanic youth aged 12--17 years. One of the funded organizations, Our Gang Inc., has created a Youth Advisory Board that makes tobacco control advocacy presentations and engages peers in youth empowerment. Board members reinforce their counter marketing messages by distributing pro-health/anti-tobacco cards and wearing pro-health/anti-tobacco T-shirts on assigned days. Over time, the YTS will provide measures to monitor the impact of these activities and identify other priority groups for KS-TUPP targeted strategies. LimitationsThe findings in this report are subject to at least four limitations. First, these data apply only to youth who attend middle school or high school and are not representative of all persons in this age group. In 2000, the most recent year for which data are available, only 4% of persons aged 16 years and 8% of those aged 17 years who had not completed high school were not enrolled in a high school program (24). Second, although NYTS and the majority of state surveys were conducted during the spring semester, a limited number of states conducted surveys during the fall semester. Conducting the survey at different times throughout the school year introduces variation which might influence survey estimates. These differences include cohort aging (i.e., the school population is older in the spring) and other potential contextual differences (e.g., level of tobacco-control program activity, tobacco-related policy, or price changes). Future analysis of data from fall and spring surveys will assess these effects. Third, all data are self reported. Because tobacco use by youth is considered a socially undesirable behavior, young persons might not give an honest report of their behaviors and attitudes (6). This might possibly lead to under- or overreporting by respondents, though the direction and extent of this cannot be determined. However, those YTS questions that have been analyzed have demonstrated reliability (25), and youth self-reports have been determined to be generally accurate (26). Finally, in certain instances, question or response categories slightly differ either between different state YTS surveys or between NYTS and the core state YTS survey. For example, the definition of a current user of any tobacco product (Table 5) in certain states does not include use of cigars, pipes, or bidis because these core questions were removed from the states' survey. Also, the measure of how current smokers usually acquired cigarettes (Tables 20 and 21) differs for certain response categories, with wording varying slightly between NYTS and YTS. These differences limit comparability across the surveys on measures derived from those questions. ConclusionStates can use NYTS and YTS data to plan, monitor, and evaluate aspects of their comprehensive tobacco-control programs that focus on youth. States can use these data as tobacco program indicators to 1) monitor trends, a step that could lead to better program planning and program improvement; and 2) compare their state data with those of other states and the nation to evaluate change. The following conclusions can be drawn from NYTS and YTS data:
Three waves of NYTS have been completed: 1999, 2000, and 2002. Between the time of its inception in 1998 and completion of the 2002 surveys, 42 states and the District of Colombia have implemented YTS and obtained weighted data at least once. Nearly half of these states have weighted YTS data from >2 years. Mississippi and Texas now have 4 years of data, and Florida has 5 years of data. Alabama, Arkansas, Delaware, Iowa, Kansas, Kentucky, Maine, Maryland, Minnesota, New Jersey, New York, North Carolina, Ohio, Oklahoma, Tennessee, West Virginia, and Wisconsin all have 2 years of data. Continued support for the NYTS and YTS will help inform tobacco-control program planning, improvement, and effectiveness. References
* Bidis (or beedies) are small brown cigarettes from India consisting of tobacco wrapped in a leaf and tied with a thread. † Kreteks (also called clove cigarettes) are flavored cigarettes containing tobacco and clove extract. § Estimates are not reported if <35 cases are in the denominator. ¶ Asked on NYTS only. ** Asked on state YTS only. †† CIs overlap, but t-test is statistically significant. §§ Only restaurants were included in this category. Table 1 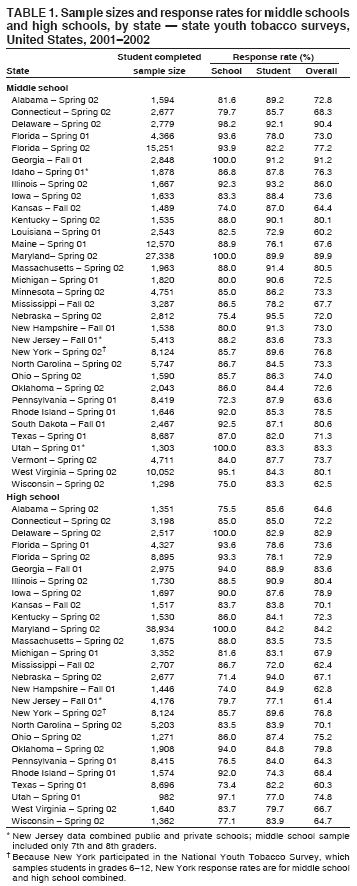 Return to top. Figure 1 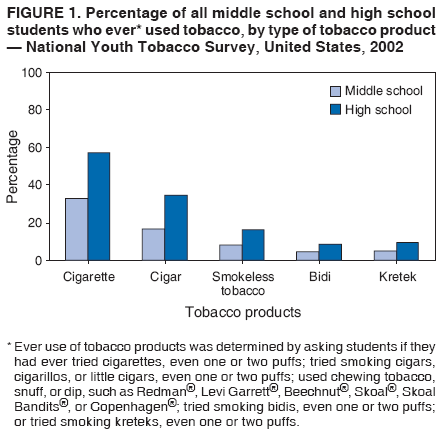 Return to top. Table 2 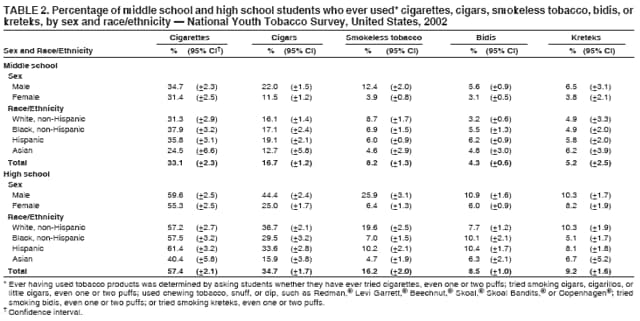 Return to top. Figure 2 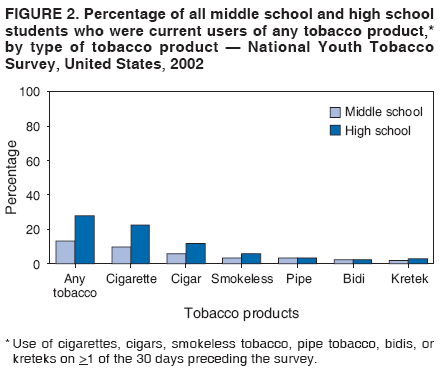 Return to top. Table 3 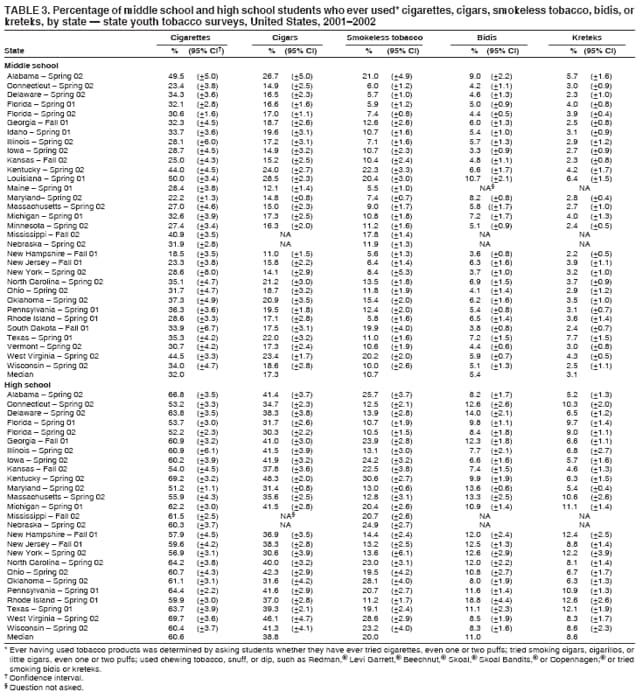 Return to top. Figure 3 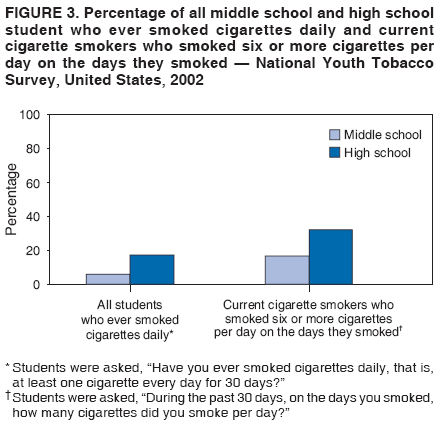 Return to top. Table 4 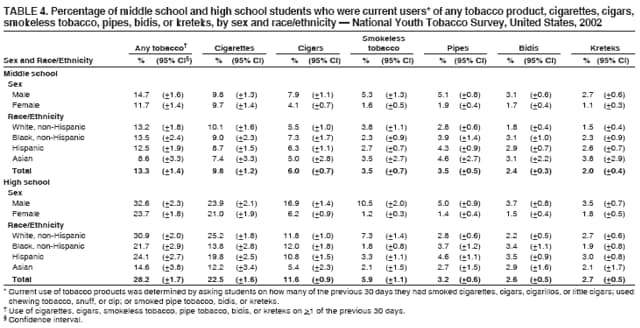 Return to top. Figure 4 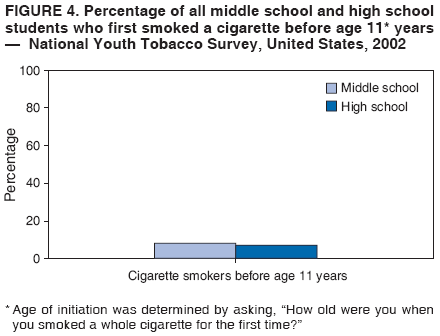 Return to top. Table 5 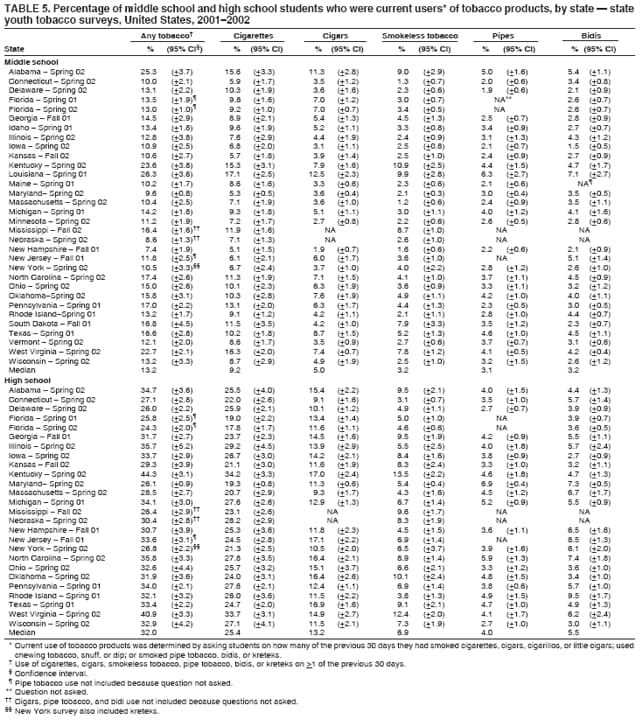 Return to top. Figure 5 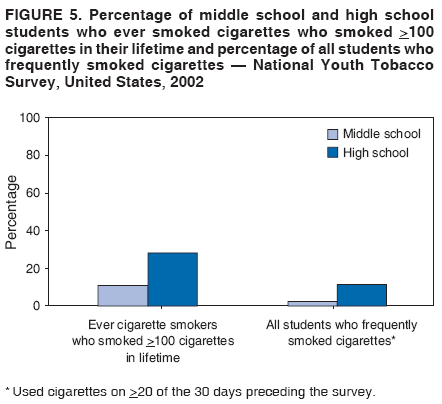 Return to top. Table 6 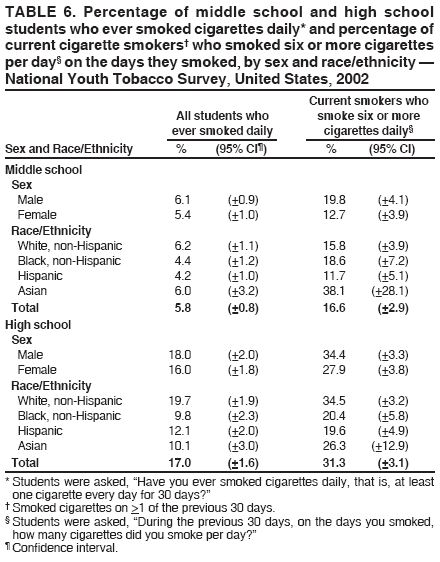 Return to top. Figure 6 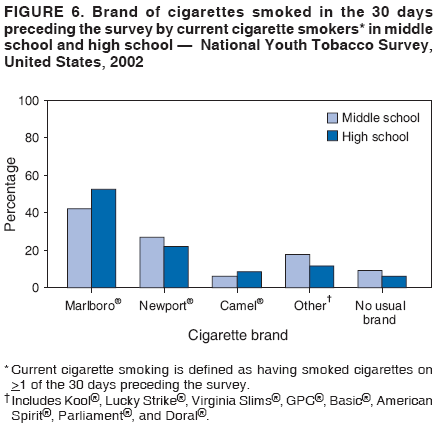 Return to top. Table 7 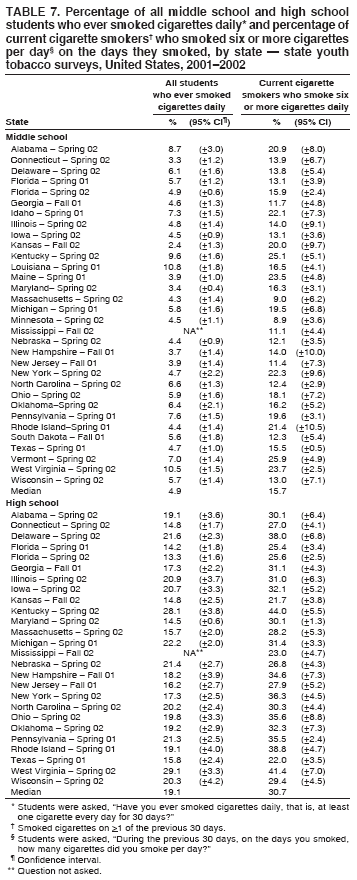 Return to top. Figure 7 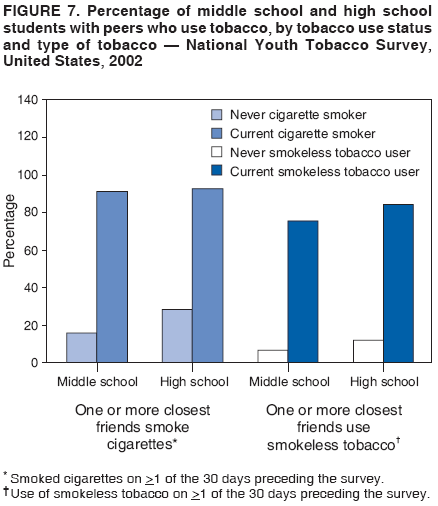 Return to top. Table 8 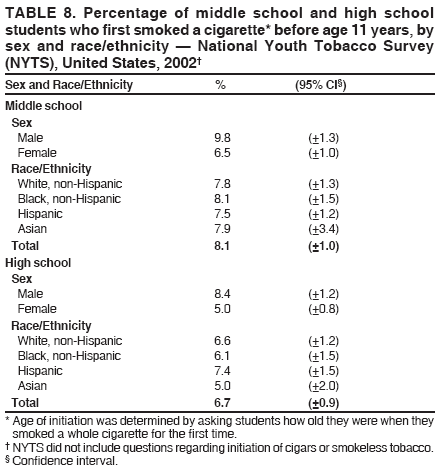 Return to top. Figure 8 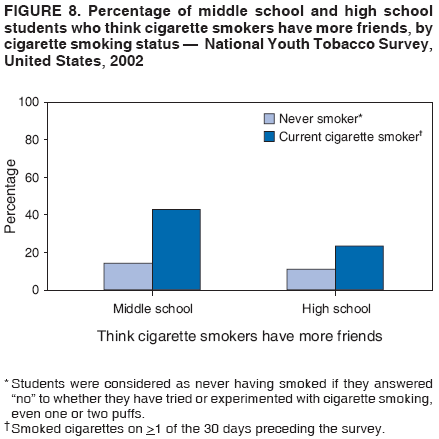 Return to top. Table 9 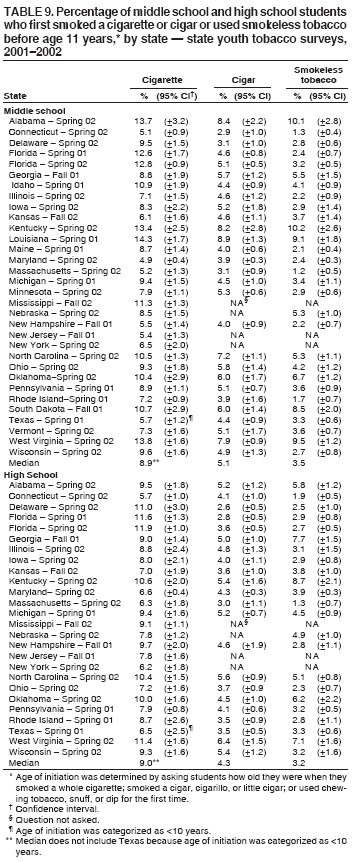 Return to top. Figure 9 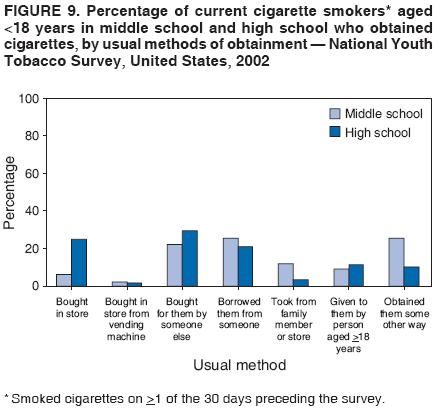 Return to top. Table 10 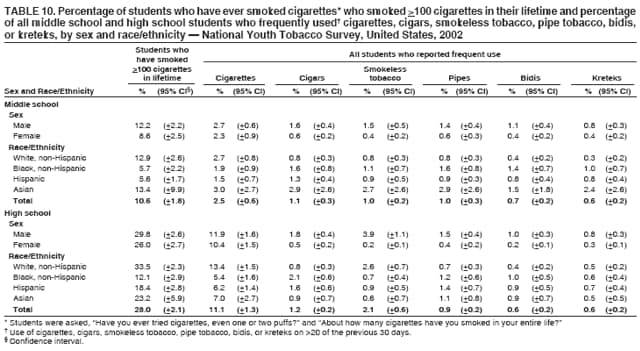 Return to top. Figure 10 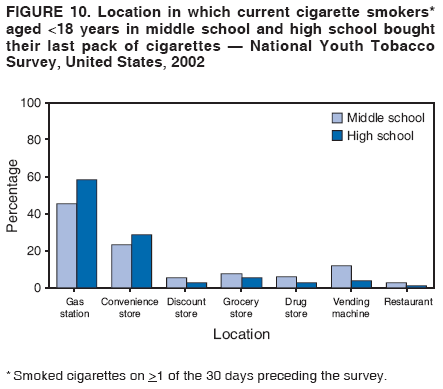 Return to top. Table 11 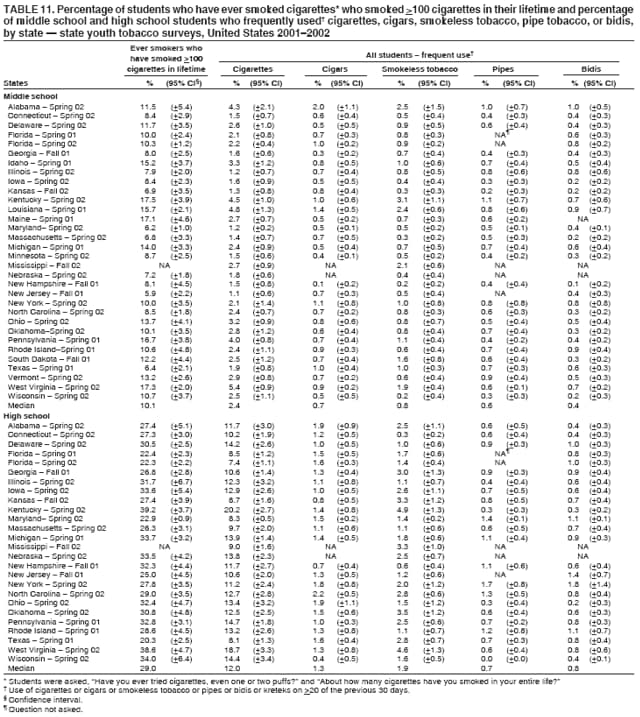 Return to top. Figure 11 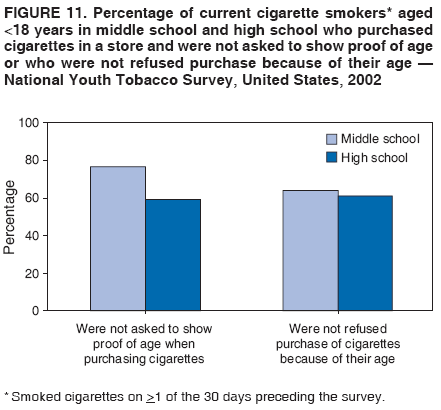 Return to top. Table 12 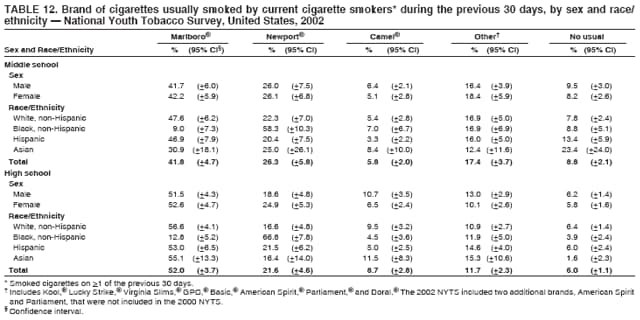 Return to top. Figure 12 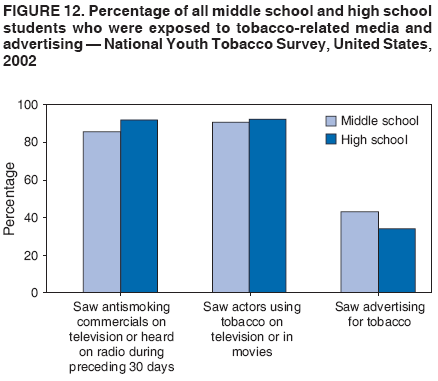 Return to top. Table 13 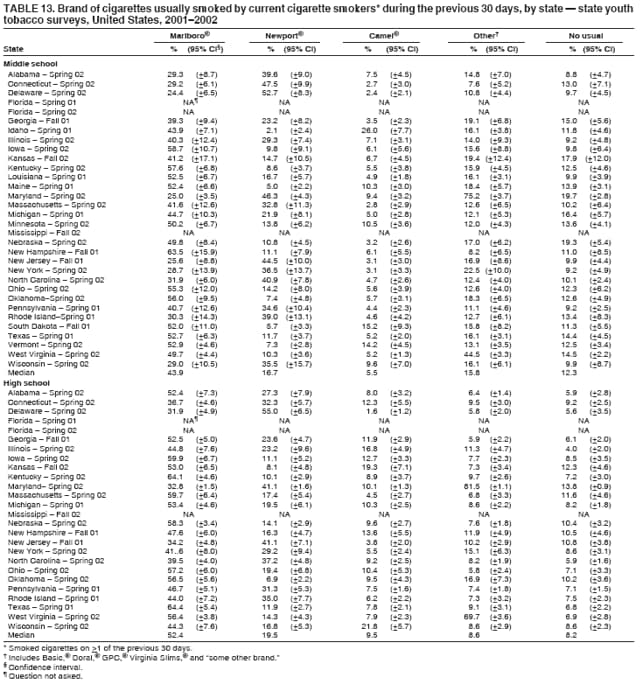 Return to top. Figure 13 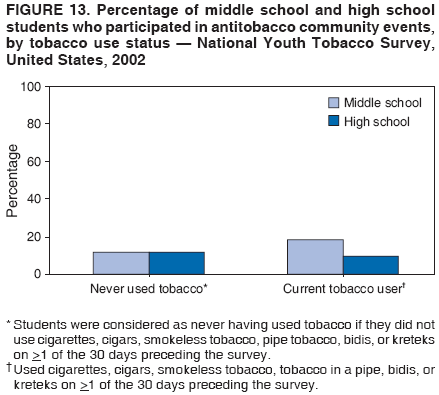 Return to top. Table 14 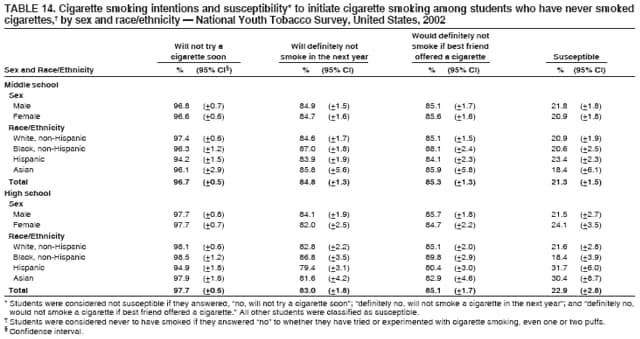 Return to top. Figure 14 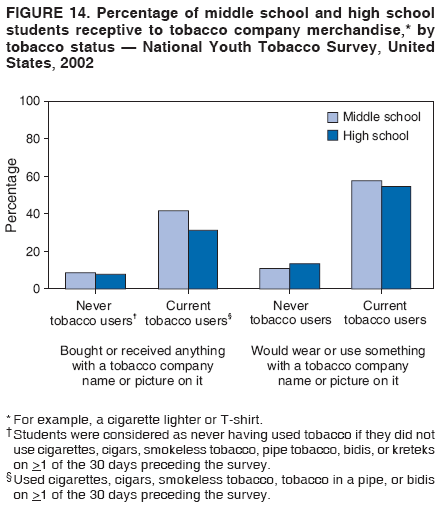 Return to top. Table 15 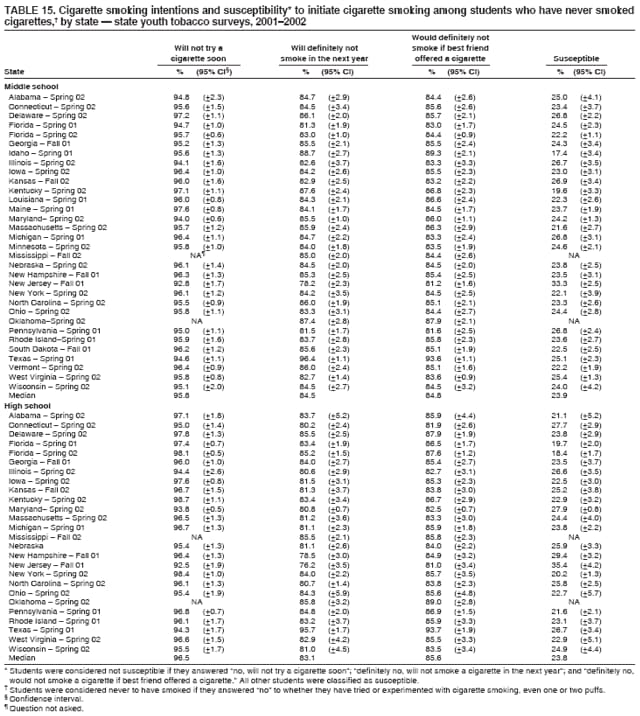 Return to top. Figure 15 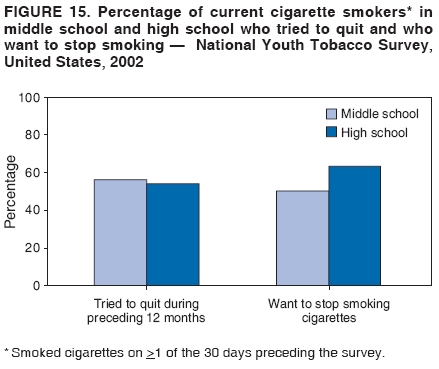 Return to top. Table 16 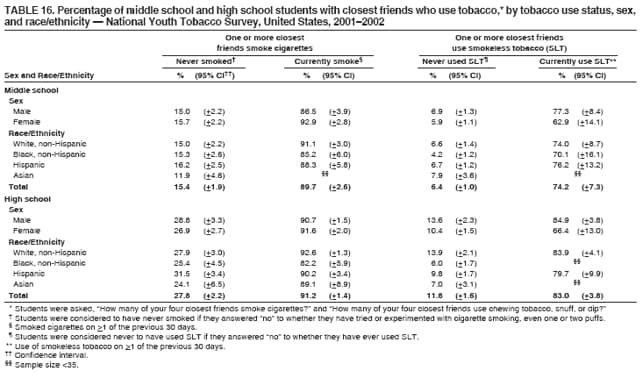 Return to top. Figure 16  Return to top. Table 17 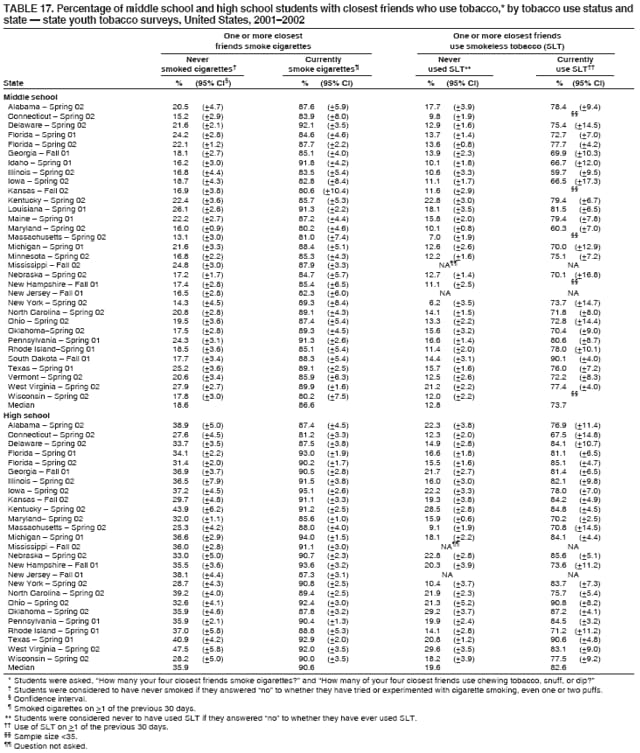 Return to top. Figure 17 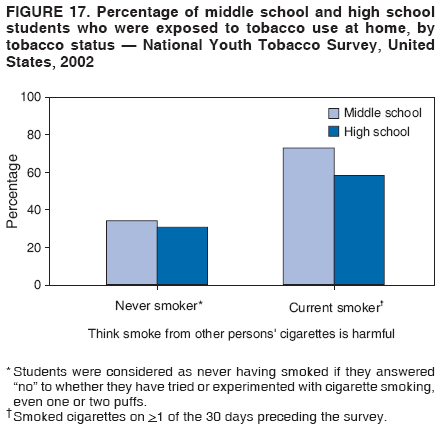 Return to top. Table 18 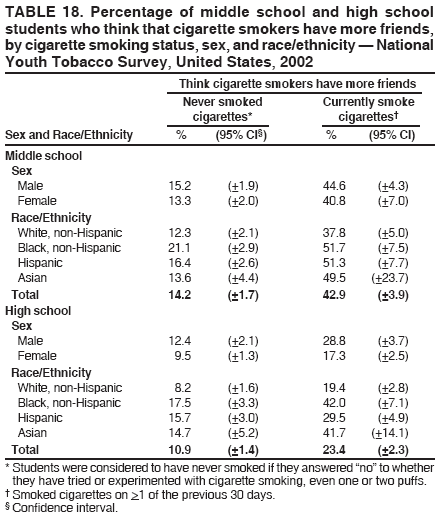 Return to top. Figure 18 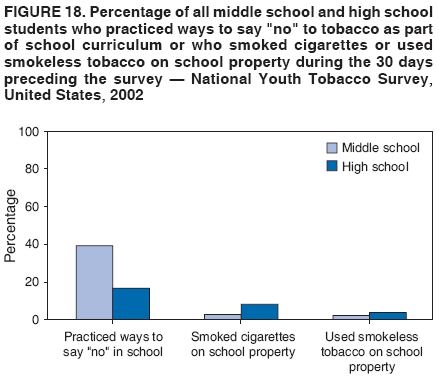 Return to top. Table 19 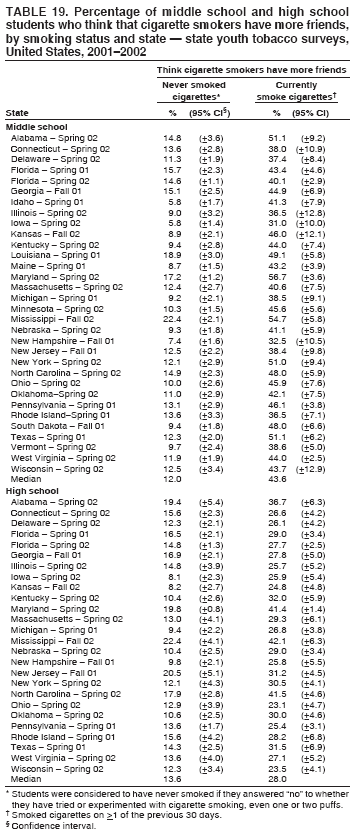 Return to top. Table 20 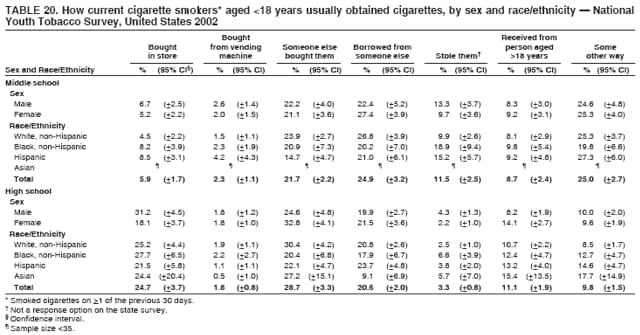 Return to top. Table 21 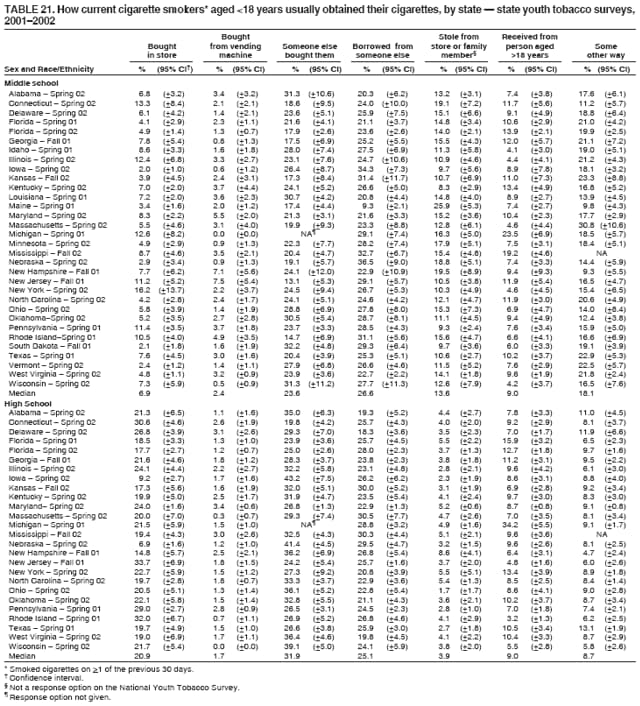 Return to top. Table 22 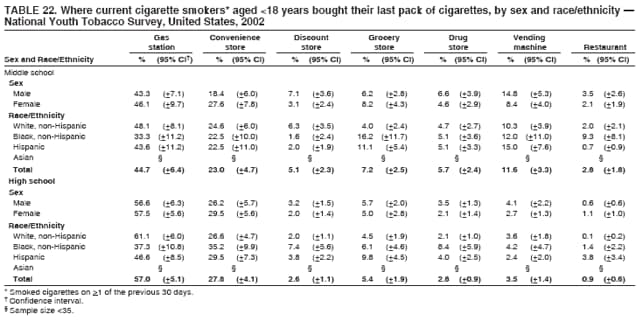 Return to top. Table 23 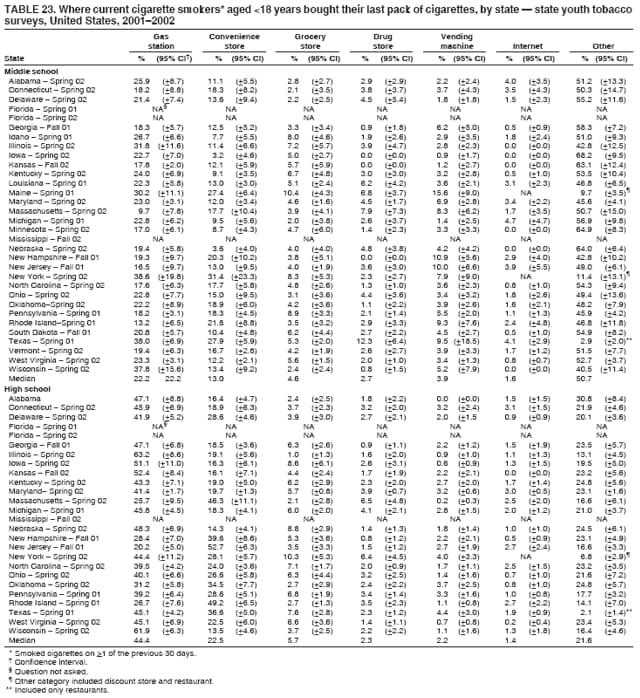 Return to top. Table 24 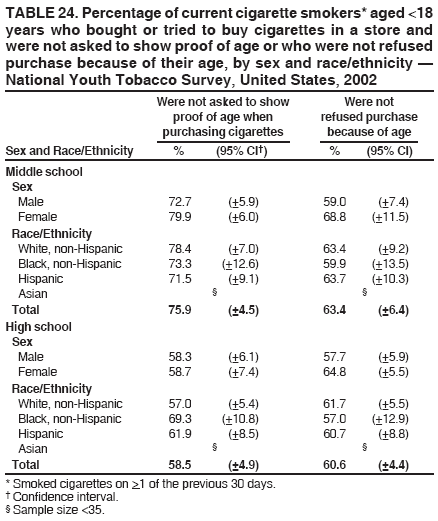 Return to top. Table 25 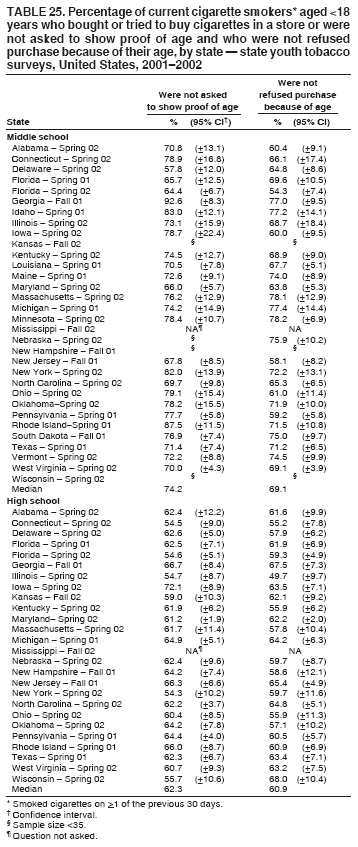 Return to top. Table 26 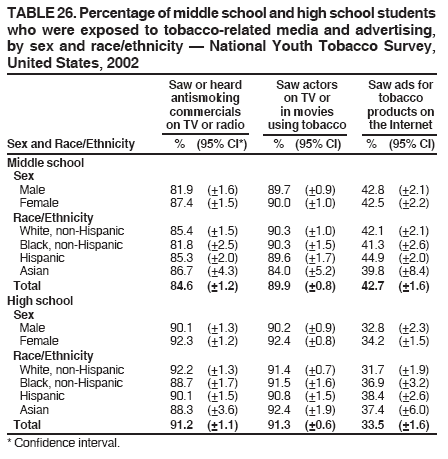 Return to top. Table 27 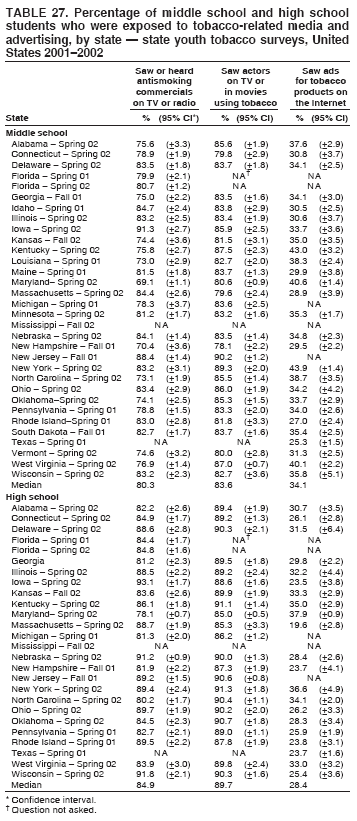 Return to top. Table 28 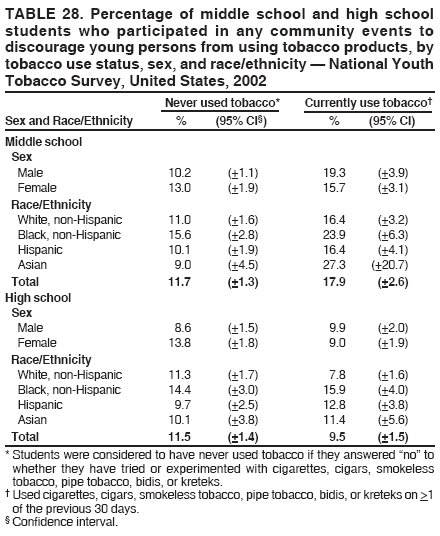 Return to top. Table 29 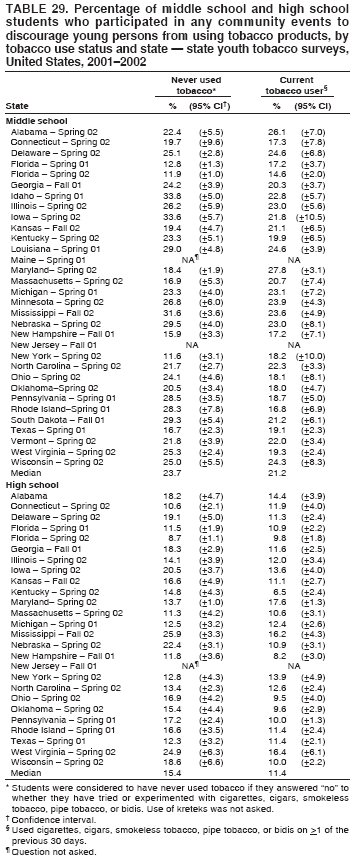 Return to top. Table 30 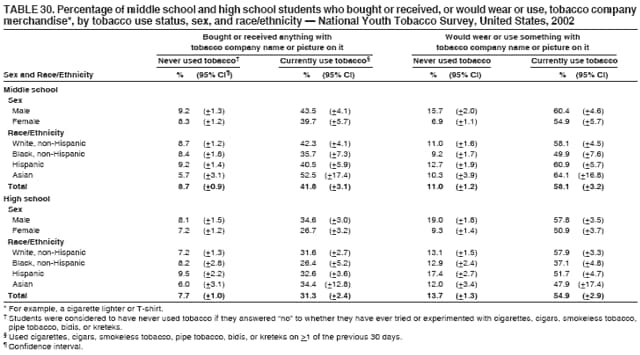 Return to top. Table 31 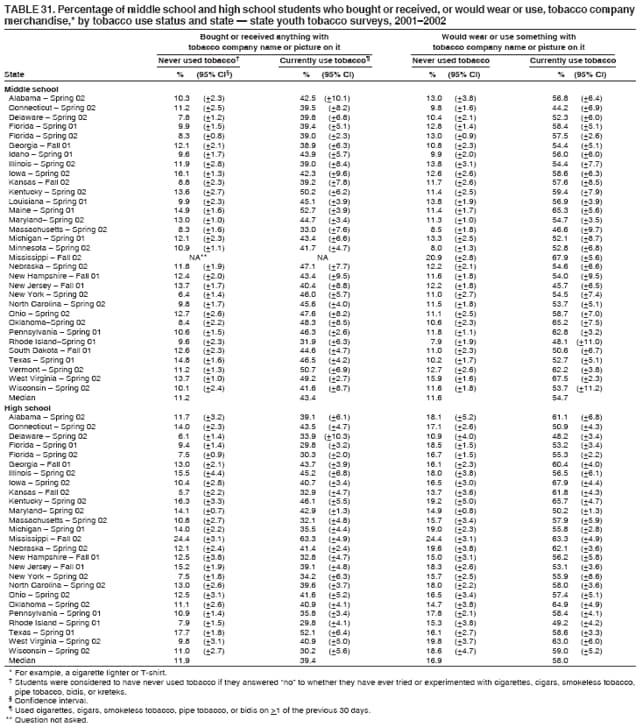 Return to top. Table 32  Return to top. Table 33 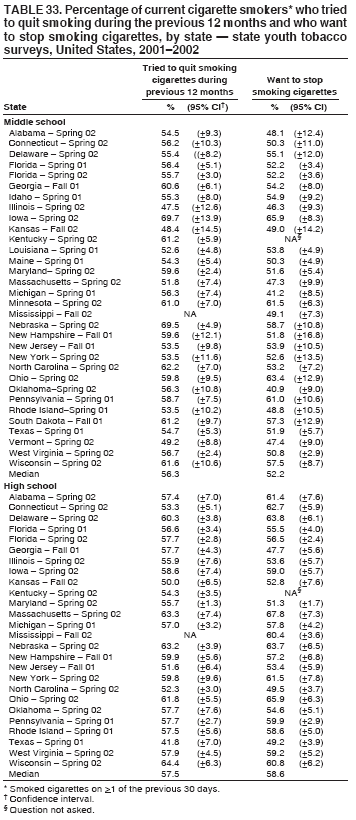 Return to top. Table 34 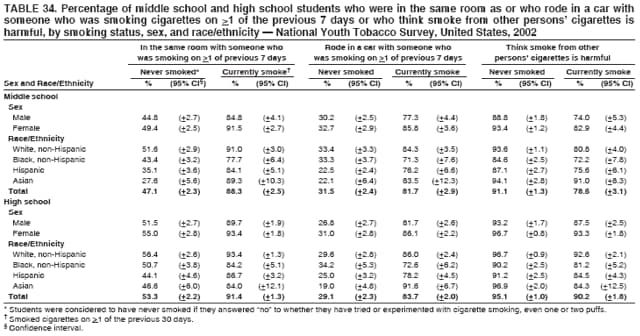 Return to top. Table 35 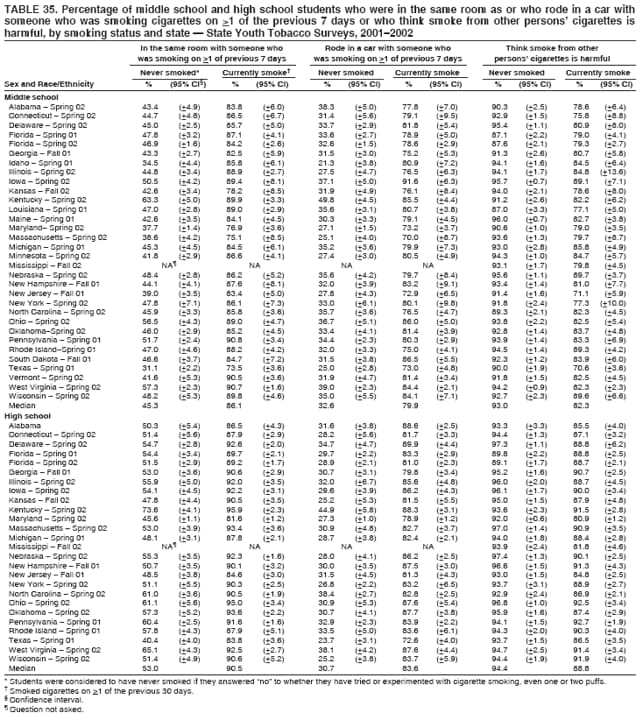 Return to top. Table 36 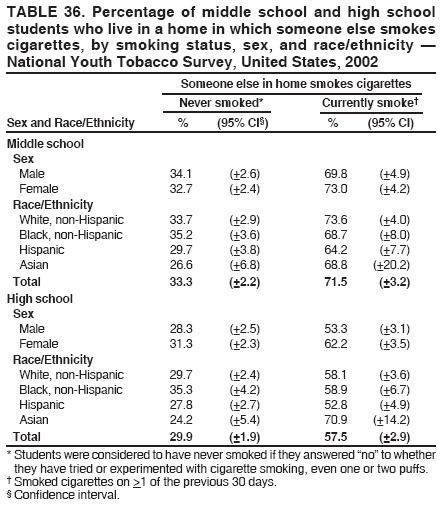 Return to top. Table 37 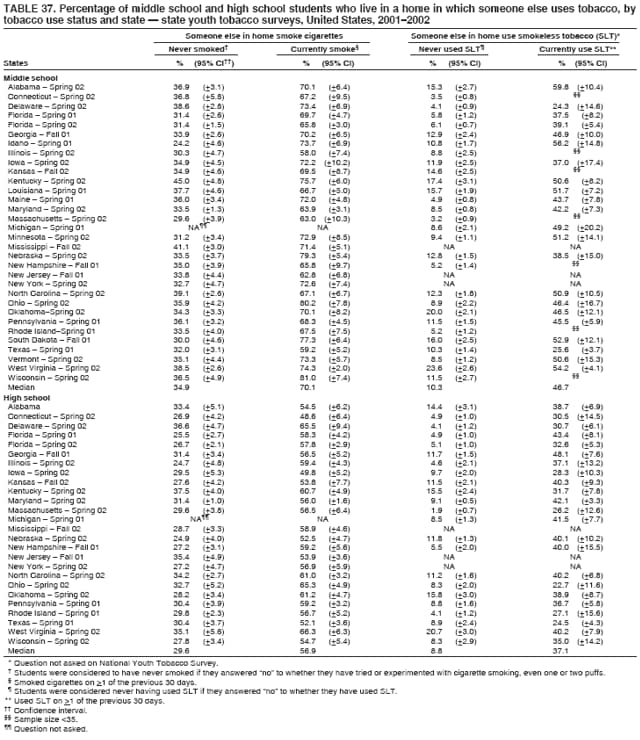 Return to top. Table 38 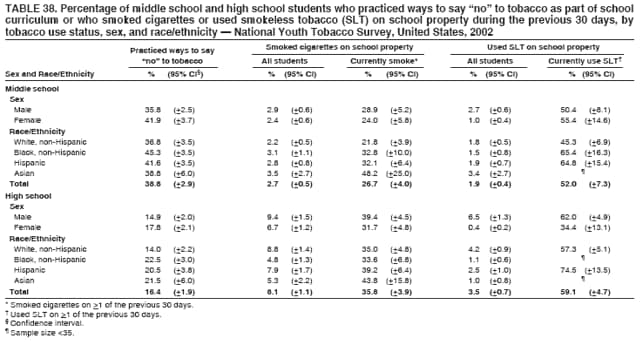 Return to top. Table 39 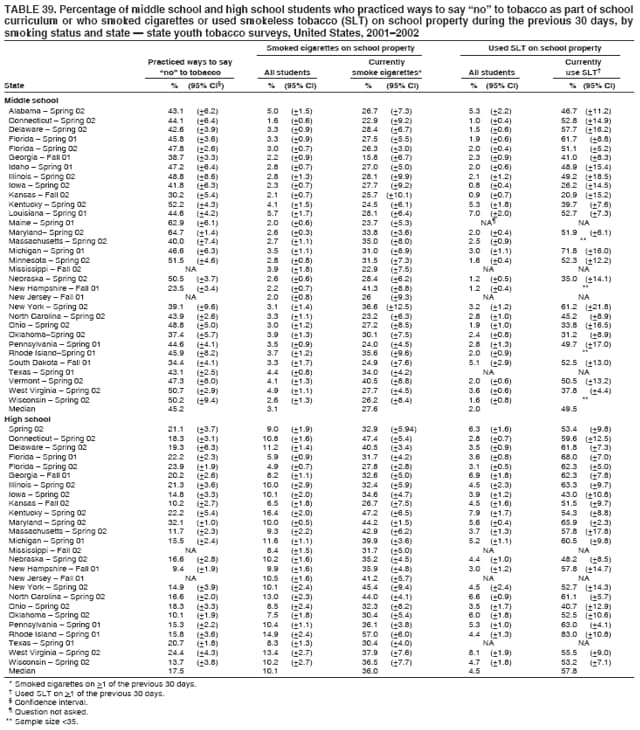 Return to top.
Disclaimer All MMWR HTML versions of articles are electronic conversions from ASCII text into HTML. This conversion may have resulted in character translation or format errors in the HTML version. Users should not rely on this HTML document, but are referred to the electronic PDF version and/or the original MMWR paper copy for the official text, figures, and tables. An original paper copy of this issue can be obtained from the Superintendent of Documents, U.S. Government Printing Office (GPO), Washington, DC 20402-9371; telephone: (202) 512-1800. Contact GPO for current prices. **Questions or messages regarding errors in formatting should be addressed to mmwrq@cdc.gov.Date last reviewed: 4/27/2006 |
|||||||||
|