 |
|
|
|
|
|
|
| ||||||||||
|
|
|
|
|
|
|
||||
| ||||||||||
|
|
|
|
|
Persons using assistive technology might not be able to fully access information in this file. For assistance, please send e-mail to: mmwrq@cdc.gov. Type 508 Accommodation and the title of the report in the subject line of e-mail. Surveillance for Certain Health Behaviors Among States and Selected Local Areas --- Behavioral Risk Factor Surveillance System, United States, 2003Ruth Jiles, PhD, Elizabeth Hughes, DrPH, Wilmon Murphy, Nicole Flowers, MD, Melissa McCracken, MPH, Henry Roberts, PhD,
Margaret Ochner, MPH, Lina Balluz, ScD, Ali Mokdad, PhD, Laurie Elam-Evans, PhD, Wayne Giles, MD
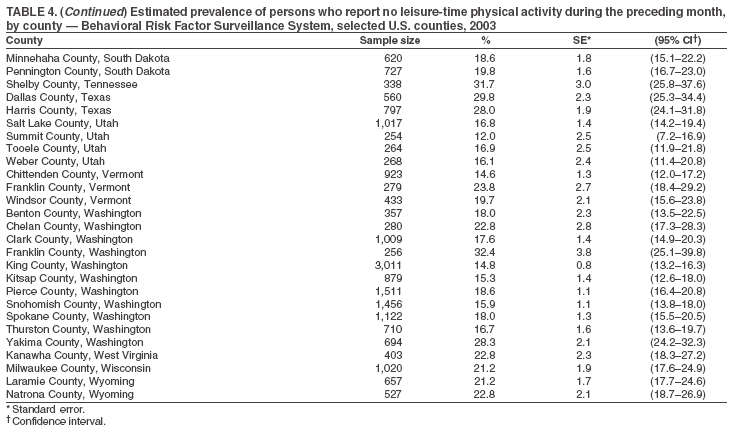
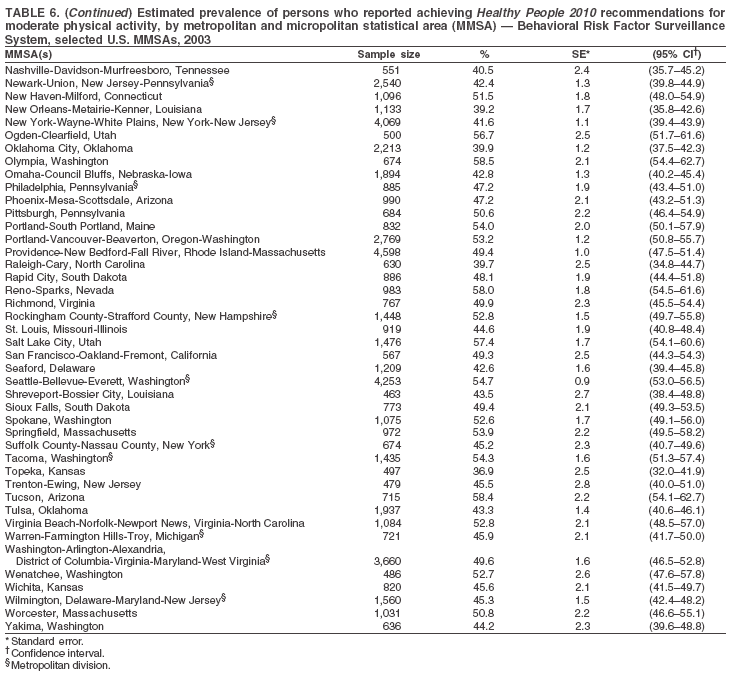
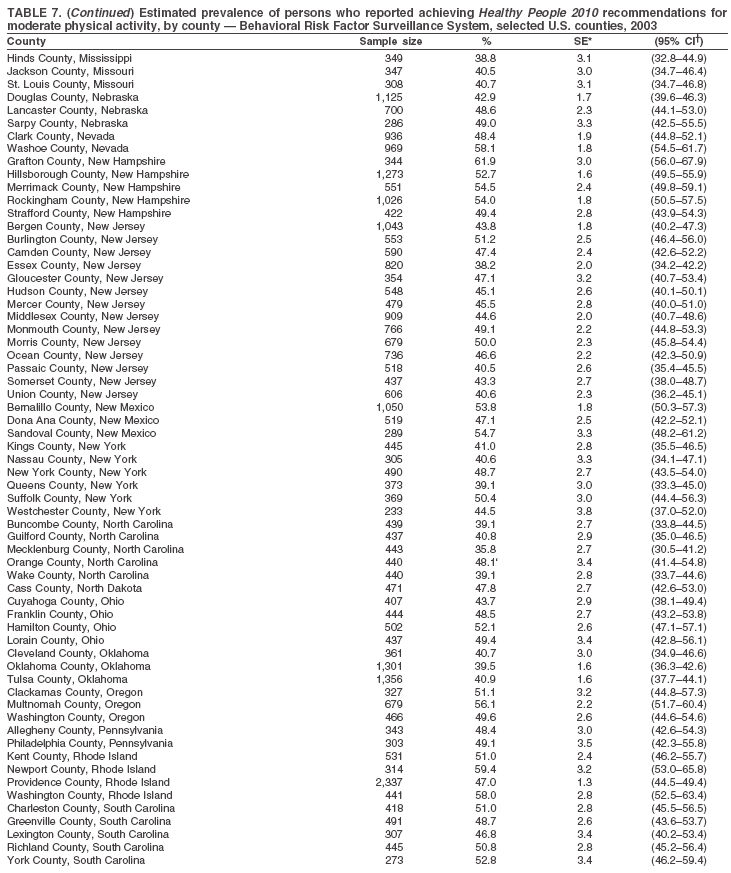
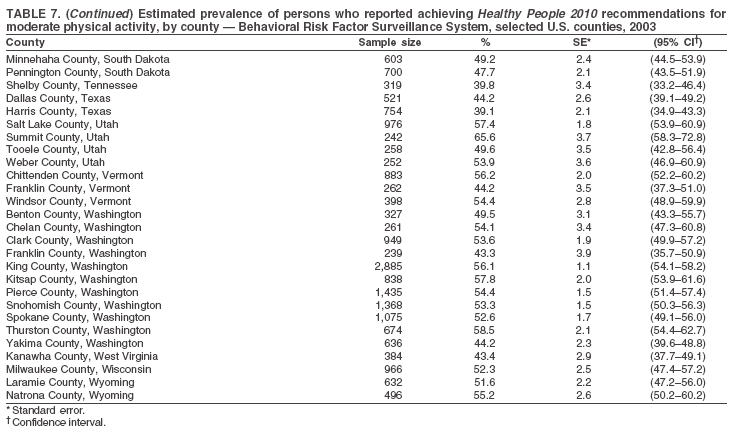
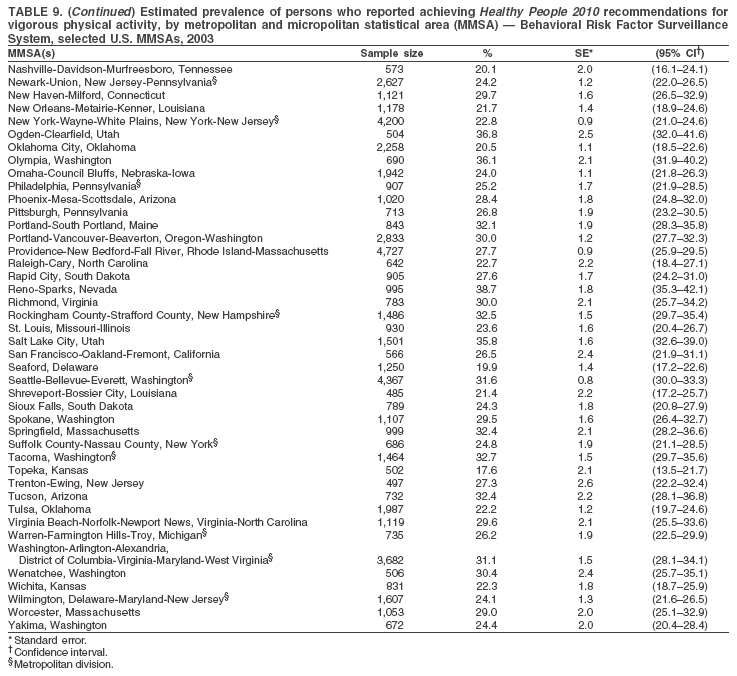
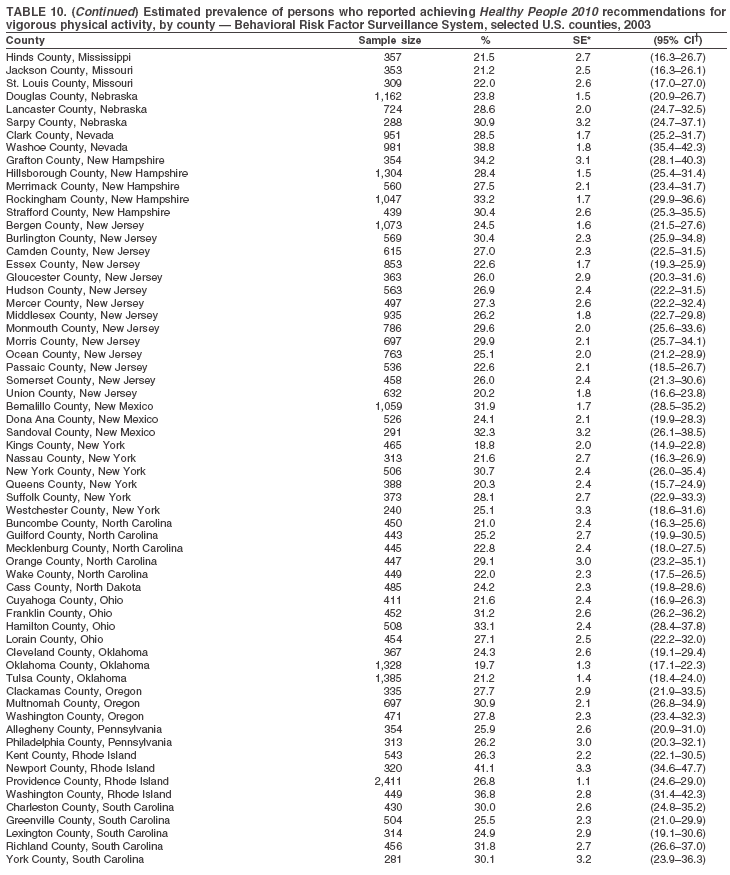
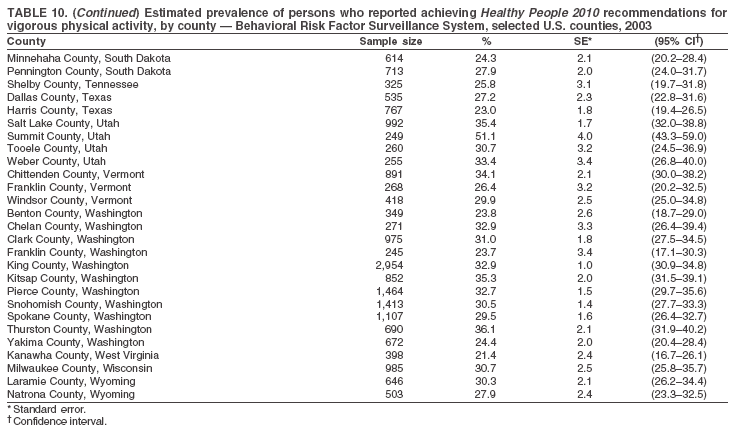
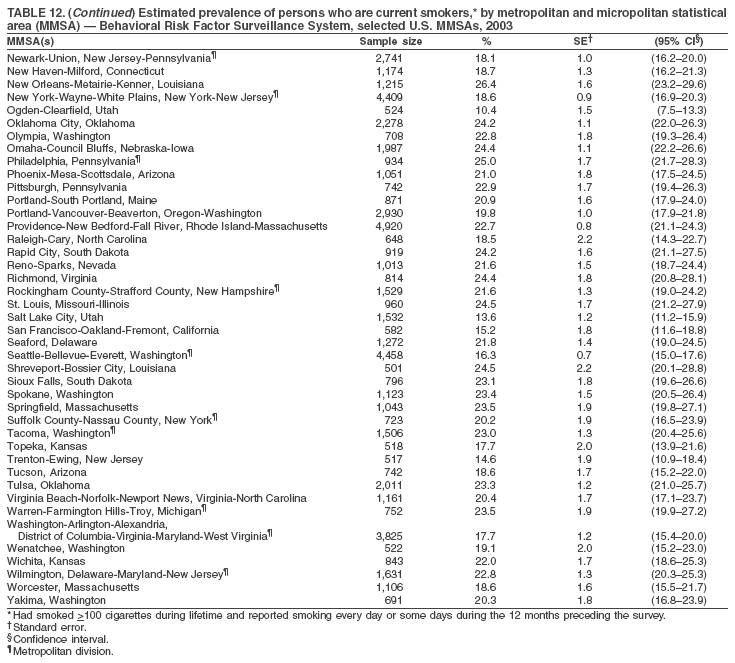
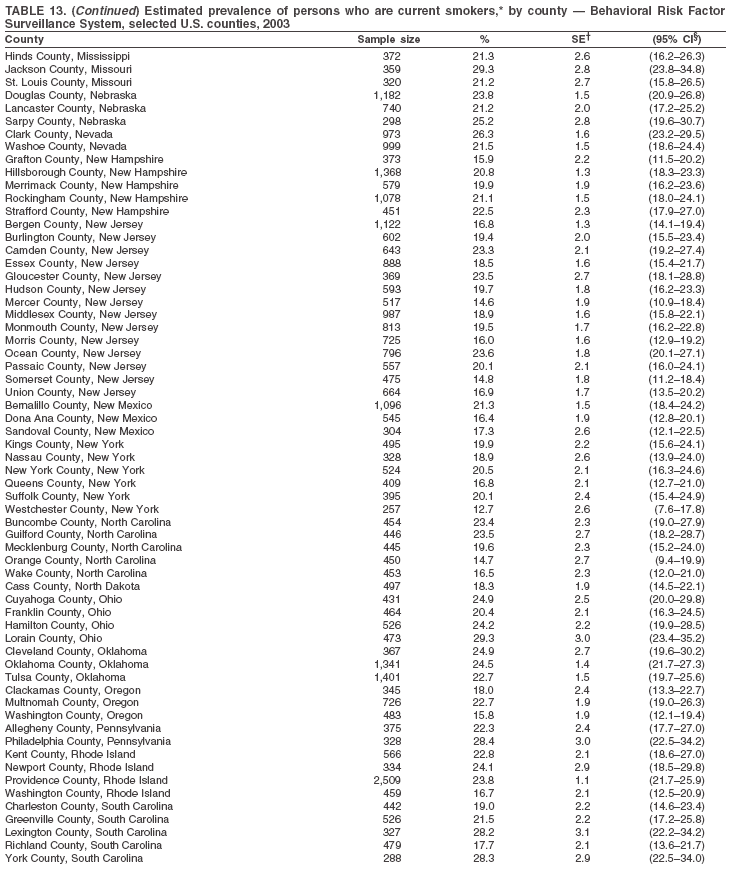
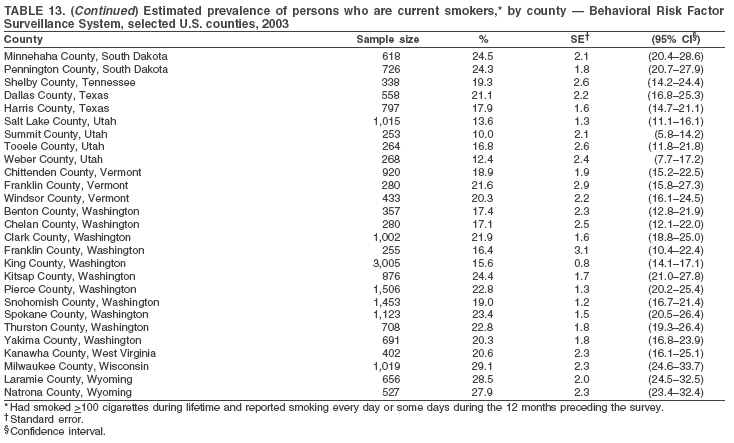
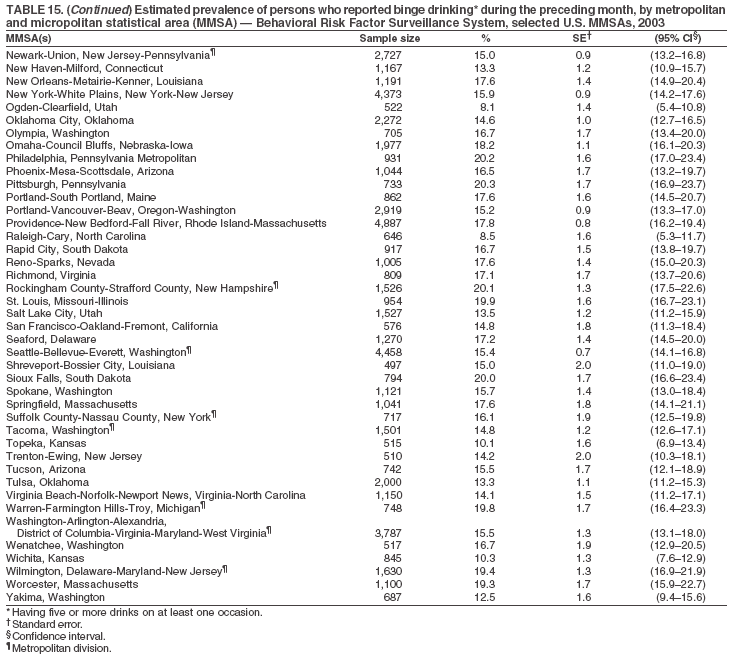
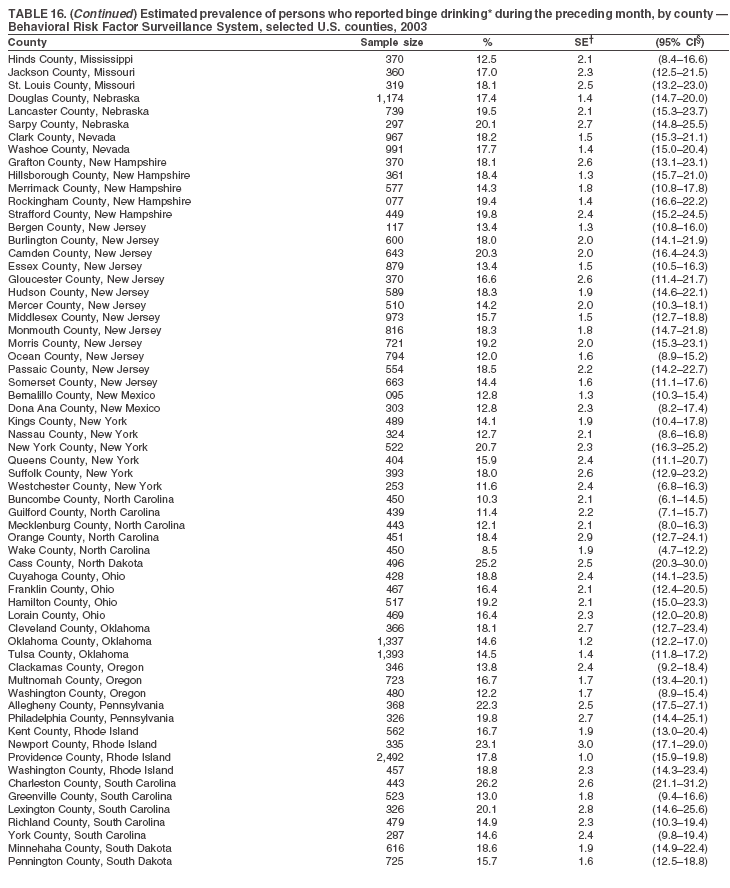
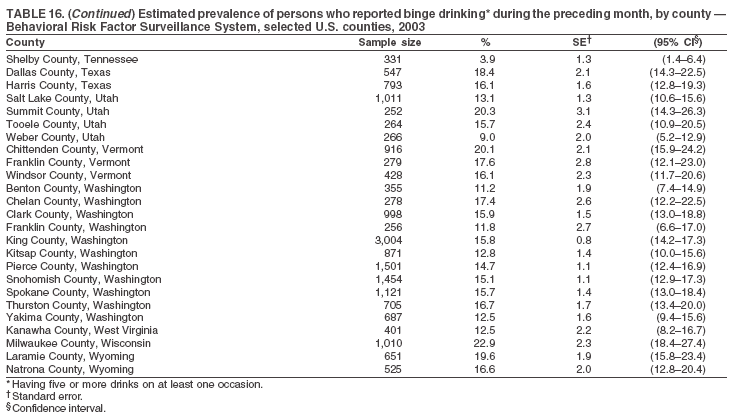
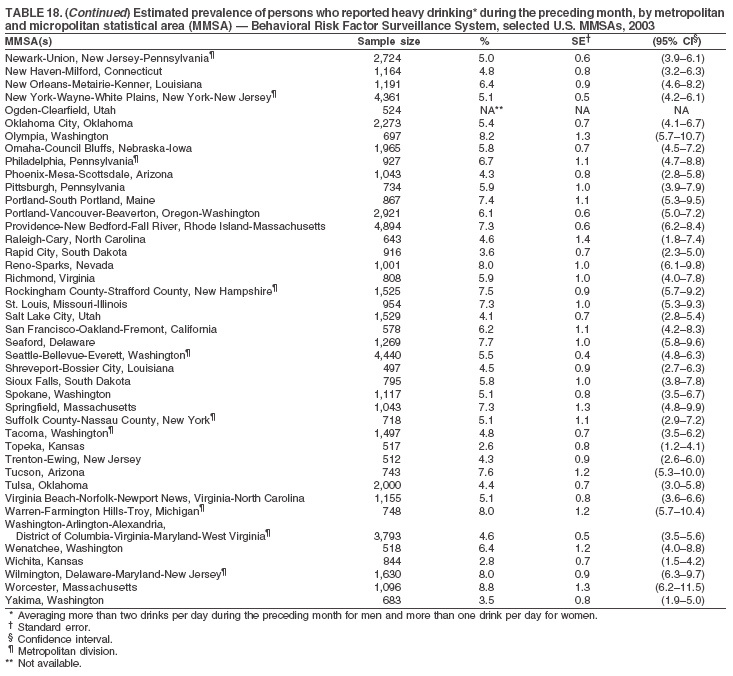
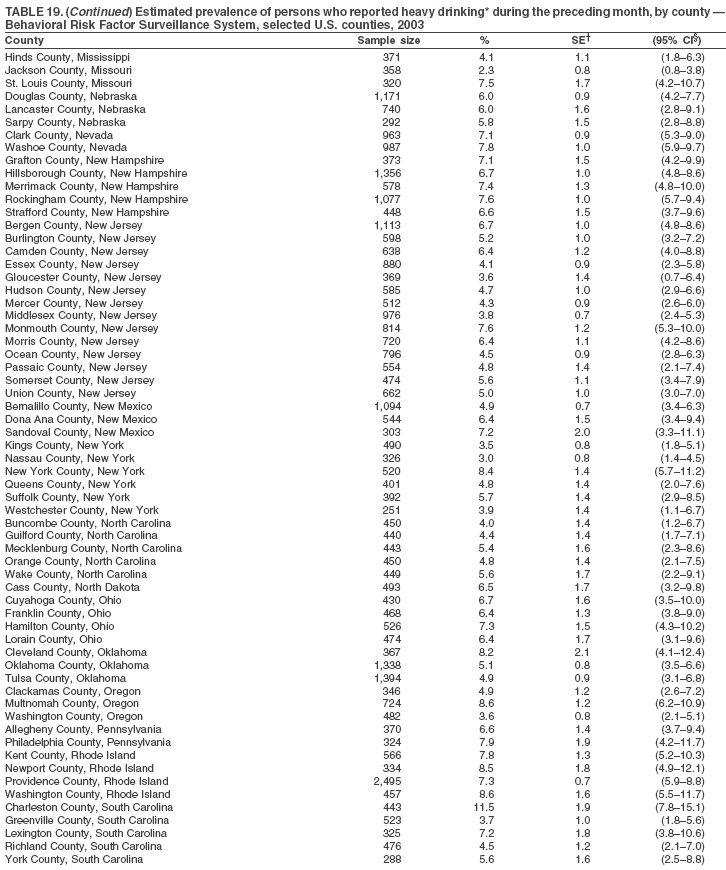
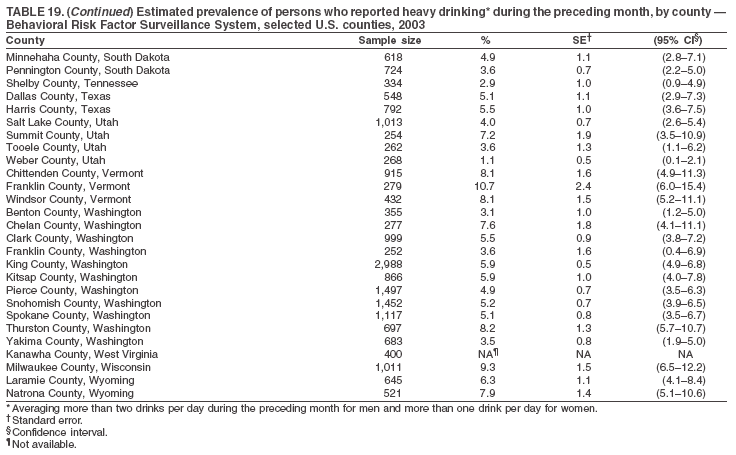
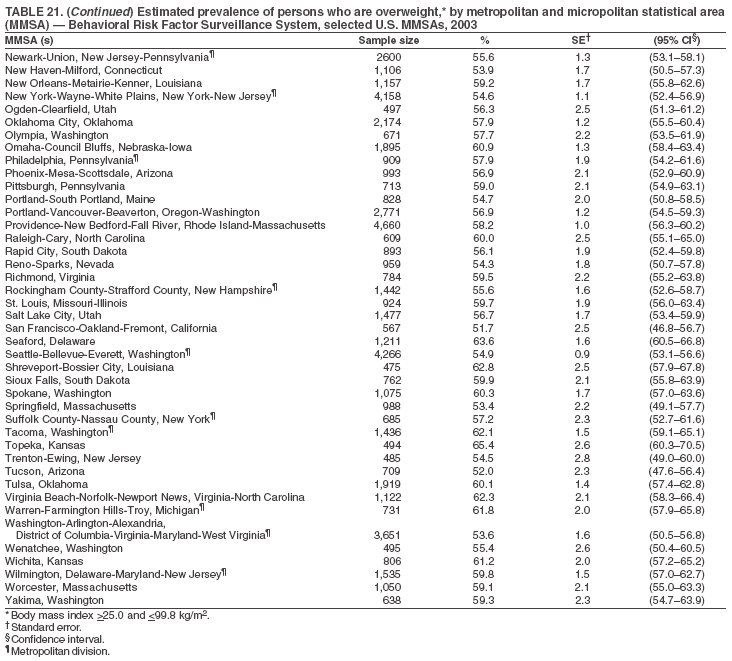
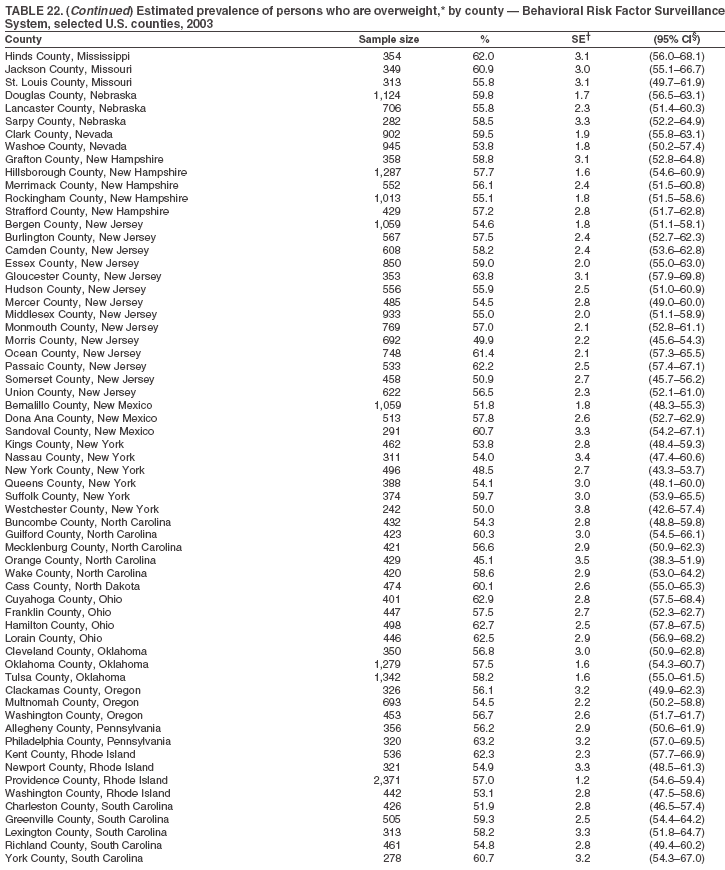
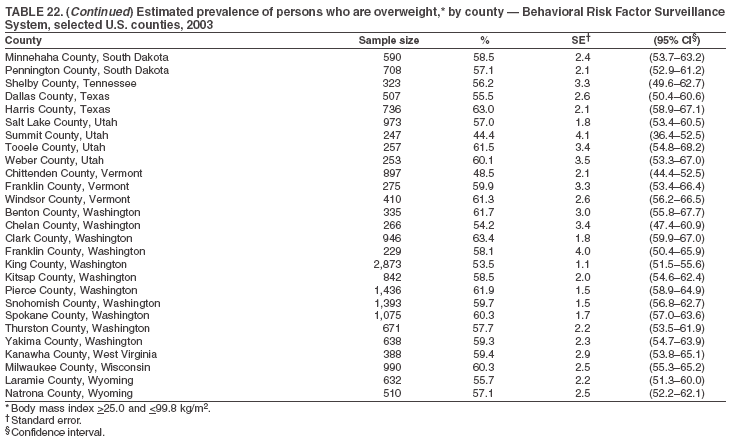
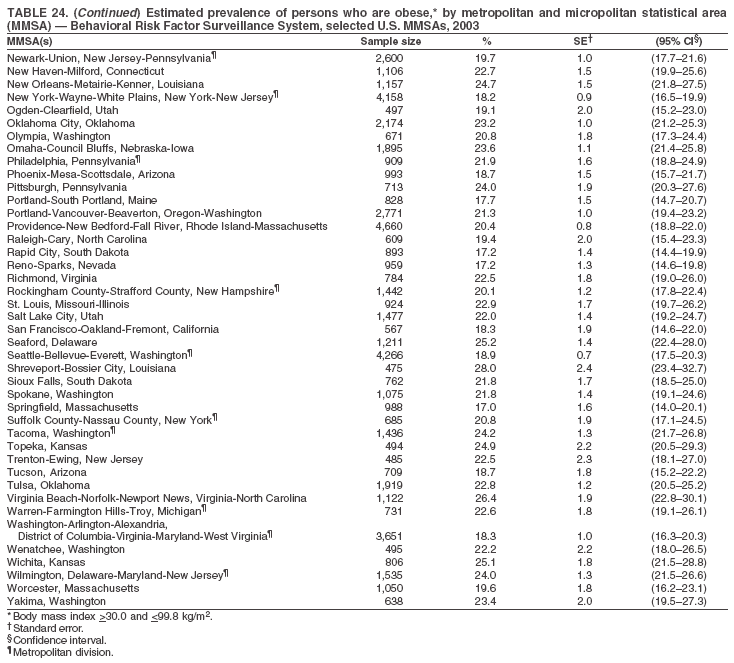
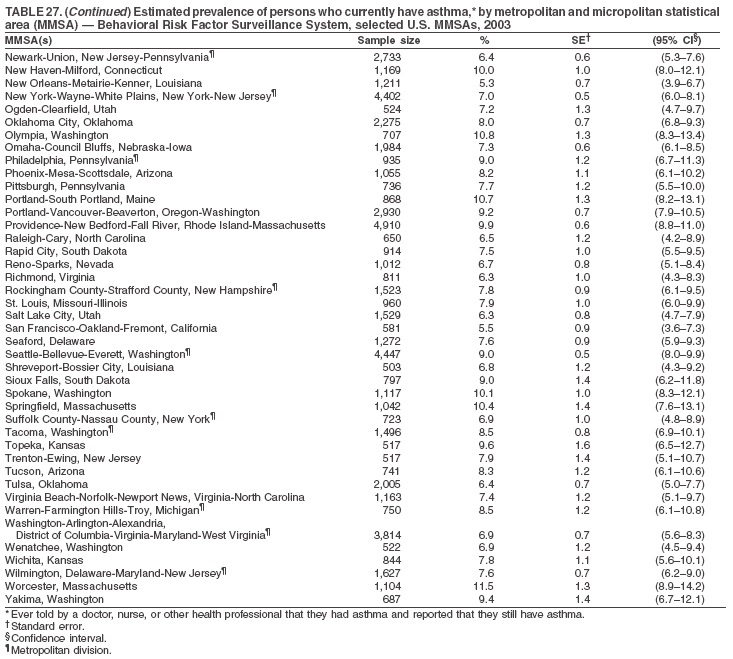
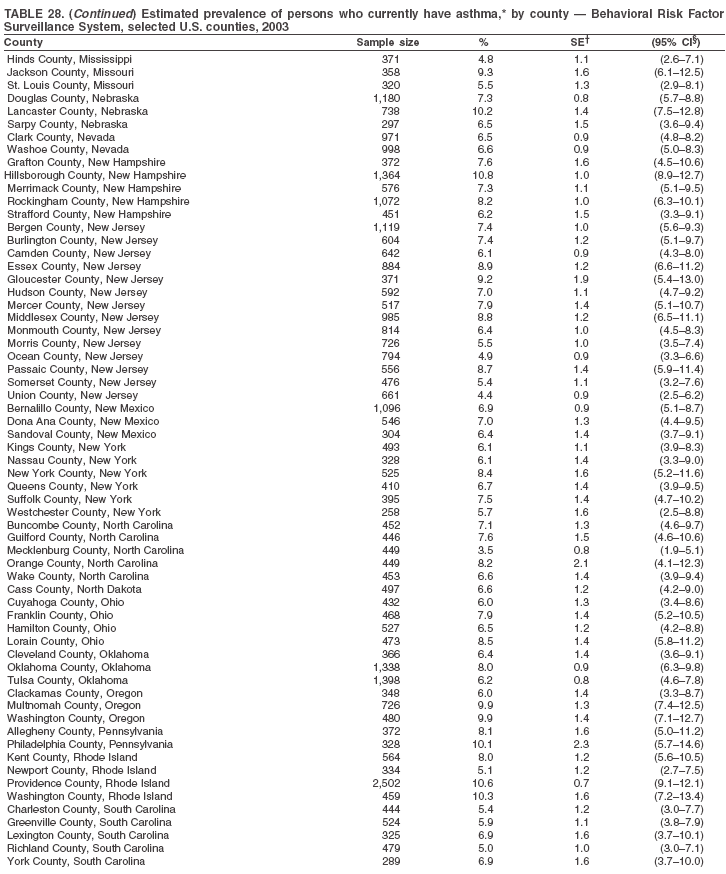
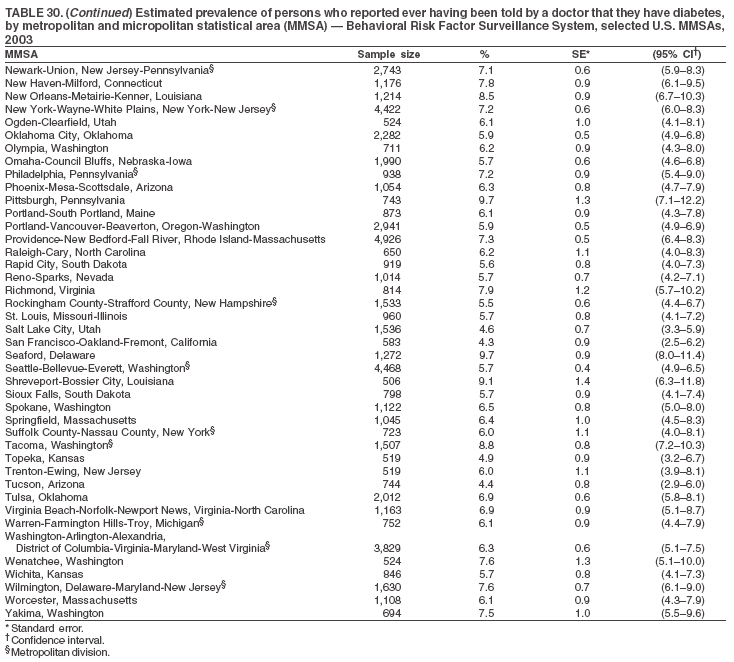
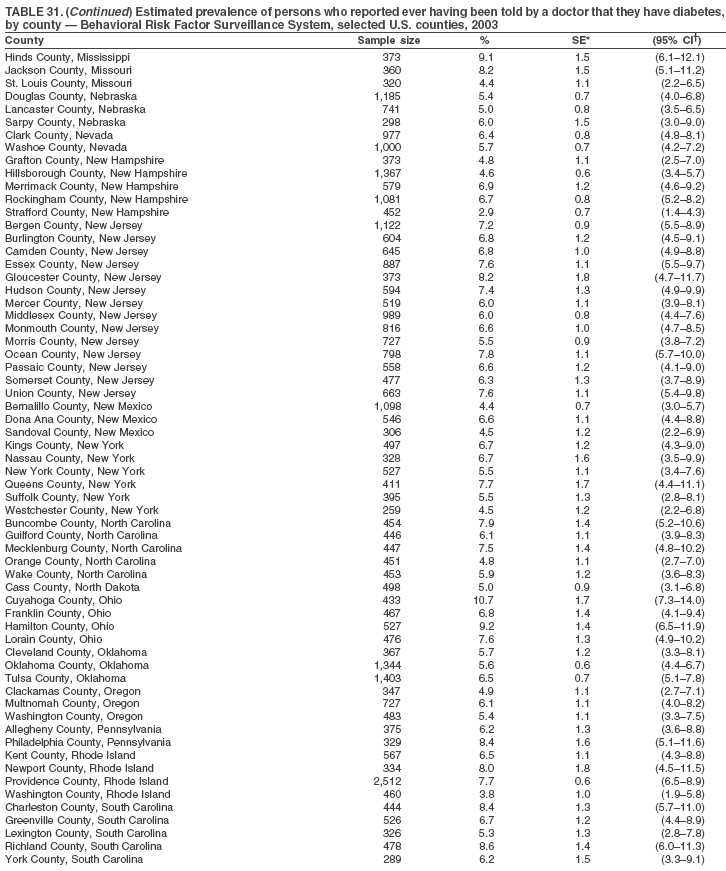
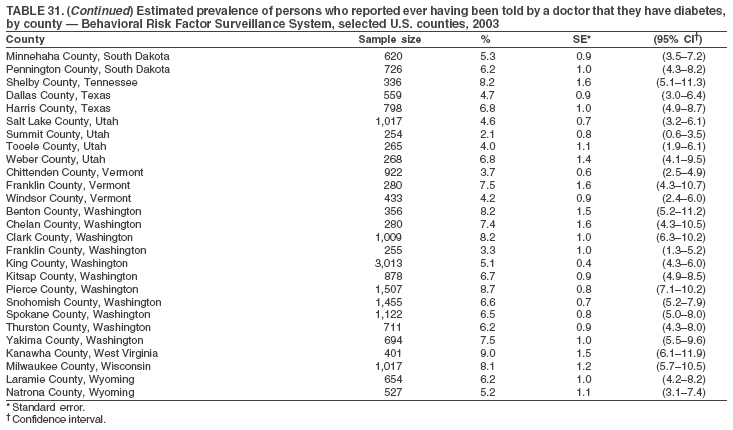
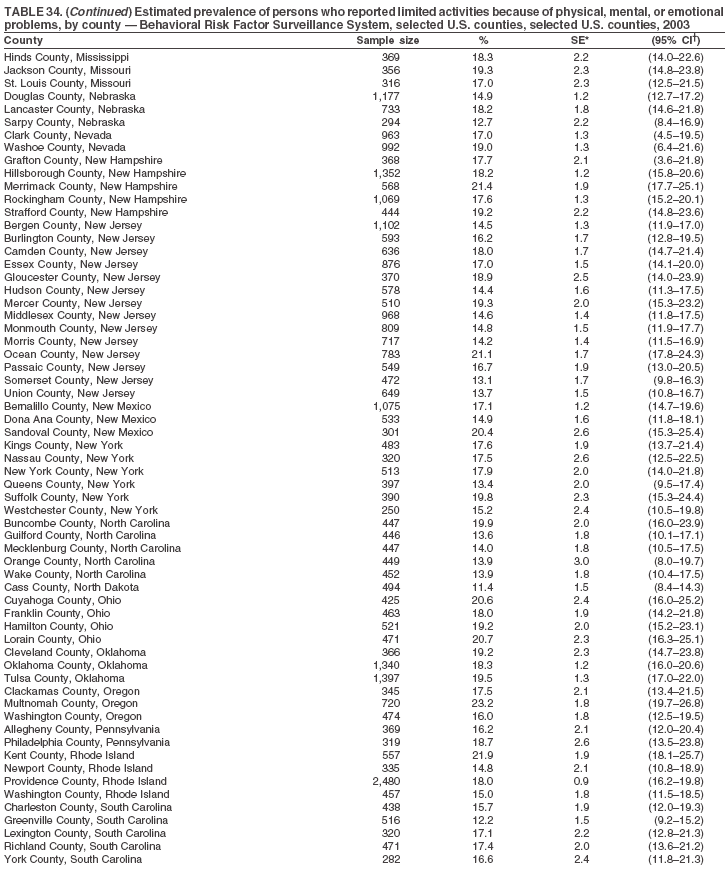
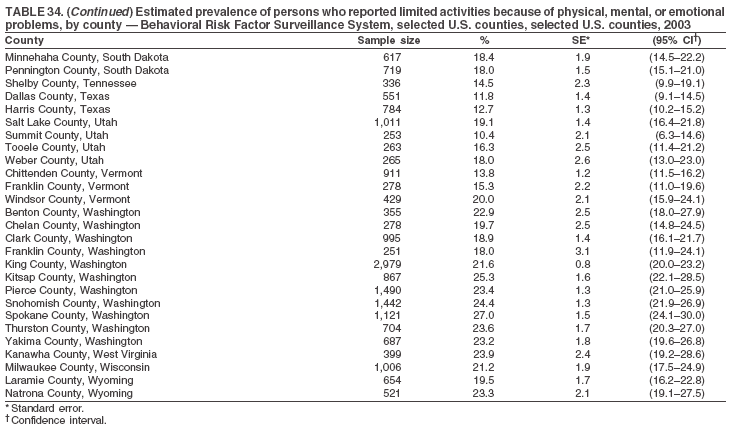
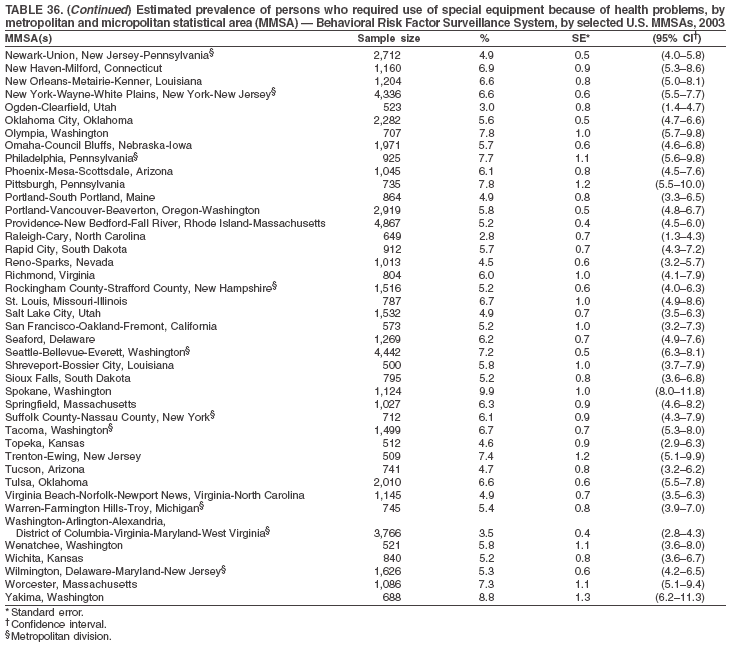
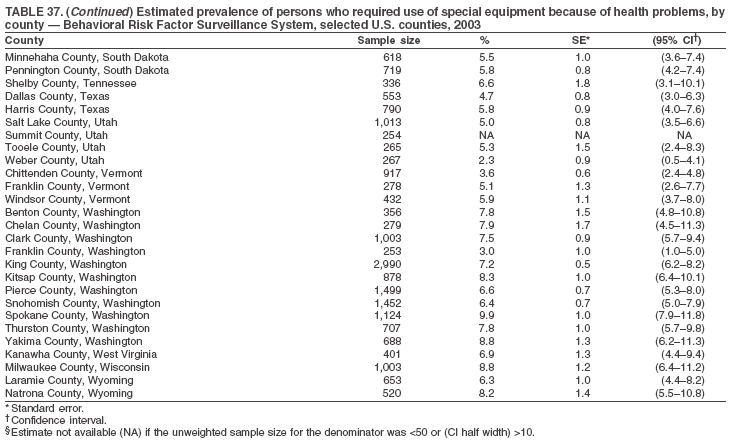
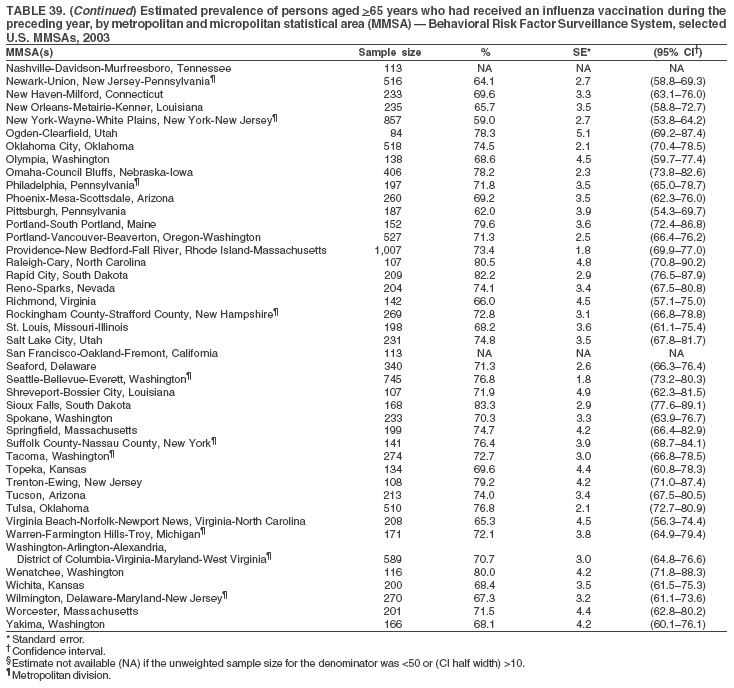
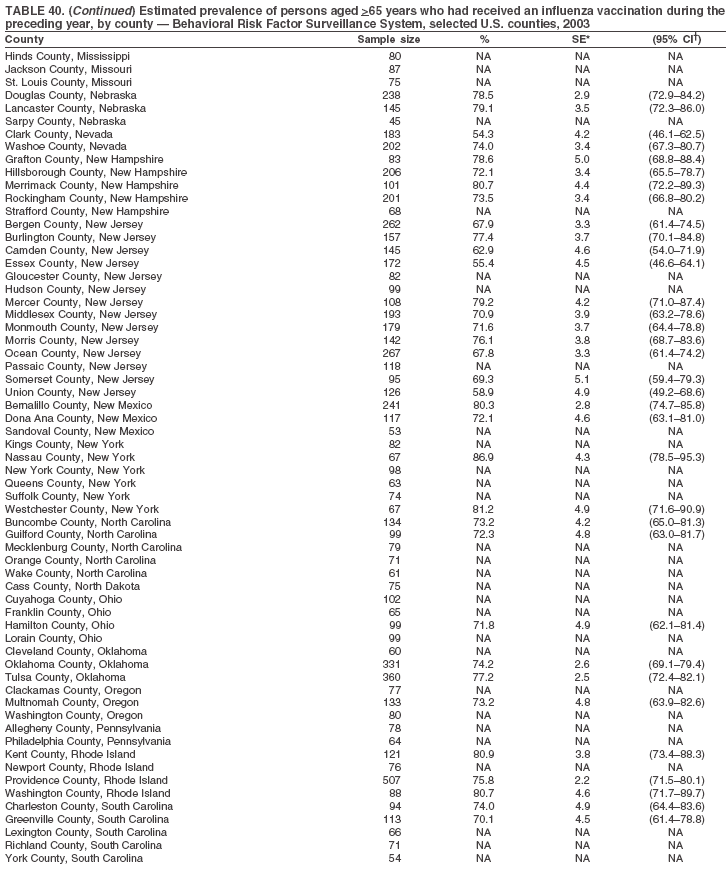
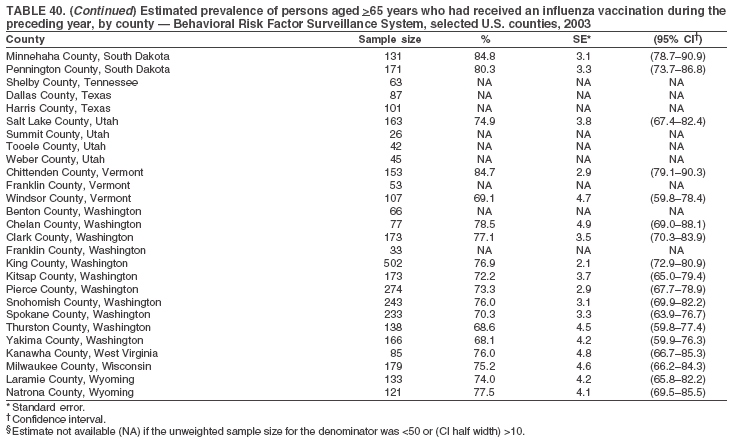
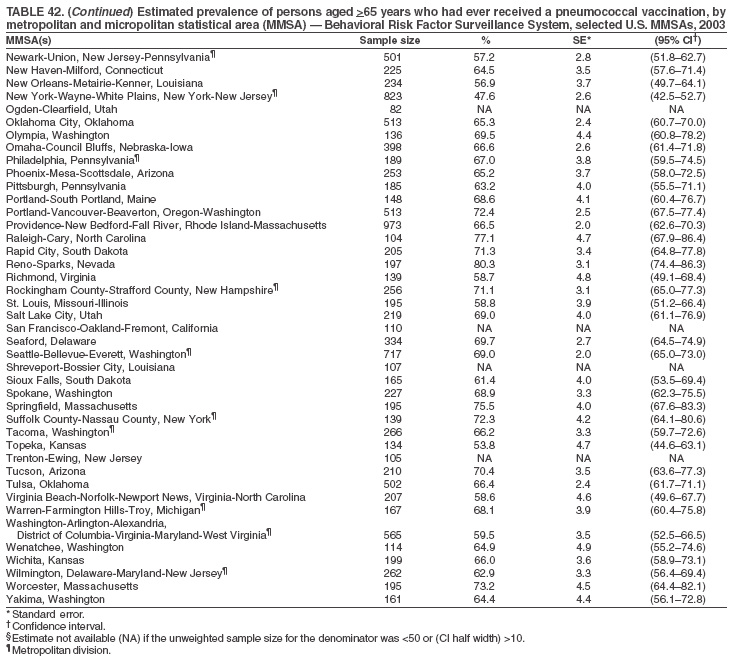
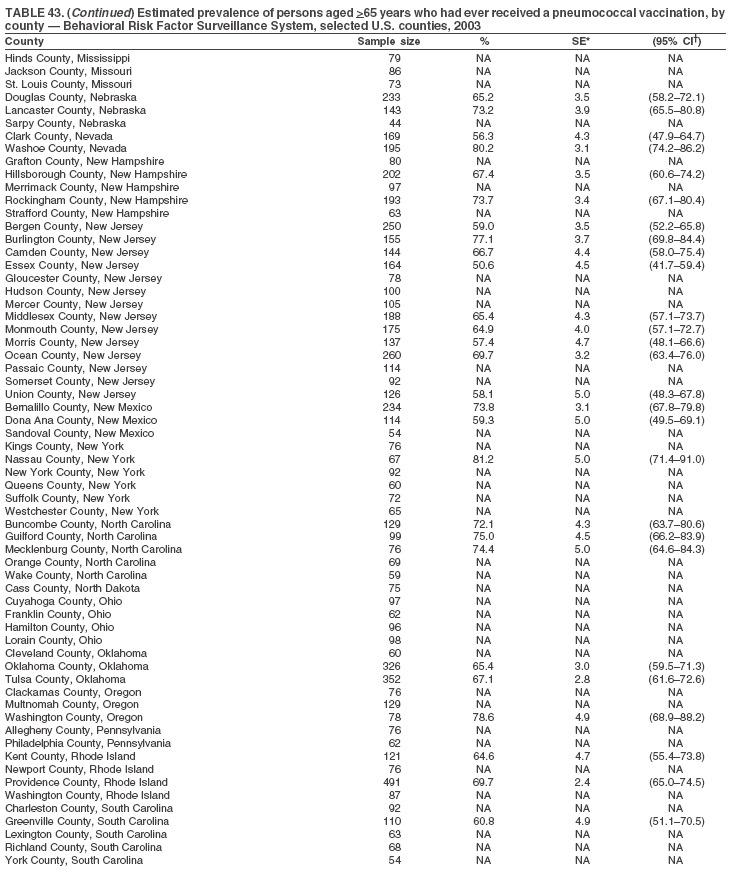
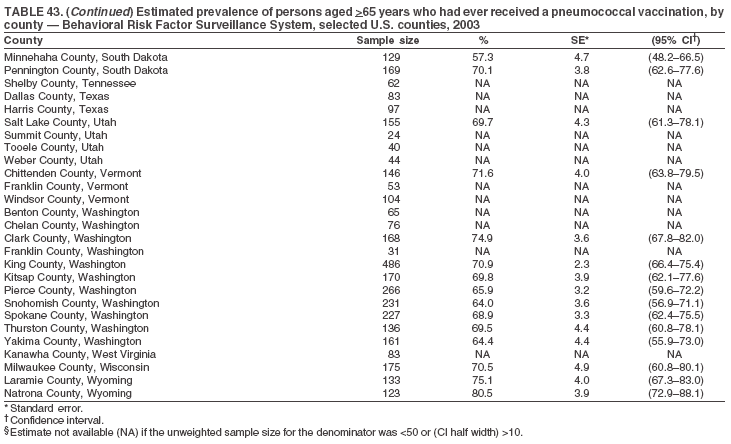
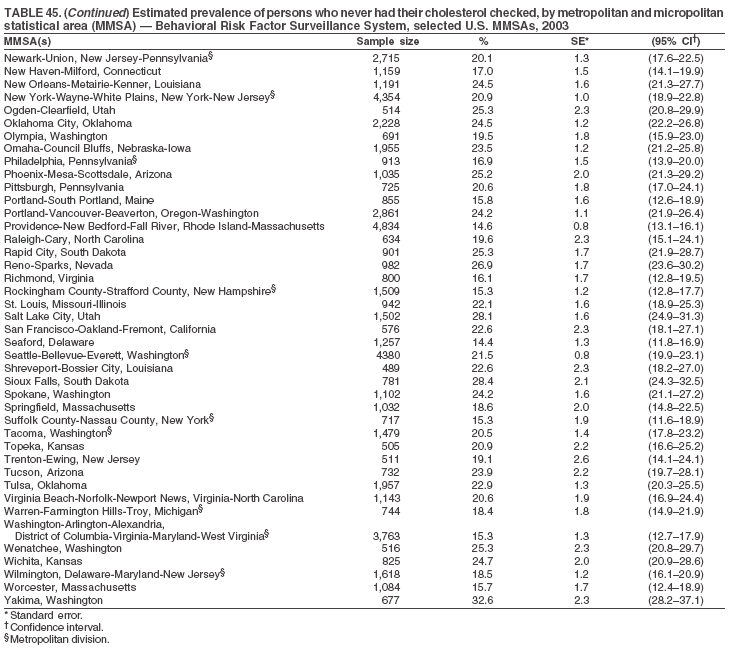
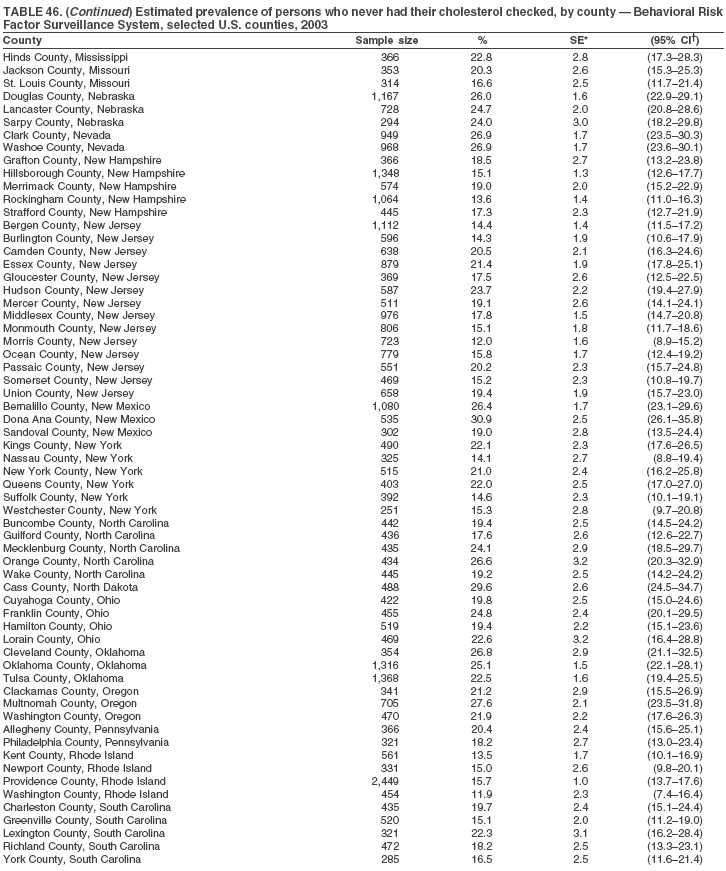
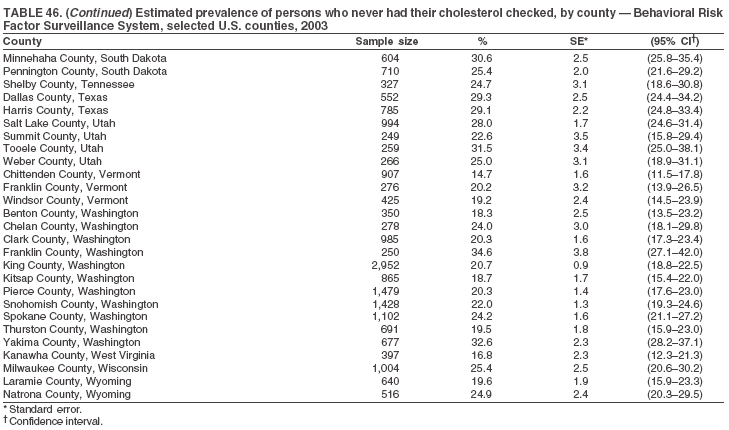
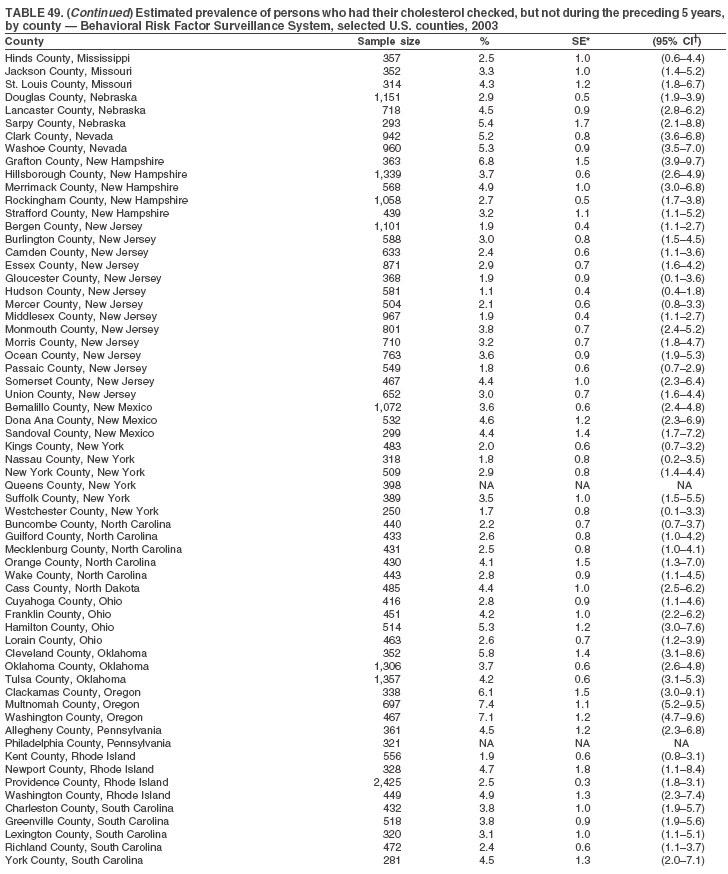
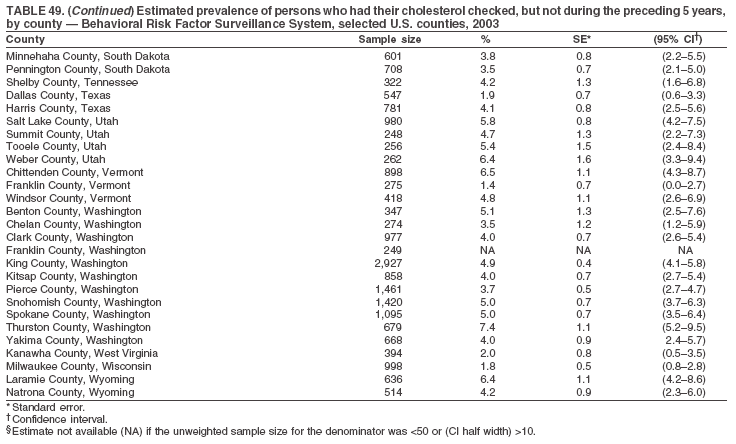
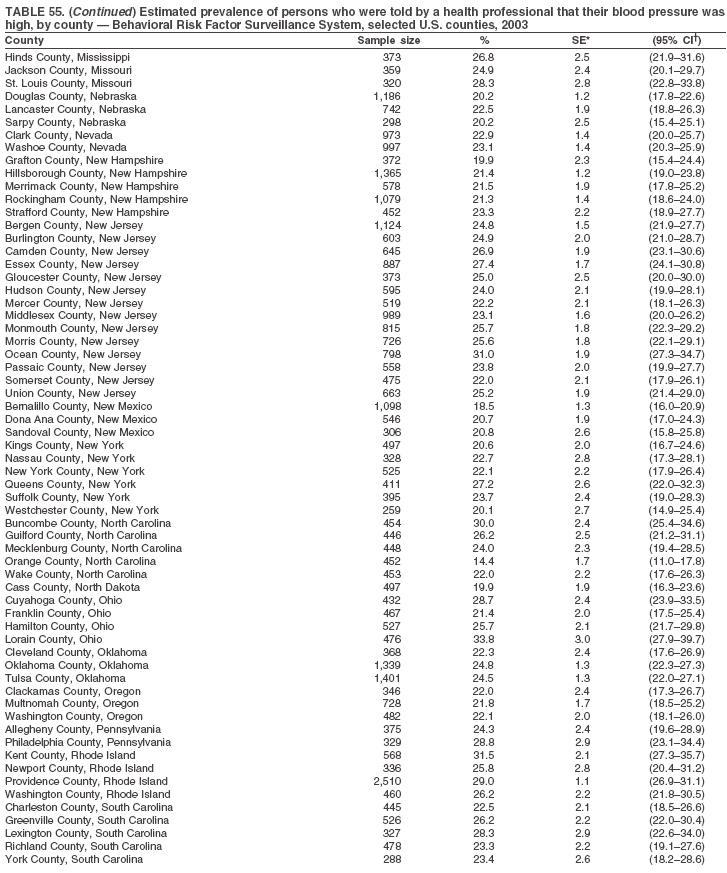
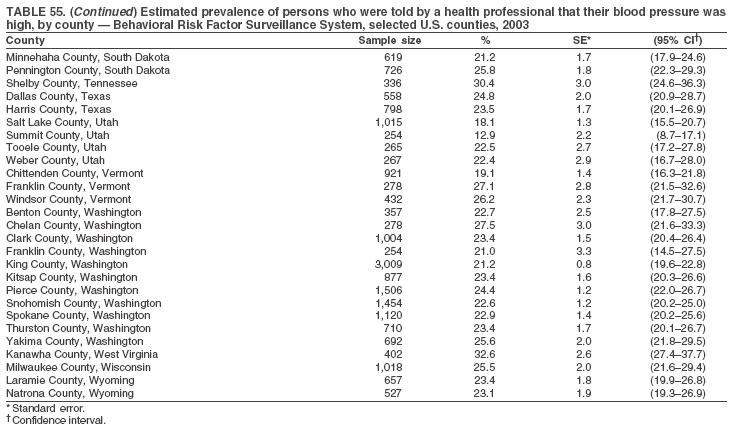
The material in this report originated in the National Center for Chronic Disease Prevention and Health Promotion, Janet Collins, PhD, Director, and the Division of Adult and Community Health, Wayne Giles, MD, Acting Director. Corresponding author: Ruth Jiles, PhD, Division of Adult and Community Health, National Center for Chronic Disease Prevention and Health Promotion, MS K-66, 4770 Buford Hwy, NE, Atlanta, GA 30341. Telephone: 770-488-5145; Fax: 770-488-8150; E-mail: rxg0@cdc.gov. AbstractProblem: Data on health risk behaviors (e.g., cigarette smoking, binge drinking, and physical inactivity) for chronic diseases and use of preventive practices (e.g., influenza and pneumococcal vaccination for adults aged >65 years and cholesterol screening) are essential for developing effective health education and intervention programs and policies to prevent morbidity and mortality from chronic diseases. Continuous monitoring of these behaviors and practices at the state, city, and county levels can help public health programs in evaluating progress toward improving their community's health. Reporting Period Covered: Data collected in 2003 are presented for states, selected metropolitan and micropolitan statistical areas (MMSAs), and their counties. Description of the System: The Behavioral Risk Factor Surveillance System (BRFSS) is an ongoing, state-based, random-digit--dialed telephone survey of the civilian, noninstitutionalized U.S. population aged >18 years. All 50 states, the District of Columbia, Guam, the Commonwealth of Puerto Rico, and the U.S. Virgin Islands participated in BRFSS during 2003. Within these states and territories, 105 MMSAs and 153 counties that reported data for at least 500 respondents or a minimum sample size of 19 per weighting class were included in the analyses. Results: Prevalence of high-risk behaviors for chronic diseases, awareness of certain medical conditions, and use of preventive health-care services varied substantially by state/territory, MMSA, and county. The proportion of the population that achieved Healthy People 2010 (HP 2010) objectives also varied by state/territory, MMSA, and county. Twelve states, 39 MMSAs, and 65 counties achieved the HP 2010 objective to reduce the proportion of adults who engage in no leisure-time physical activity to 20%. Twenty states, 41 MMSAs, and 63 counties achieved the HP 2010 goal of 50% of adults engaging in moderate physical activity for at least 30 minutes per day. The HP 2010 goal of 30% of adults who engage in vigorous physical activity was achieved by 17 states, 33 MMSAs, and 57 counties. Two states, one MMSA, and one county achieved the HP 2010 current cigarette smoking goal of 12% prevalence. One county achieved the HP 2010 binge drinking goal of 6% prevalence among adults. One MMSA and eight counties achieved the HP 2010 goal of 15% for obesity prevalence. The HP 2010 goal for influenza and pneumococcal vaccination coverage of 90% was not achieved by any state, MMSA, or county. No state, MMSA, or county achieved the HP 2010 objective of 17% prevalence of high cholesterol among adults. Interpretation: The findings in this report indicate substantial variation in health risk behaviors and use of preventative services among adults at state and local levels, indicating a need for appropriate public health interventions and continued efforts to evaluate public health programs and policies and health-care--related efforts designed to reduce morbidity and mortality. Public Health Action: Data from BRFSS are useful for assessing national health objectives, for identifying and characterizing at risk populations, and for designing and evaluating health promotion and disease prevention programs and policies. The 2003 BRFSS data indicate a continued need to develop and implement health promotion programs for targeting specific behaviors and practices and provides information for measuring progress towards achieving disease prevention and health promotion goals at state and local levels. IntroductionChronic diseases are the leading causes of morbidity and mortality in the United States. A limited number of health risk behaviors, such as cigarette smoking, poor nutrition, physical inactivity, and under use of prevention practices, are linked to chronic diseases. One major goal of public health is to prevent and reduce the prevalence of health risk behaviors and subsequent morbidity and mortality attributed to chronic diseases (1--10). Healthy People 2010 (HP 2010) objectives aim to reduce the impact of high-risk behaviors and increase use of preventative services (11). The Behavioral Risk Factor Surveillance System (BRFSS) is an ongoing, state-based surveillance system and a key source for information on health risk behavior, preventive health practices, and access to health care. BRFSS has been a source of risk behavior data since 1984, providing comparable state-specific prevalence estimates of selected health risk behaviors that are associated with chronic diseases. The growth in BRFSS sample size facilitates calculation of prevalence estimates for selected metropolitan and micropolitan statistical areas (MMSAs) and selected counties. The MMSAs used in this report are defined by the Bureau of the Census on the basis of county population density (12). This report provides 2003 prevalence estimates for selected risk factors by states/territories, MMSAs, and counties. Comparisons are also made between 2003 prevalence estimates and HP 2010 objectives (Table 1). The reliability and validity of measures of BRFSS and new challenges facing this surveillance system have been described (13,14). MethodsBRFSS is a cross-sectional telephone survey conducted by state and territorial health departments with assistance from CDC. BRFSS uses a multistage sampling design based on random-digit--dialing methods to select a representative sample of the civilian, noninstitutionalized population aged >18 years in each state. The BRFSS questionnaire includes questions regarding personal behaviors that increase risk for one or more of the 10 leading causes of death in the United States. This report includes data from states/territories, selected MMSAs, and their counties in the 50 states, the District of Columbia (DC), Guam, Puerto Rico, and the U.S. Virgin Islands with a sample size of >500 respondents or 19 per weighting class, a total of 105 MMSAs and 153 counties. Statistics for selected cities and counties were reported as not available if the denominator was <50 or the confidence interval half width was >10. In 2003, a total of 264,684 interviews were completed. QuestionnaireThe 2003 BRFSS questionnaire is partitioned into three components: the core, optional modules, and state-added questions. The core is a set of standardized questions that are asked of all respondents in each state and territory. Optional modules are sets of standardized questions regarding specific topics that are available for states to select. Each state selects the optional modules that will be used for the survey year. State-added questions are sets of questions, designed and used by one or more states to address state-specific needs. BRFSS public use files and publications use data from the core and optional modules only. Because the BRFSS employs a standard questionnaire (core questions) and standard protocol, comparable data are provided to all states on a quarterly basis. The 2003 BRFSS questionnaire included core questions that addressed demographics, including county of residence, health status, health-care access, exercise, participation in physical activities, smoking status, overweight, obesity, diabetes, hypertension awareness, cholesterol awareness, fruits and vegetables consumption, weight control, asthma, immunization, alcohol consumption, excess sun exposure, arthritis, falls, disability, veteran's status, and human immunodeficiency virus/acquired immunodeficiency syndrome (HIV/AIDS). In addition, states selected the following optional modules: diabetes (49 states), cardiovascular disease (25), expanded arthritis (25), childhood asthma (23), adult asthma history (19), tobacco indicators (18), heart attack and stroke (17), influenza (13), women's health (13), binge drinking (13), other tobacco products (11), oral health (10), colorectal cancer screening (10), folic acid (nine), and prostate cancer screening (six). Measures used in this report include no leisure-time physical activity, sufficient moderate or vigorous physical activity, cigarette smoking, alcohol consumption patterns, overweight and obesity, asthma, diabetes, disability, influenza and pneumococcal vaccinations for persons aged >65 years, and cholesterol and hypertension awareness. Data Collection and ProcessingBRFSS data are collected monthly during the interviewing period in each state. Data are sent to CDC after the monthly interviewing cycle ends, where they are checked for reliability. In 2003, all states, DC, and U.S. territories used a computer-assisted telephone interviewing (CATI) system to collect data. Data Weighting and AnalysisCDC edits and aggregates the monthly data files to create a yearly sample for each state. That file is weighted to the respondent's probability of being selected and the age-, race-, sex-specific population from the 2003 census for each state and selected MMSAs. These weights are used to calculate state and MMSA prevalence estimates. Detailed weighting and analytic methodologies are documented elsewhere (15). SAS® and SUDAAN® were used in the analyses to account for the complex sampling design and to calculate the standard errors and 95% confidence intervals (CIs) (16,17). In 2003, the number of interviews completed ranged from 766 in Guam to 18,249 in Washington (median: 4,138), and the response rates ranged from 34.4% in New Jersey to 80.5% in Puerto Rico (median: 53.2%) based on Council of American Survey and Research Organizations guidelines. Cooperation rates ranged from 60.1% in California to 91.9% in Puerto Rico (median: 74.8%). When compared with census data, BRFSS data have minimal bias, indicated by the consistency between the demographic profiles of the state-specific BRFSS sample and the state population. Bias estimates in 2000 were lower compared with BRFSS data collected in 1995, when the response rates were higher (13). In addition, when BRFSS data are compared with other surveys, these data are reliable and valid (14). Aggregate BRFSS data provide national prevalence estimates that are used to monitor progress towards achieving health promotion and disease prevention goals (18). ResultsHealth Risk BehaviorsNo Leisure-Time Physical Activity Leisure-time physical activity was measured by the respondent's indication of any participation in exercise (e.g., running, calisthenics, golf, gardening, or walking), other than their regular job, during the preceding month. In 2003, the prevalence of no participation in leisure-time activity ranged from 45.1% (95% CI = 43.2%--47.1%) in Puerto Rico to 15.0% (CI = 13.8%--16.3%) in Minnesota (median: 23.1%) (Table 2). Among all selected MMSAs, prevalence of no participation in leisure-time physical activity ranged from 33.5% (CI = 28.5%--38.4%) in Topeka, Kansas, to 13.4% (CI = 11.8%--15.0%) in Minneapolis-St. Paul-Bloomington, Minnesota-Wisconsin (median: 21.6%) (Table 3); among counties, the prevalence ranged from 33.7% (CI = 28.7%--38.7%) in Kings County, New York, to 10.9% (CI = 6.9%--14.9%) in Dakota County, Minnesota (median: 21.4%) (Table 4). Twelve states, 39 MMSAs, and 65 counties achieved the HP 2010 objective to reduce the proportion of adults who engage in no leisure-time physical activity to 20%. Sufficient Moderate and Vigorous Physical Activity Respondents were asked about the frequency and duration of both moderate and vigorous physical activities they engage in during a usual week. Responses to these questions were used to determine if respondents engaged in enough physical activity to achieve the recommendation detailed in HP 2010 goals (Table 1). Respondents who reported engaging in moderate physical activity, which causes small increases in breathing or heart rate, on at least 5 days per week for at least 30 minutes each day met guidelines for sufficient moderate physical activity. Respondents who reported engaging in vigorous physical activity, which causes large increases in breathing or heart rate, on 3 or more days per week for at least 20 minutes met guidelines for sufficient vigorous physical activity. In 2003, the percentages of adults who reported sufficient moderate physical activity ranged from 58.5% (CI = 56.3%--60.6%) in Montana to 33.8% (CI = 32.0%--35.6%) in Kentucky (median: 47.2%) (Table 5). Among MMSAs, the prevalence of sufficient moderate physical activity ranged from 61.5% (CI = 56.8%--66.2%) in Fairbanks, Alaska, to 35.7% (CI = 31.6%--39.9%) in Louisville, Kentucky-Indiana (median: 48.3%) (Table 6); among counties, the prevalence ranged from 65.6% (CI = 58.3%--72.8%) in Summit County, Utah, to 33.3% (CI = 27.4%--39.2%) in Jefferson County, Kentucky (median: 48.8%) (Table 7). Twenty states, 41 MMSAs, and 63 counties achieved the HP 2010 goal of 50% of adults engaging in moderate physical activity for at least 30 minutes per day. The percentages of adults who reported sufficient vigorous physical activity ranged from 35.5% (CI = 33.4%--37.5%) in Utah to 15.9% (CI = 14.2%--17.6%) in Puerto Rico (median: 26.3%) (Table 8). Among MMSAs, the prevalence of sufficient vigorous physical activity ranged from 41.9% (CI = 37.1%--46.7%) in Fairbanks, Alaska, to 17.6% (CI = 13.5%--21.7%) in Topeka, Kansas (median: 26.8%) (Table 9); among counties, the prevalence ranged from 51.1% (CI = 43.3%--59.0%) in Summit County, Utah, to 16.0% (CI = 11.3%--20.6%) in Jefferson County, Kentucky (median: 27.6%) (Table 10). The HP 2010 goal of 30% adults who engage in vigorous physical activity was achieved by 17 states, 33 MMSAs, and 57 counties. Current Cigarette Smoking Respondents were classified as current smokers if they had smoked >100 cigarettes during their lifetimes and reported smoking every day or some days during the 12 months preceding the survey. In 2003, the prevalence of adults who were current cigarette smokers ranged from 34.0% (CI = 30.2%--37.8%) in Guam to 10.0% (CI = 8.2%--11.7%) in the U.S. Virgin Islands (median: 22.0%) (Table 11). Among all selected MMSAs, the prevalence of current smokers ranged from 28.9% (CI = 25.0%--32.7%) in Louisville, Kentucky-Indiana, to 10.4% (CI = 7.5%--13.3%) in Ogden-Clearfield, Utah (median: 21.8%) (Table 12). The prevalence of current smoking among counties ranged from 30.1% in Orleans Parish, Louisiana (CI = 24.4%--35.9%), to 10.0% (CI = 5.8%--14.2%) in Summit County, Utah (median: 20.5 %) (Table 13). Two states, one MMSA, and one county achieved the HP 2010 current cigarette smoking goal of 12% prevalence. Alcohol Consumption Two measures of alcohol consumption are reported for 2003: binge drinking and heavy drinking. Binge drinking. Binge drinking was defined as having five or more drinks on at least one occasion during the preceding month. In 2003, the prevalence of binge drinking among persons ranged from 24.2% (CI = 22.4%--25.9%) in Wisconsin to 6.5% (CI = 5.4%--7.7%) in Tennessee (median: 16.5%) (Table 14). The prevalence of binge drinking for selected MMSAs ranged from 24.9% (CI = 16.5%--33.4%) in Fargo, North Dakota-Minnesota, to 6.8% (CI = 4.4%--9.1%) in Memphis, Tennessee-Mississippi-Arkansas (median: 16.0%) (Table 15), and for counties, the prevalence ranged from 26.2% (CI = 21.1%--31.2%) in Charleston County, South Carolina, to 3.9% (CI = 1.4%--6.4%) in Shelby County, Tennessee (median: 16.7%) (Table 16). One county achieved the HP 2010 binge drinking goal of 6% prevalence among adults. Heavy drinking. Heavy drinking was defined as an average of two or more drinks per day for men or one or more drinks per day for women during the month preceding the interview. In 2003, the prevalence of heavy drinking ranged from 8.6% (CI = 7.4%--9.7%) in Wisconsin to 2.2% (CI = 1.5%--2.8%) in Tennessee (median: 5.7%) (Table 17). The prevalence of heavy drinking in selected MMSAs ranged from 9.3% (CI = 2.4%--16.3%) in Fargo, North Dakota-Minnesota, to 1.6% (CI = 0.4%--2.7%) in Charleston, West Virginia (median: 5.8%) (Table 18), and for counties, the prevalence ranged from 11.5% (CI = 7.8 %--15.1%) in Charleston County, South Carolina, to 1.1% (CI = 0.1%--2.1%) in Weber County, Utah (median: 5.9%) (Table 19). Chronic ConditionsOverweight and Obesity Self-reported weight and height were used to calculate body mass index (BMI) (weight [kg]/height [m2]). Overweight, which also includes obesity, was classified as BMI >25.0 and obesity as BMI >30.0. In 2003, the prevalence of overweight adults ranged from 64.9% (CI = 63.1%--66.6%) in Mississippi to 50.0% (CI = 48.1%--51.9%) in Hawaii (median: 60.1%) (Table 20). Among MMSAs, the prevalence of overweight adults ranged from 66.0% (CI = 60.2%--71.9%) in Huntington-Ashland, West Virginia-Kentucky-Ohio, to 48.2% (CI = 44.9%--51.5%) in Cambridge-Newton-Framingham, Massachusetts metropolitan division (median: 58.2%) (Table 21); among counties, the prevalence ranged from 70.2% (CI = 64.3%--76.1%) in Lake County, Indiana, to 44.4% (CI = 36.4%--52.5%) in Summit County, Utah (median: 57.5%) (Table 22). The prevalence of obesity ranged from 28.4% (CI = 26.5%--30.2%) in Alabama to 16.0% (CI = 14.6%--17.3%) in Colorado (median: 22.7%) (Table 23). Among selected MMSAs, obesity prevalence ranged from 32.2% (CI = 26.4%--38.0%) in Huntington-Ashland, West Virginia-Kentucky-Ohio, to 13.4% (CI = 11.2%--15.7%) in Cambridge-Newton-Framingham, Massachusetts metropolitan division (median: 21.8%) (Table 24) and among counties from 32.7% (CI = 26.6%--38.8%) in Lake County, Indiana, to 12.4% (CI = 7.4%--17.3%) in Summit County, Utah (median: 20.9%) (Table 25). One MMSA and eight counties achieved the HP 2010 goal of 15% for obesity prevalence. Asthma Respondents who were ever told by a health professional that they had asthma and reported that they still have asthma were classified as having current asthma. The prevalence of current asthma ranged from 10.8% (CI = 9.6%--12.0%) in Puerto Rico to 4.5% (CI = 3.0%--6.0%) in the U.S. Virgin Islands (median: 7.5%) (Table 26). Among MMSAs, the prevalence of current asthma ranged from 12.5% (CI = 9.1%--15.8%) in Fairbanks, Alaska, to 3.6% (CI = 1.9%--5.2%) in Miami-Fort Lauderdale-Miami Beach, Florida (median: 7.7%) (Table 27), and among counties, the prevalence ranged from 12.5% (CI = 9.1%--15.8%) in Fairbanks/North Star Borough, Alaska, to 3.5% (CI = 1.9%--5.1%) in Mecklenburg County, North Carolina (median: 7.6%) (Table 28). Diabetes Persons were classified as having diabetes if they reported ever being told by a doctor that they have diabetes. Gestational diabetes was not included in these reported estimates. In 2003, diabetes prevalence ranged from 11.0% (CI = 10.0%--12.0%) in Mississippi to 4.7% (CI = 4.0%--5.4%) in Colorado (median: 7.2%) (Table 29). Among MMSAs, diabetes prevalence estimates ranged from 11.6% in Huntington-Ashland, West Virginia-Kentucky-Ohio (CI = 8.3%--14.8%) to 4.1% (CI = 2.4%--5.9%) in Fairbanks, Alaska (median: 6.5%) (Table 30). Among the selected counties, the prevalence of diabetes ranged from 11.7% (CI = 7.9%--15.5%) in Orleans Parish, Louisiana, to 2.1% (CI = 0.6%--3.5%) in Summit County, Utah, and Tolland County, Connecticut (CI = 0.3%--3.9%) (median: 6.5%) (Table 31). Disability Two dimensions of disability were defined: limitation of activity because of physical, mental, and emotional problems and the required use of special equipment (e.g., cane, wheelchair, special bed, or special telephone). Limited activity. Prevalence estimates for respondents who reported being limited in any way in any activities because of physical, mental, or emotional problems ranged from 26.4% (CI = 24.7%--28.0%) in West Virginia to 11.2% (CI = 10.1%--12.3%) in Hawaii (median: 18.3%) (Table 32). Among selected MMSAs, the prevalence ranged from 28.2% (CI = 22.9%--33.5%) in Huntington-Ashland, West Virginia-Kentucky-Ohio, to 9.9% (CI = 8.5%--11.3%) in Honolulu, Hawaii (median: 17.9%) (Table 33). Among counties, the prevalence of respondents who reported limited activities ranged from 27.0% (CI = 24.1%--30.0%) in Spokane County, Washington, to 9.0% (CI = 4.3%--13.8%) in Lake County, Illinois (median: 17.6%) (Table 34). Use of special equipment. Respondents were asked if they have health problem(s) that required the use of special equipment. The percentage of respondents who required use of special equipment ranged from 8.6% in Mississippi and West Virginia (CI = 7.7%--9.5%; CI = 7.6%--9.6%, respectively) to 3.5% (CI = 2.6%--4.5%) in the U.S. Virgin Islands (median: 5.9%) (Table 35). Among selected MMSAs, the use of special equipment ranged from 9.9% (CI = 8.0%--11.8%) in Spokane, Washington, to 2.8% (CI = 1.3%--4.3%) in Raleigh-Cary, North Carolina (median: 5.7%) (Table 36). Among counties, use of special equipment prevalence ranged from 11.4% (CI = 7.4%--15.5%) in Philadelphia County, Pennsylvania, to 2.3% (CI = 0.5%--4.1%) in Weber County, Utah (median: 5.6%) (Table 37). Preventative PracticesInfluenza Vaccination In 2003, state-specific prevalence estimates for self-reported influenza vaccination among persons aged >65 years during the 12 months preceding the survey ranged from 80.3% (CI = 77.5%--83.1%) in Minnesota to 34.9% (CI = 27.3%--42.4%) in the U.S. Virgin Islands (median: 69.9%) (Table 38). Among selected MMSAs, the prevalence of influenza vaccination ranged from 83.8% (CI = 80.0%--87.6%) in Minneapolis-St. Paul-Bloomington, Minnesota-Wisconsin, to 54.3% (CI = 46.1%--62.5%) in Las Vegas-Paradise, Nevada (median: 71.7%) (Table 39). Among counties, influenza vaccination prevalence ranged from 86.9% (CI = 78.5%--95.3%) in Nassau County, New York, to 54.3% (CI = 46.1%--62.5%) in Clark County, Nevada (median: 74.0%) (Table 40). The HP 2010 goal for influenza vaccination coverage of 90% was not achieved by any state, MMSA, or county. Pneumococcal Vaccination The percentage of pneumococcal vaccination coverage among persons aged >65 years ranged from 73.0% (CI = 69.8%--76.3%) in Minnesota to 31.6% (CI = 24.0%--39.2%) in the U.S. Virgin Islands (median: 64.5%) (Table 41). Pneumococcal vaccination prevalence for selected MMSAs ranged from 80.5% (CI = 72.9%--88.2%) in Casper, Wyoming, to 47.6% (CI = 42.5%--52.7%) in New York-Wayne-White Plains, New York-New Jersey metropolitan division (median: 66.0%) (Table 42). Pneumococcal vaccination prevalence for counties ranged from 81.2% (CI = 71.4%--91.0%) in Nassau County, New York, to 49.2% (CI = 42.6%--55.9%) in DC (median: 68.6%) (Table 43). The HP 2010 goal for pneumoccocal vaccination coverage of 90% was not achieved by any state, MMSA, or county. Cholesterol Awareness Respondents were asked about the history of their blood cholesterol measurements, if they ever had their blood cholesterol checked, and, if so, if it was checked during the preceding 5 years. In addition, those who had had their cholesterol checked were asked if at any time they were told that their blood cholesterol level was high. In 2003, the percentage of persons who never had their blood cholesterol checked ranged from 29.5% in Utah (CI = 27.4%--31.5%) and Guam (CI = 25.6%--33.3%) to 14.8% (CI = 13.6%--15.9%) in Massachusetts (median: 23.1%) (Table 44). Among MMSAs, the prevalence ranged from 32.6% (CI = 28.2%--37.1%) in Yakima, Washington, to 10.4% (CI = 7.7%--13.1%) in Essex County, Massachusetts (median: 21.1%) (Table 45) and among counties from 34.6% (CI = 27.1%--42.0%) in Franklin County, Washington, to 10.4% (CI = 7.7%--13.2%) in Essex County, Massachusetts (median: 20.3%) (Table 46). Of those who ever had their blood cholesterol checked, respondents who did not have it checked during the preceding 5 years ranged from 6.2% (CI = 4.9%--7.4%) in Alaska to 1.5% (CI = 1.0%--1.9%) in Florida (median: 3.9%) (Table 47). Among selected MMSAs, respondents who had not had their blood cholesterol checked during the preceding 5 years ranged from 7.4% (CI = 5.2%--9.5%) in Olympia, Washington, to 0.7% (CI = 0.1%--1.3%) in Miami-Fort Lauderdale-Miami Beach, Florida (median: 3.8%) (Table 48). Among counties, the percentage of persons who had not had their blood cholesterol checked during the preceding 5 years ranged from 7.4% (CI = 5.2%--9.5%) in both Multnomah County, Oregon, and Thurston County, Washington, to 0.8% (CI = 0.1%--1.5%) in Prince George's County, Maryland (median: 3.7%) (Table 49). Among the respondents who received a blood cholesterol check, those who were told their cholesterol was high ranged from 38.2% (CI = 36.1%--40.2%) in Michigan to 27.0% (CI = 25.1%--28.8%) in Hawaii (median: 33.1%) (Table 50), and among selected MMSAs, the range was from 44.9% (CI = 38.1%--51.7%) in Huntington-Ashland, West Virginia, Kentucky, and Ohio, to 24.7% (CI = 20.1%--29.3%) in Las Cruces, New Mexico (median: 32.5%) (Table 51). Among counties, the percentage of persons who were told their cholesterol was high ranged from 41.8% (CI = 35.1%--48.5%) in Nassau County, New York, to 22.8% (CI = 17.7%--28.0%) in Orange County, North Carolina (median: 32.7%) (Table 52). No state, MMSA, or county achieved the HP 2010 objective of 17% prevalence of high cholesterol among adults. Hypertension Awareness Respondents were asked if they had been told by a doctor, nurse, or other health-care professional that they have high blood pressure. In 2003, the percentage of persons who indicated that they were told they had high blood pressure ranged from 33.6% (CI = 31.8%--35.3%) in West Virginia to 18.8% (CI = 17.2%--20.3%) in Utah (median: 24.8%) (Table 53). Among selected MMSAs, the percentage of persons who were told they had high blood pressure ranged from 38.1% (CI = 32.1%--44.2%) in Huntington-Ashland, West Virginia, Kentucky, and Ohio, to 18.2% (CI = 15.8%--20.6%) in Salt Lake City, Utah (median: 24.0%) (Table 54). Among counties, the percentage of persons who were told that they had high blood pressure ranged from 33.8% (CI = 27.9%--39.7%) in Lorain County, Ohio, to 12.9% (CI = 8.7%--17.1%) in Summit County, Utah (median: 23.4%) (Table 55). DiscussionThe findings in this report document variation in the prevalence of key health risk behaviors related to chronic diseases and preventative practices among U.S. adults at the state, MMSA, and county level. State-specific BRFSS data have long been used to determine health priorities, develop strategic plans, target prevention programs, and monitor effectiveness of interventions at the state level. Local-level data facilitates planning prevention and intervention programs and policies that are targeted to areas of greatest need within states. Variation in risk behaviors and use of preventive practices might reflect differences in demographic and socioeconomic composition of the populations; availability of, access to, and use of health-care services; state laws or local ordinances; and reimbursement for preventive services. Each of these factors must be considered when analyzing these data. Regular physical activity reduces the risk for heart attack, colon cancer, diabetes, and high blood pressure (1). The prevalence of no leisure-time physical activity and insufficient physical activity varied by state, select MMSAs, and their counties. Few states, MMSAs, and counties achieved HP 2010 recommendations for the proportion of adults engaged in no leisure-time and vigorous physical activity. More states achieved the recommendations for sufficient moderate physical activity (1). Cigarette smoking is the single most preventable cause of morbidity and mortality in the United States (2). Despite prevention efforts to reduce smoking rates, certain areas have current smoking rates as high as 34.0%, as observed in Guam. Rates varied among MMSAs and counties, with rates as high as 30%. Overall, HP 2010 goals for current cigarette smoking were achieved by only four areas (i.e., Utah; U.S. Virgin Islands; Ogden-Clearfield, Utah; and Summit County, Utah). High smoking prevalence is indicative of the need for continuing and expanding prevention efforts. Excessive alcohol consumption, including binge and heavy drinking, has been linked to injuries and deaths from motor-vehicle crashes, falls, fires, and drownings (19). Long-term heavy drinking increases the risk for high blood pressure, heart arrhythmias, stroke, and certain forms of cancer (3,10). In 2003, the prevalence of binge drinking was nearly 3 times higher than the prevalence of heavy drinking at state, MMSA, and county levels. These findings suggest that priority prevention strategies should focus on binge drinking in addition to heavy drinking among adults (20). Overweight and obesity increase the risks for hypertension, heart disease, diabetes, arthritis-related disabilities, and certain cancers (4). Reducing obesity to 15% among adults is a national health objective for 2010. This objective was not achieved at the state level in 2003; however, it was reached in one MMSA and eight counties. Asthma, a prevalent chronic disease of the lungs that disproportionately affect poor, minority, inner-city populations, contributes to serious morbidity and morbidity (5). The 2003 BRFSS data indicate little variability in asthma prevalence among states/territories, MMSAs, and counties. The major health consequences of diabetes include heart disease, stroke, blindness, kidney failure, pregnancy complications, lower-extremity amputations, and death. Given the high prevalence of overweight and obesity in the United States, monitoring the prevalence of diabetes is a major public health priority. Although BRFSS does not inquire about specific classification of diabetes, the overall estimated prevalence of diabetes was as much as 11% at the state and MMSA level. Disabilities and limitation in activities severely affect quality of life and health behaviors such as physical activity and obesity (6). Variation in the prevalence of activity limitation and use of special equipment was observed within states, MMSAs, and local areas. These data suggest that severe disabilities requiring special equipment are not as prevalent as less severe disabilities. For persons aged >65 years, influenza and pneumonia are leading causes of morbidity and mortality (7). The HP 2010 objective for vaccination coverage for persons in this age group is 90%. Despite numerous programmatic efforts, this objective was not achieved by any state, MMSA, or county in 2003. Cardiovascular disease remains the leading cause of mortality in the United States, and capturing critical measurements of cardiovascular health is a major priority. BRFSS also measures screening practices and awareness of potential health threats, such as high cholesterol and hypertension. Despite initiatives to reduce the population's cardiovascular risk, as much as 30% of persons (e.g., in Utah) reported never having their blood cholesterol checked. Among those who had their blood cholesterol tested, as many as 45% at the MMSA level were told their blood cholesterol was high. In addition, approximately 38% of persons at the MMSA level reported being told by a health-care professional that their blood pressure was high. High blood cholesterol and hypertension are two modifiable health risk factors that, when reduced, can greatly decrease early mortality (8--10). Identifying and reducing risk among those with high cholesterol and hypertension are key strategies to preventing cardiovascular disease and stroke morbidity and mortality. The findings in this report are subject to at least two limitations. First, BRFSS is a telephone-based survey and might miss areas or groups of the population without telephones. Thus, these data might not be representative of those without telephones. Second, all data are self-reported and, for certain behaviors, the reported estimates might be conservative. Despite these limitations, BRFSS is a cost-effective and timely telephone survey that provides essential information for state and local public health programs and policies. Moreover, the reliability and validity of BRFSS data has been assessed and proven (14). Overall, these data document high prevalence of health risk behaviors associated with leading causes of disease and death in the United States and demonstrate a need for appropriate public health interventions. These data also demonstrate the usefulness of timely, comparable state-specific health behavioral data provided by BRFSS, which remains a unique tool for monitoring health risk behaviors over time and for supporting targeted prevention programs and policies at national, state, and local levels. References
Table 1 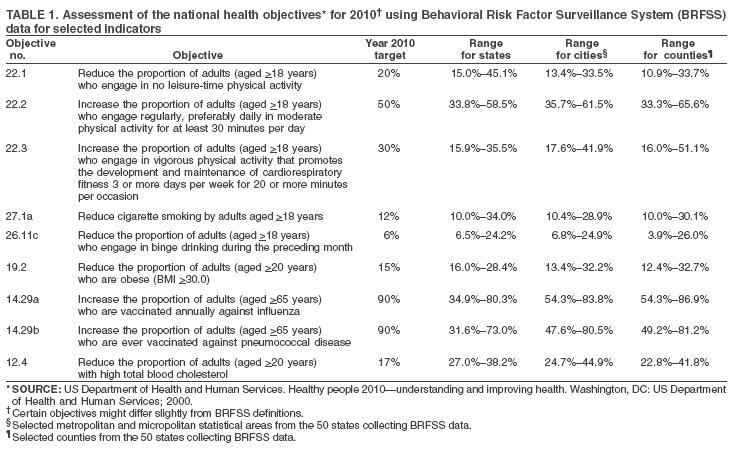 Return to top. Table 2 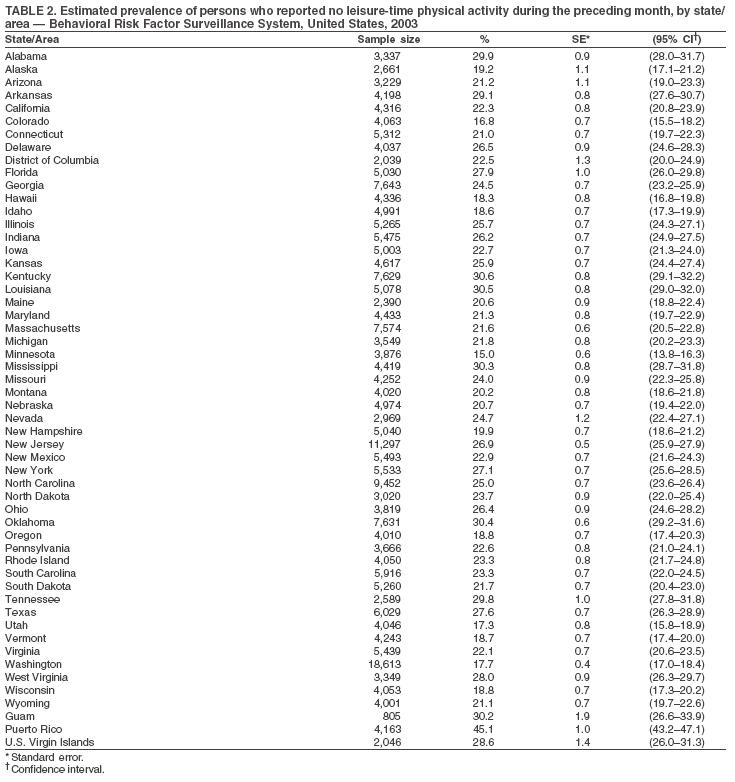 Return to top. Table 3 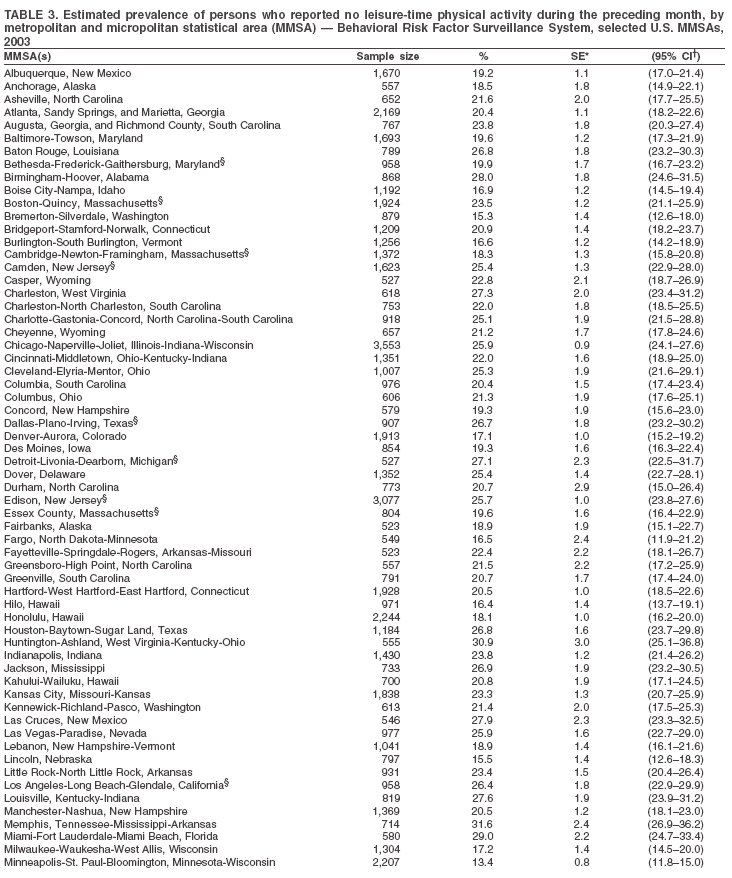 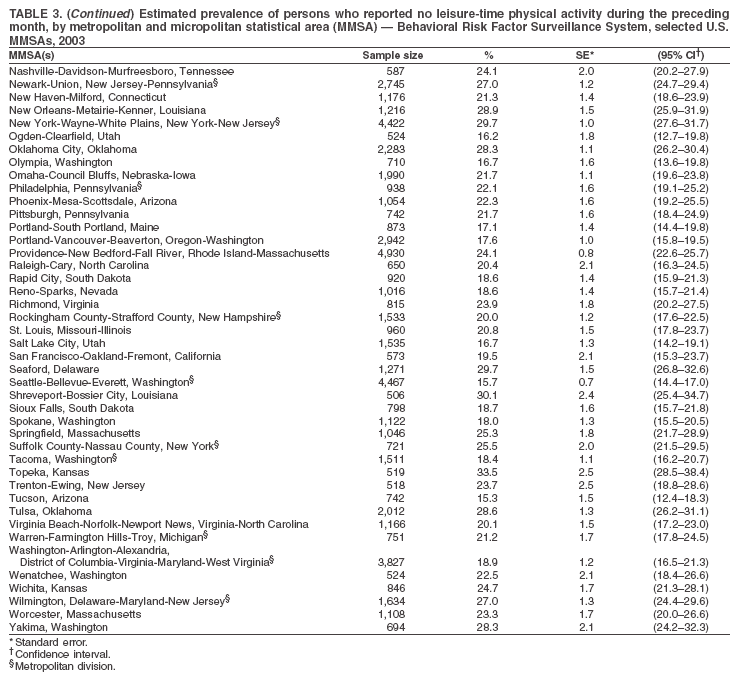 Return to top. Table 4 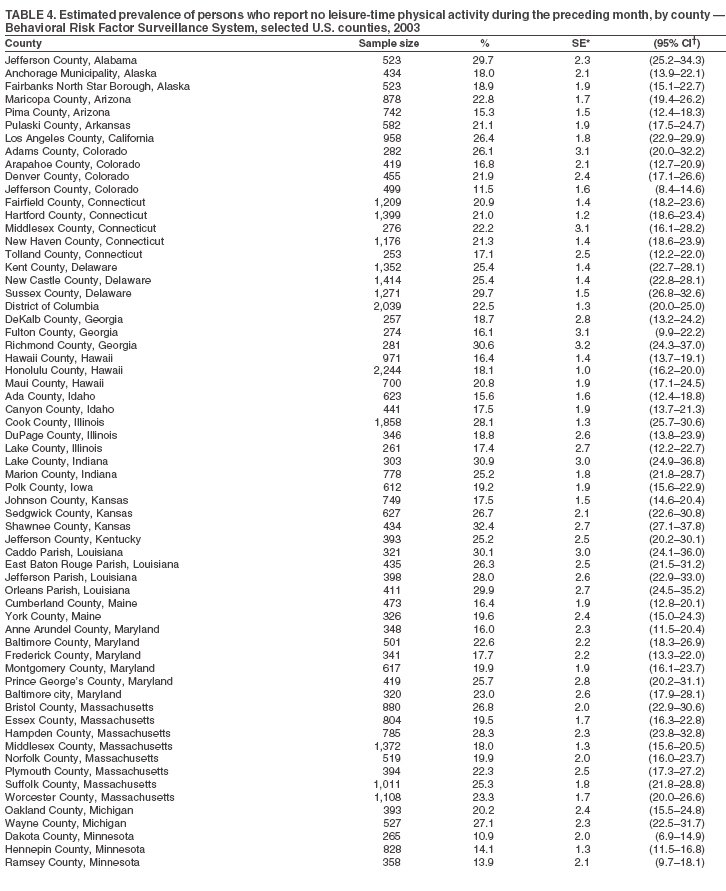

 Return to top. Table 5 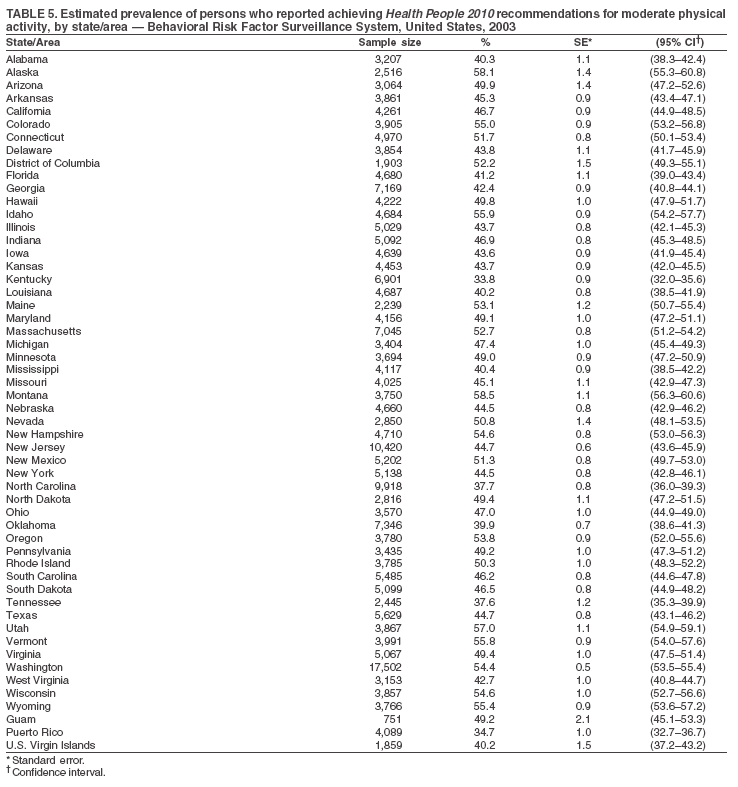 Return to top. Table 6 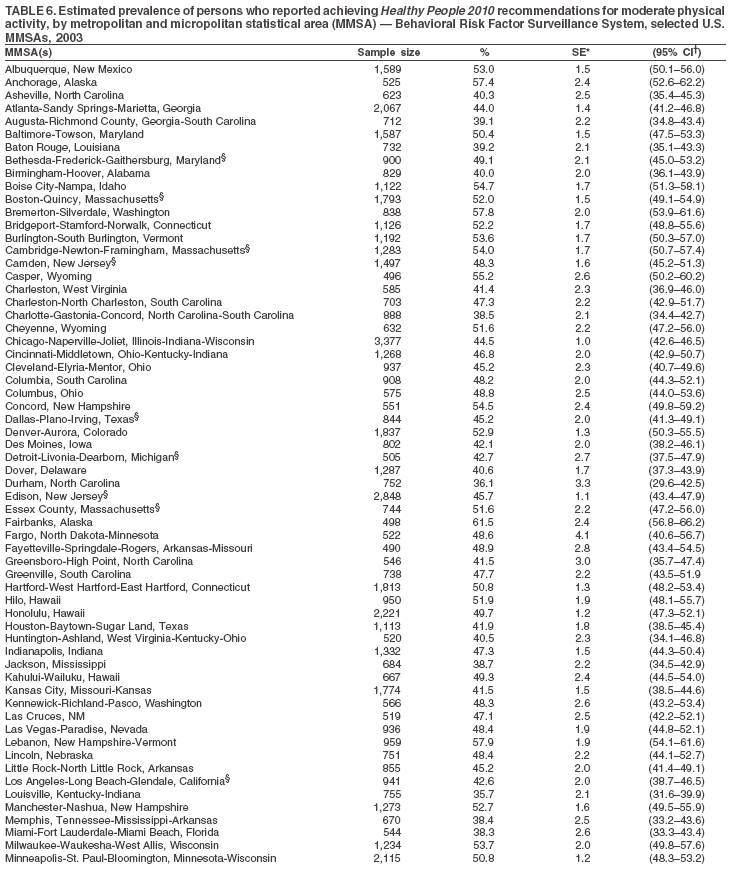
 Return to top. Table 7 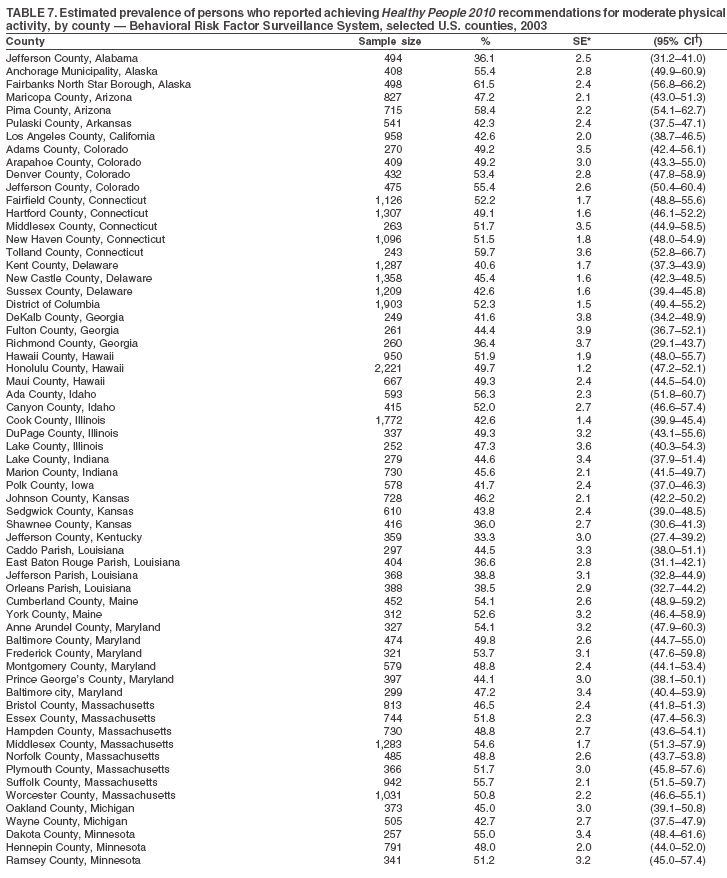
 Return to top. Table 8 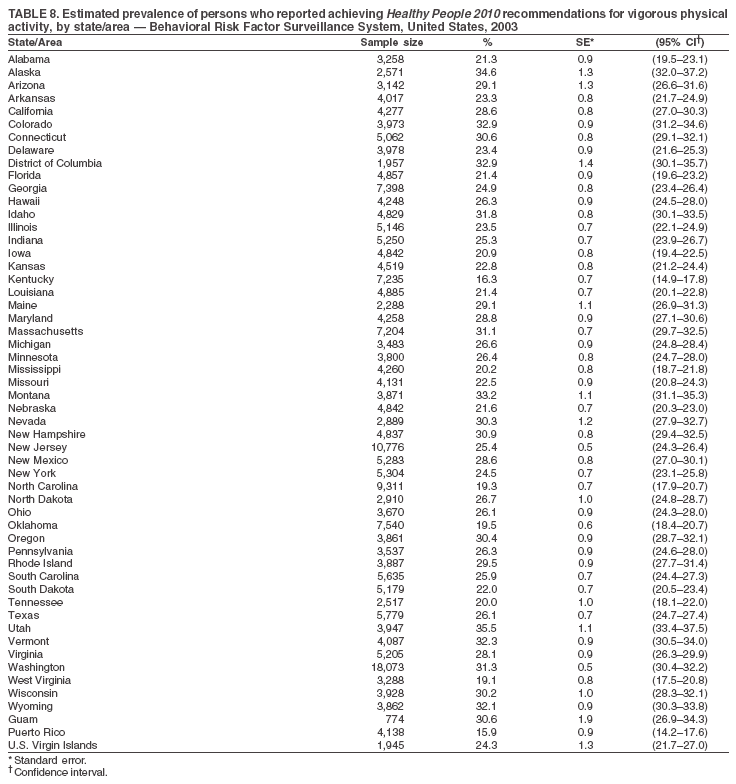 Return to top. Table 9 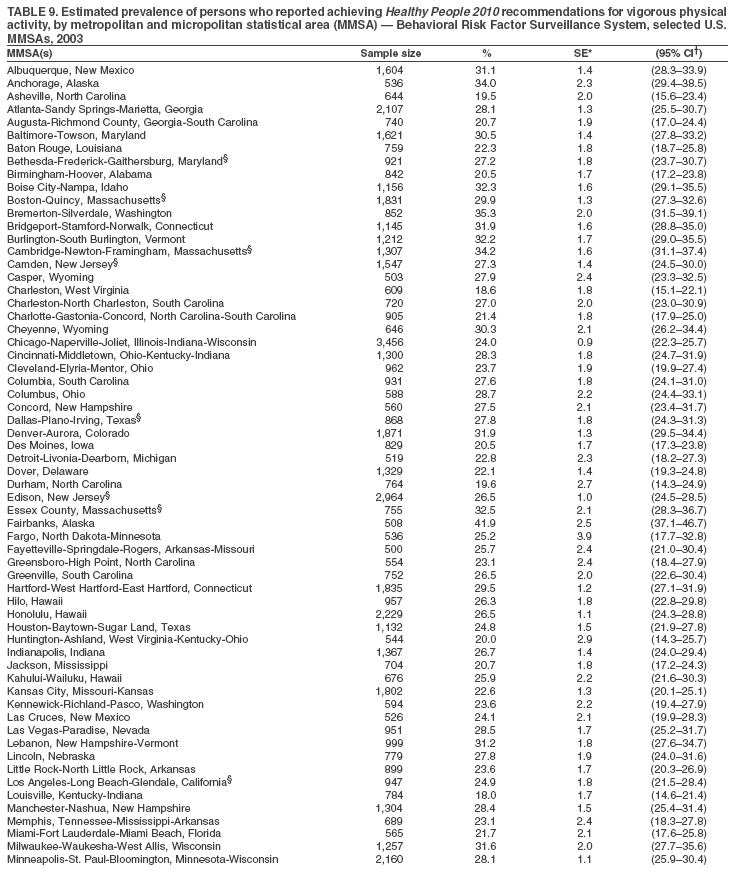
 Return to top. Table 10 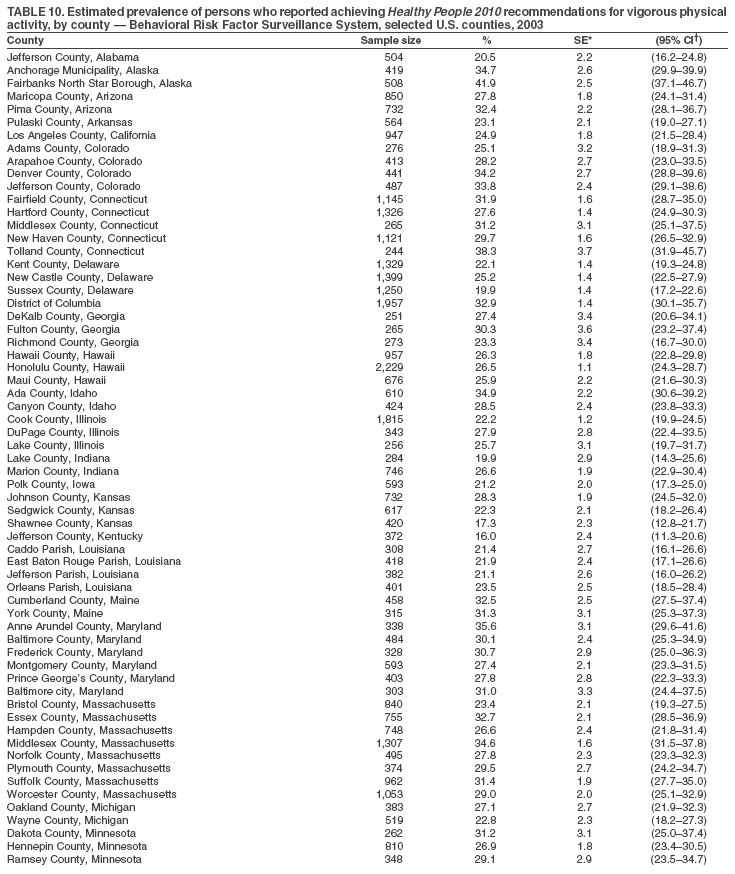
 Return to top. Table 11 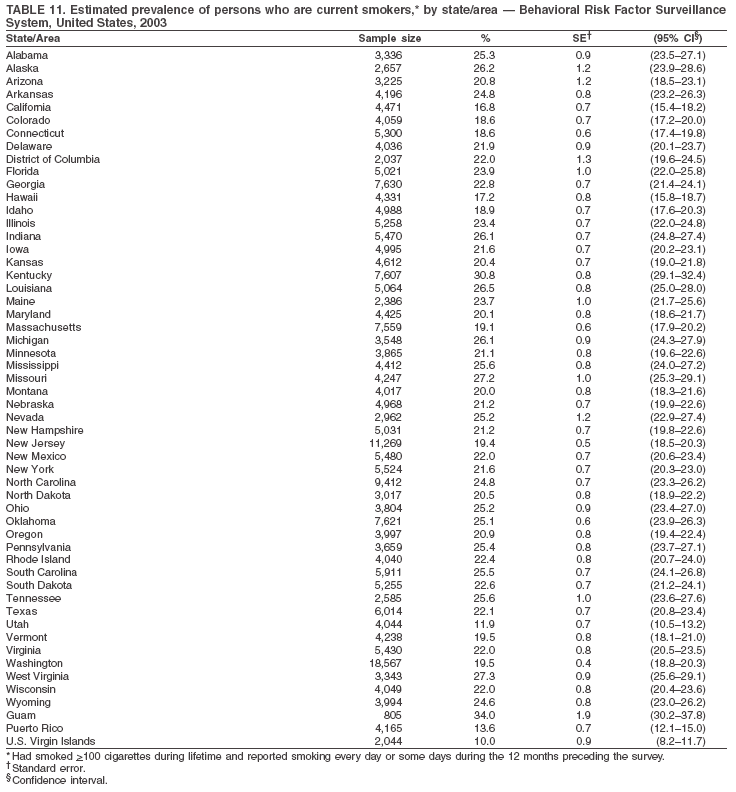 Return to top. Table 12 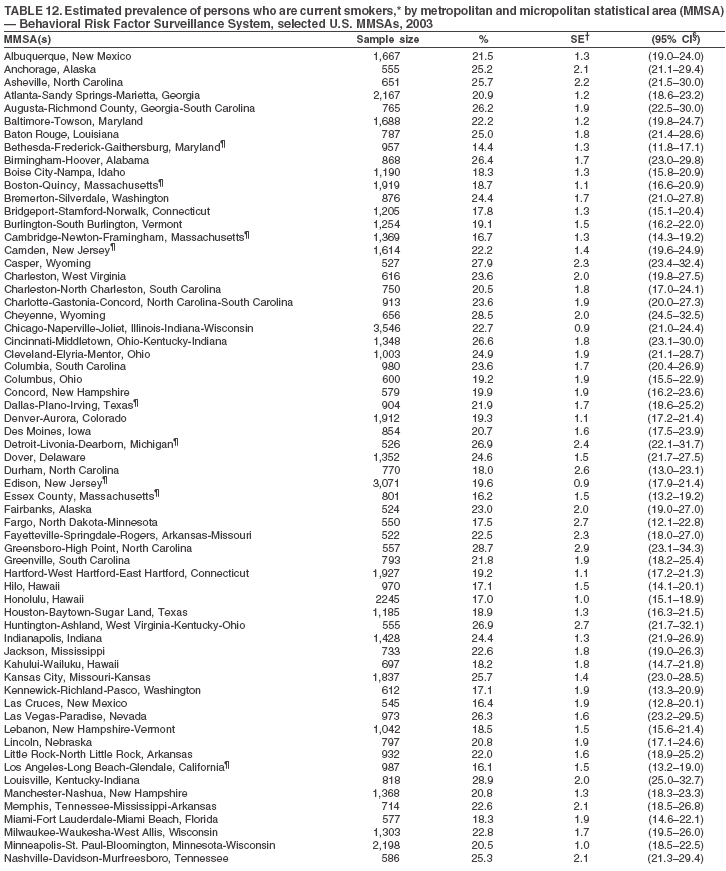
 Return to top. Table 13 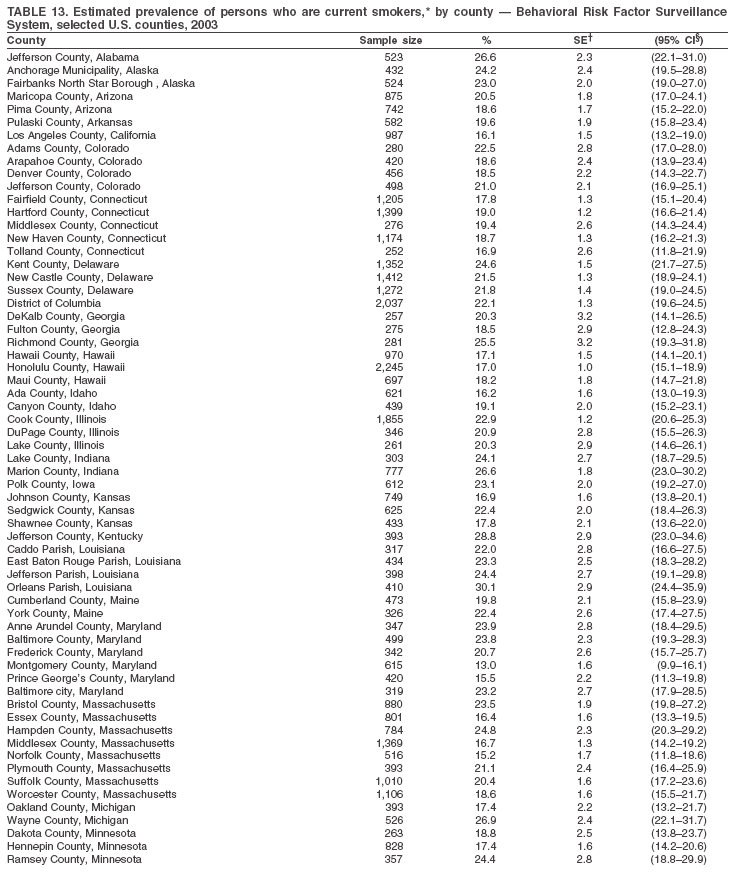
 Return to top. Table 14 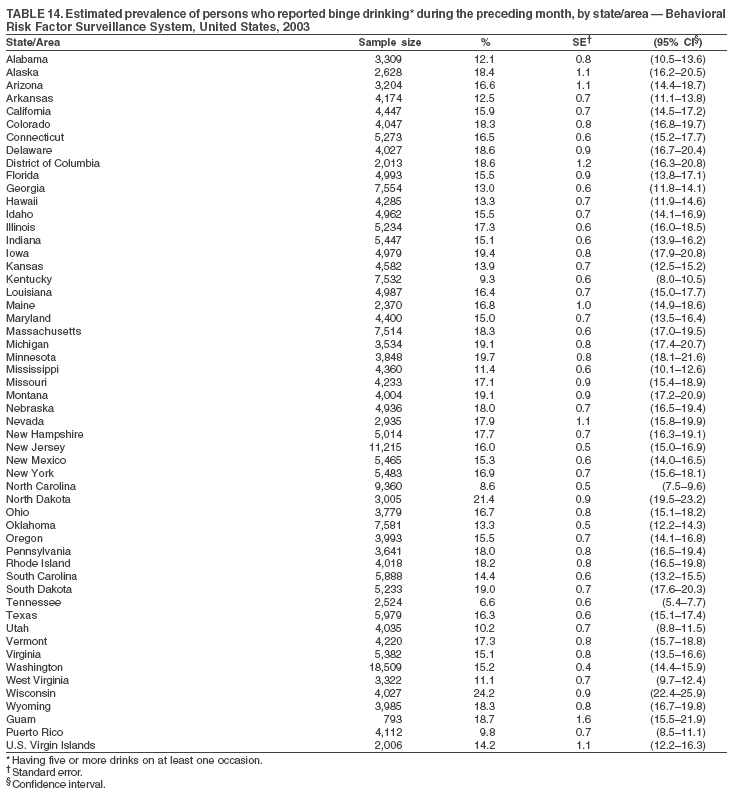 Return to top. Table 15 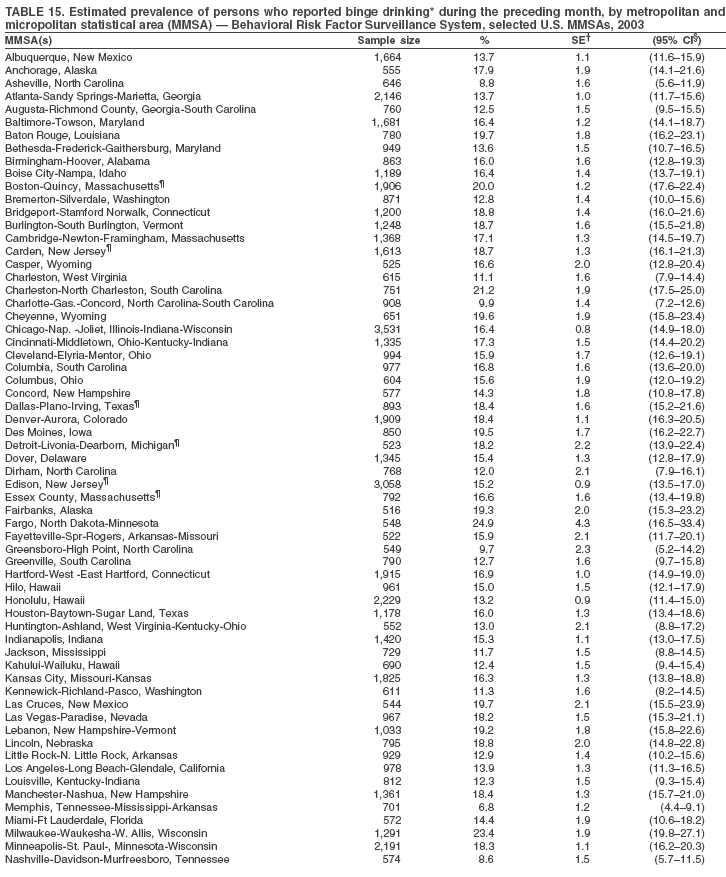
 Return to top. Table 16 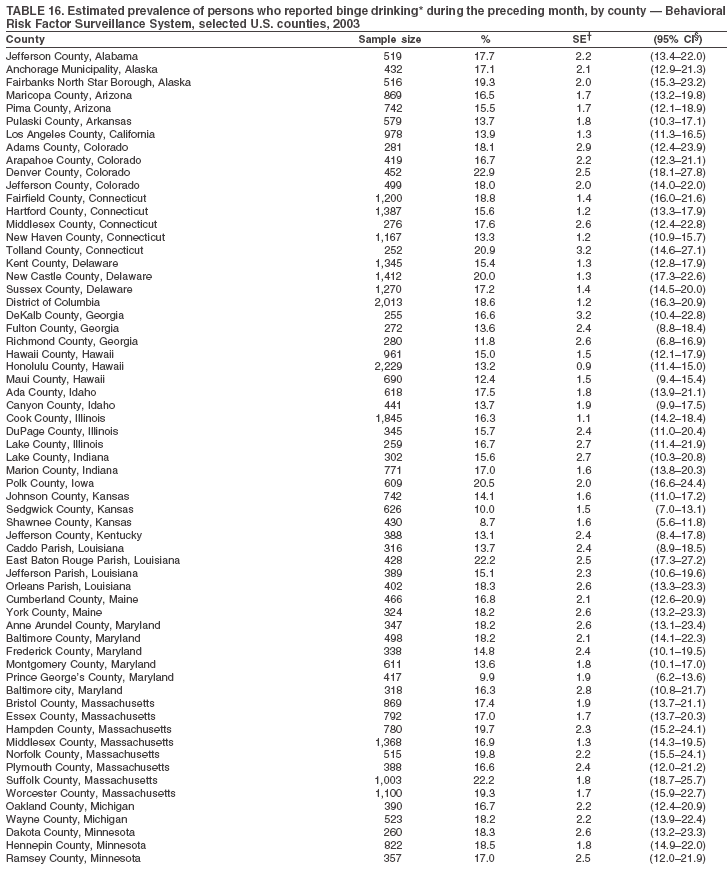
 Return to top. Table 17 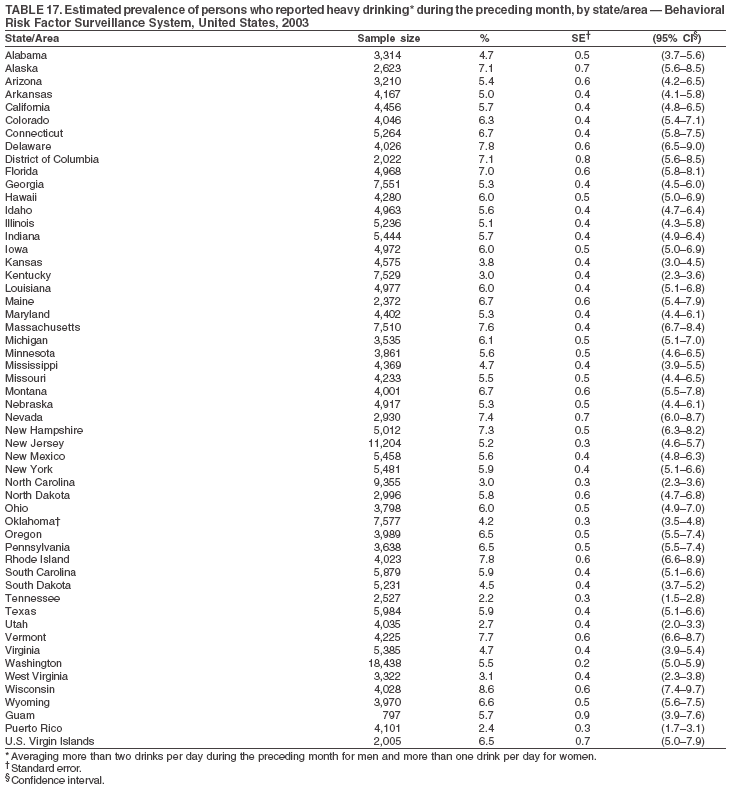 Return to top. Table 18 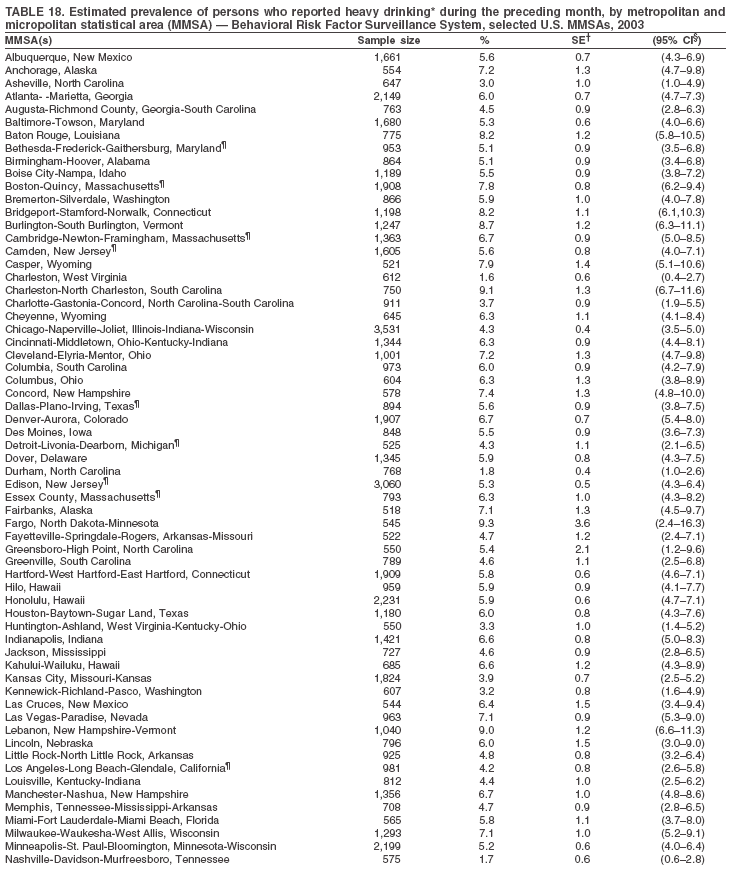
 Return to top. Table 19 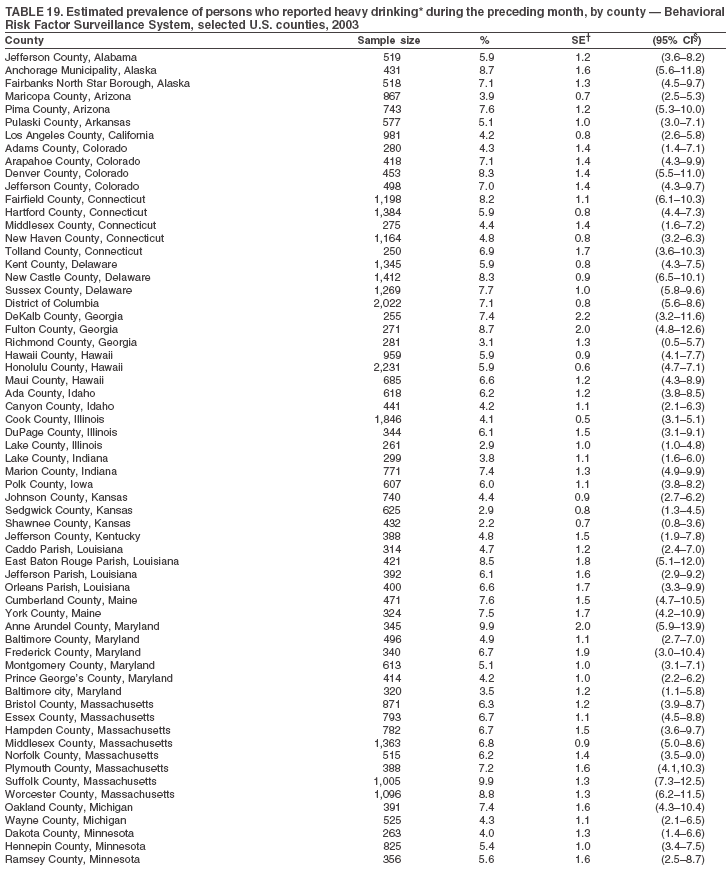
 Return to top. Table 20 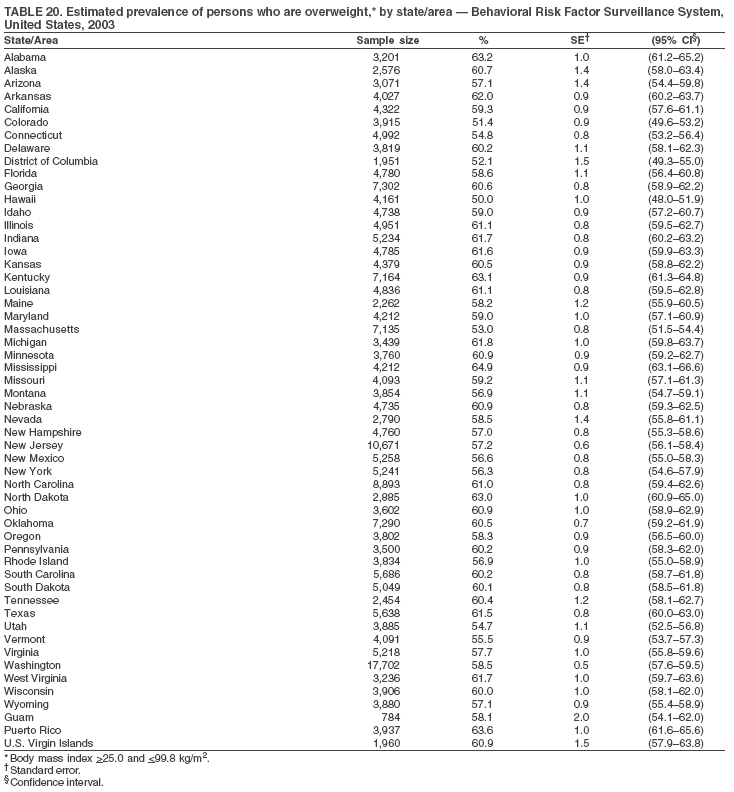 Return to top. Table 21 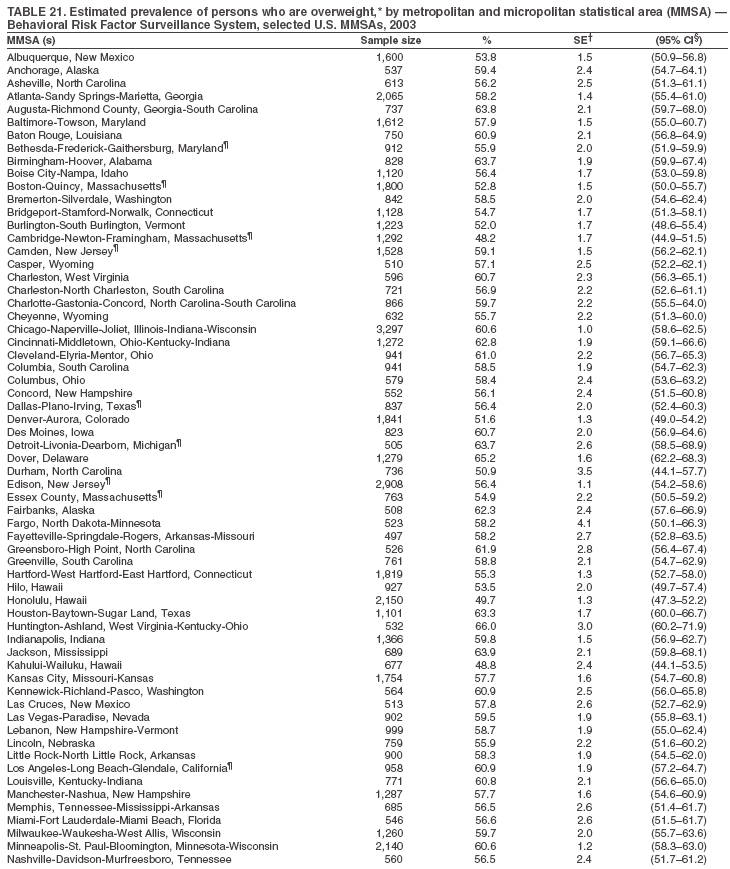
 Return to top. Table 22 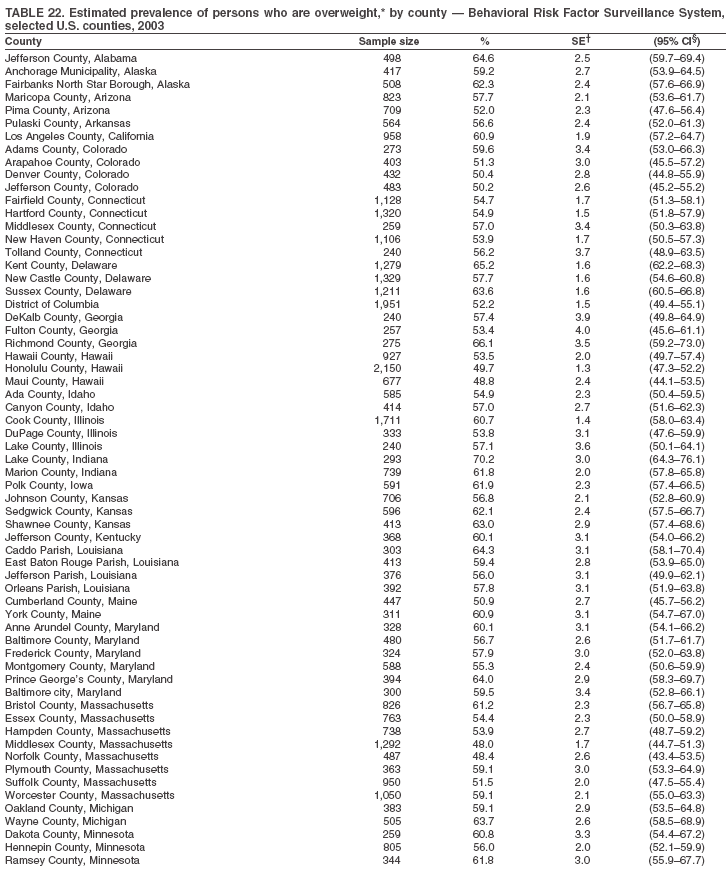
 Return to top. Table 23 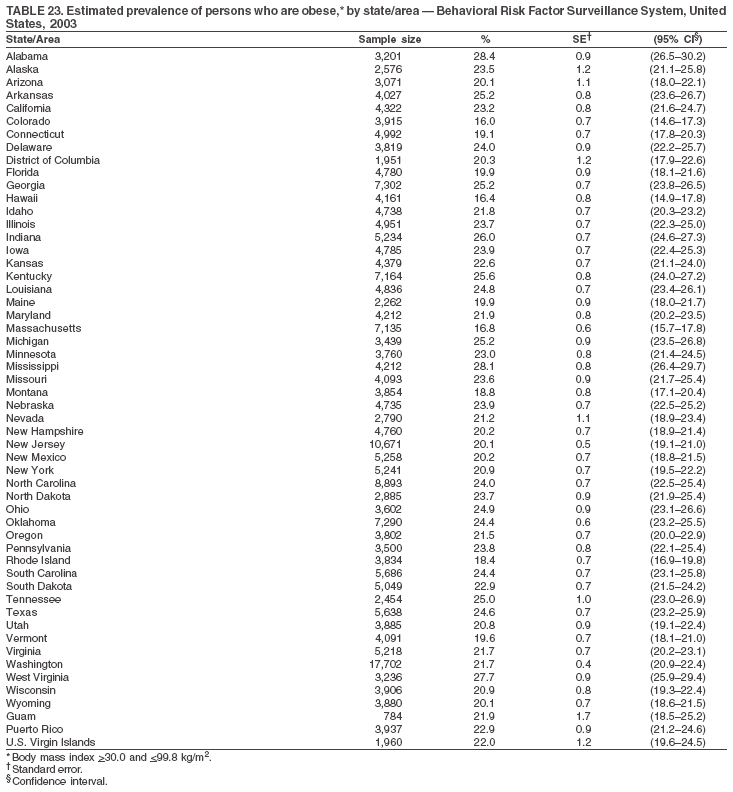 Return to top. Table 24 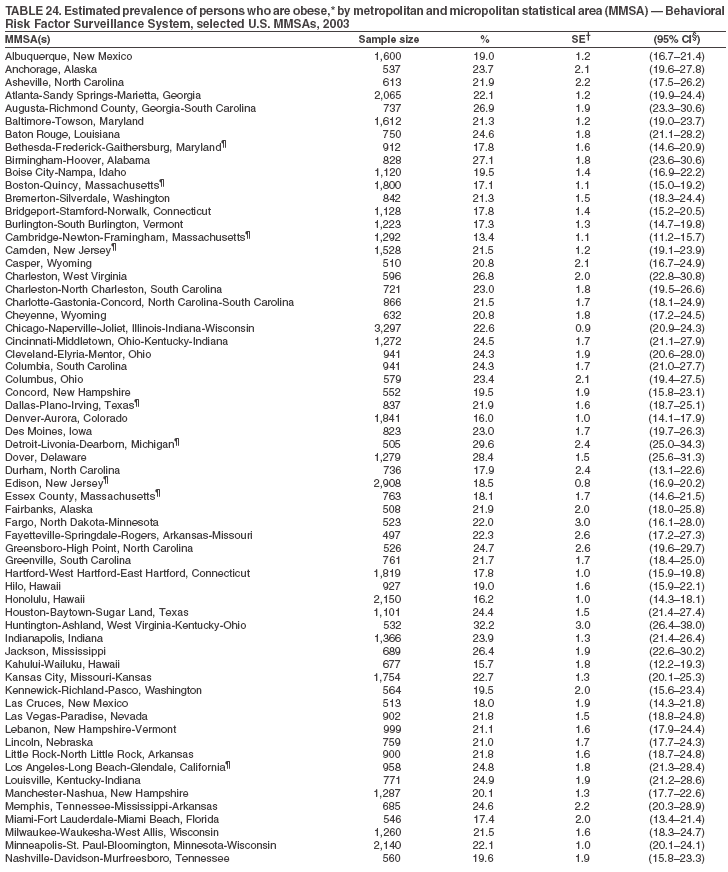
 Return to top. Table 25 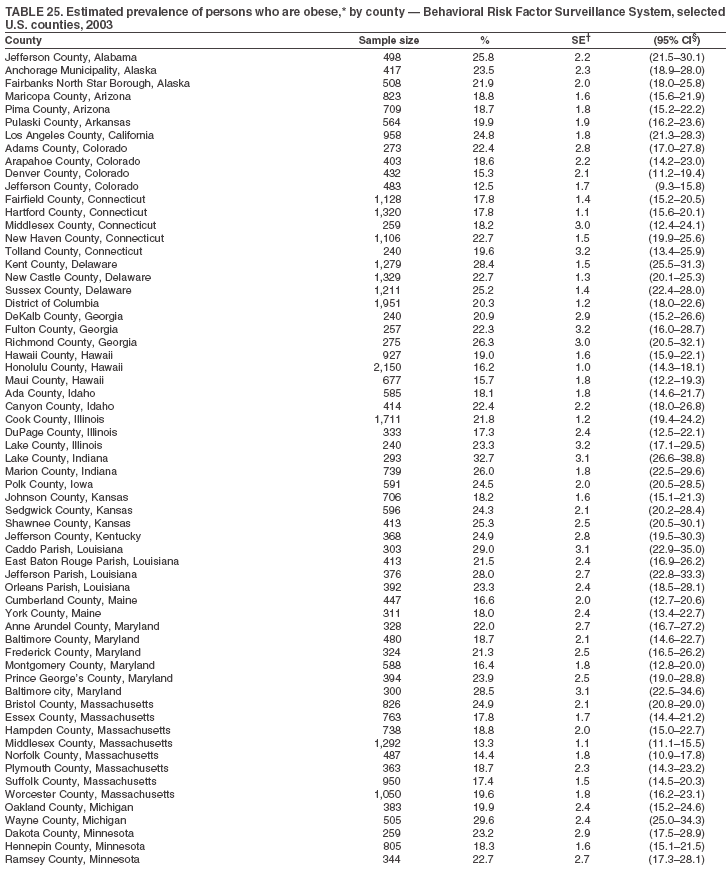

 Return to top. Table 26 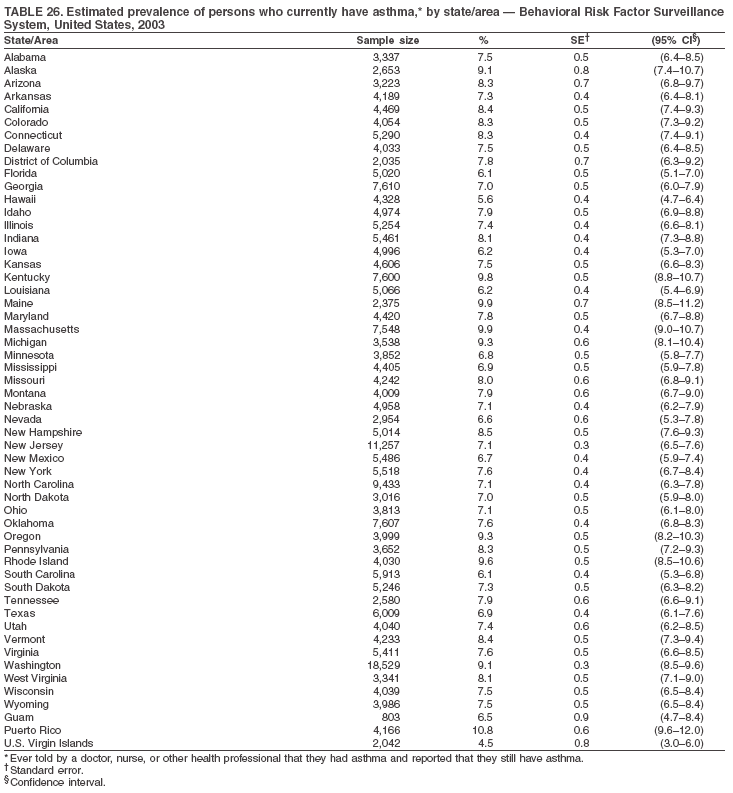 Return to top. Table 27 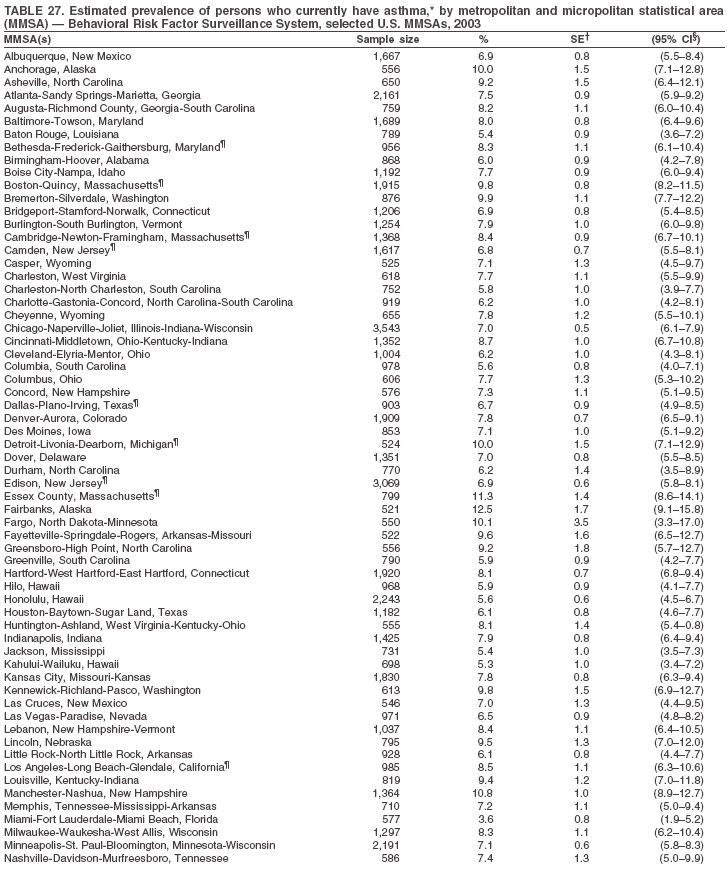
 Return to top. Table 28 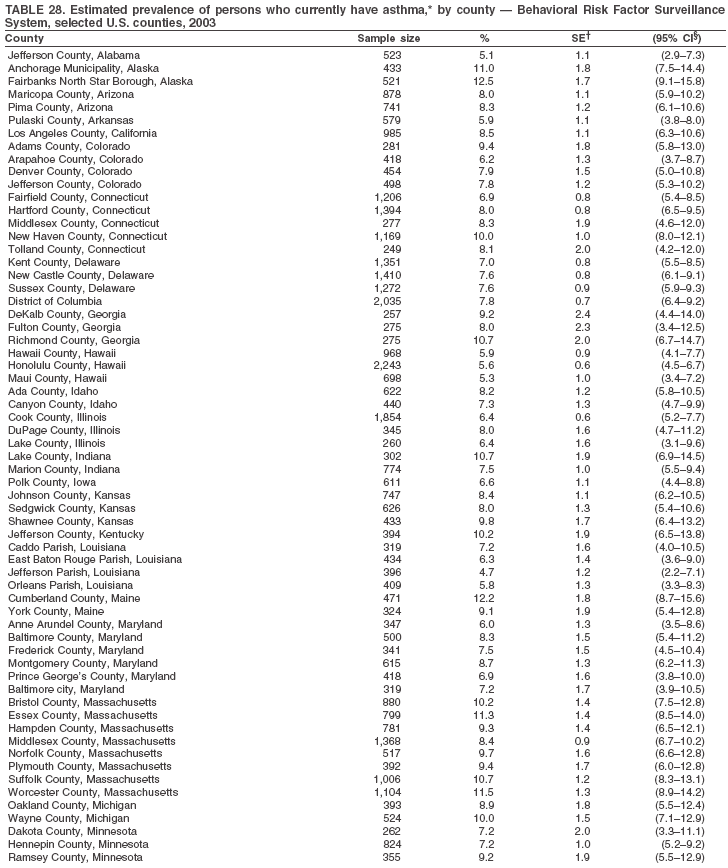
 Return to top. Table 29 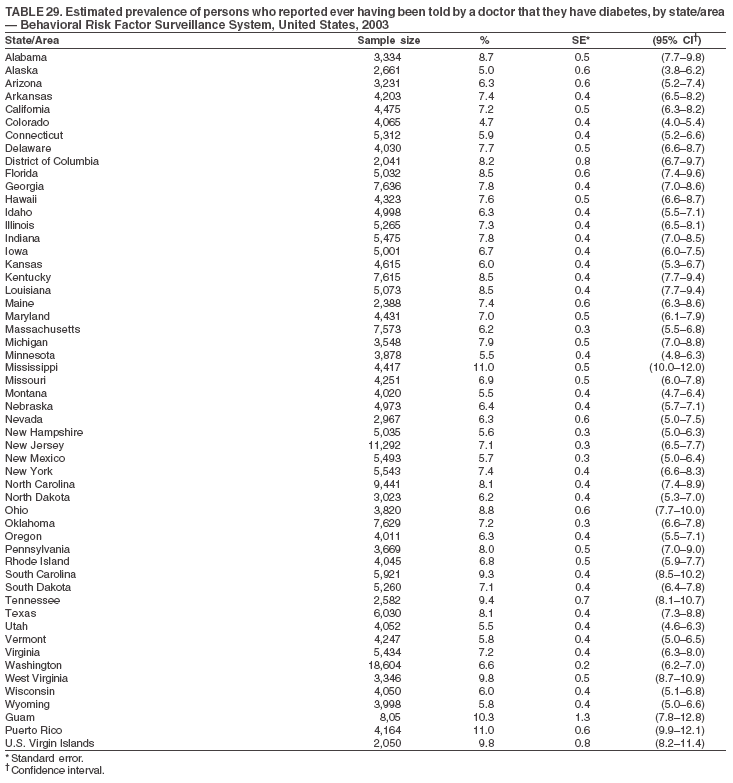 Return to top. Table 30 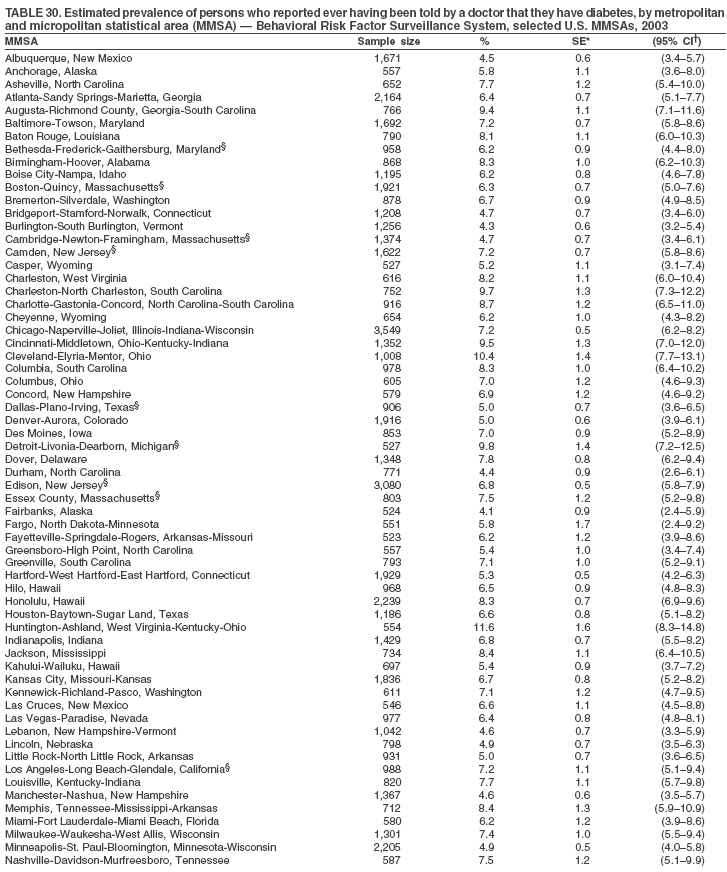
 Return to top. Table 31 
 Return to top. Table 32 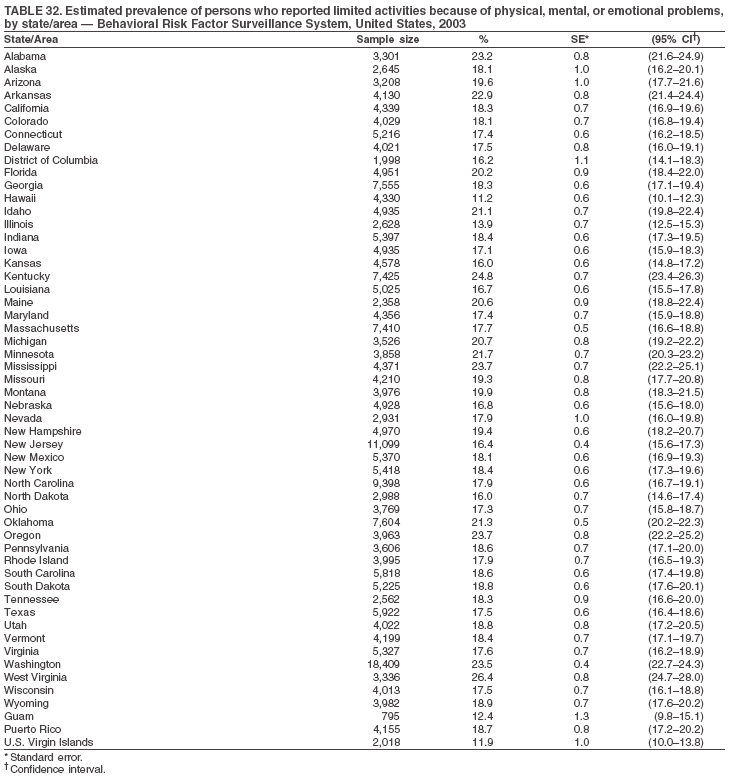 Return to top. Table 33 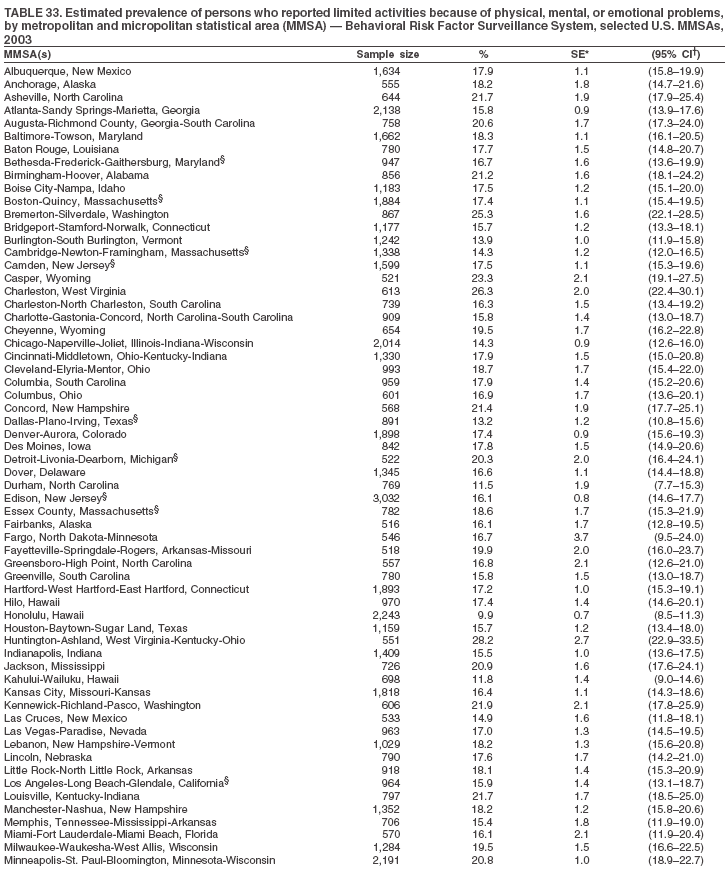
 Return to top. Table 34 
 Return to top. Table 35 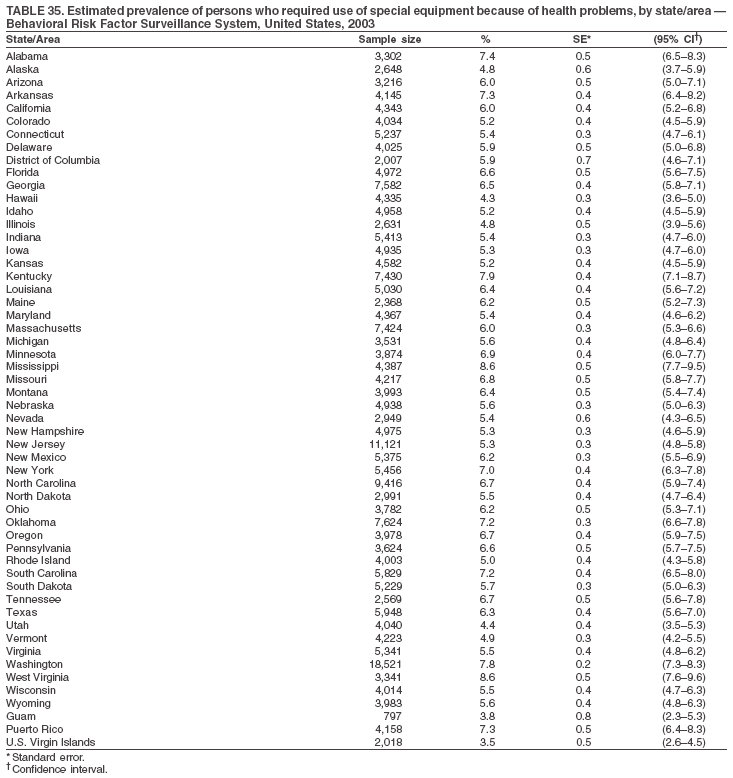 Return to top. Table 36 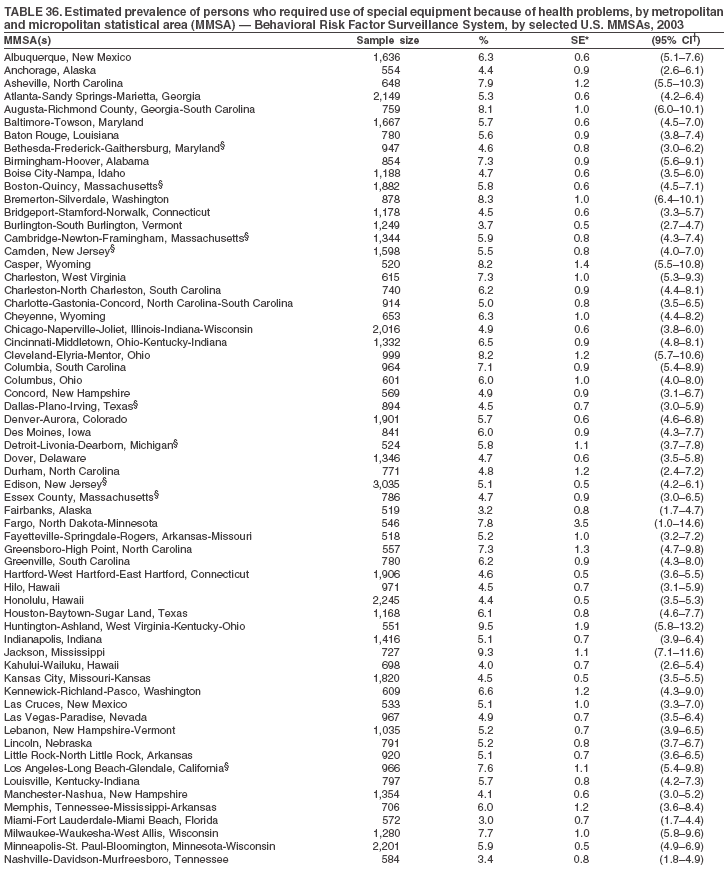
 Return to top. Table 37 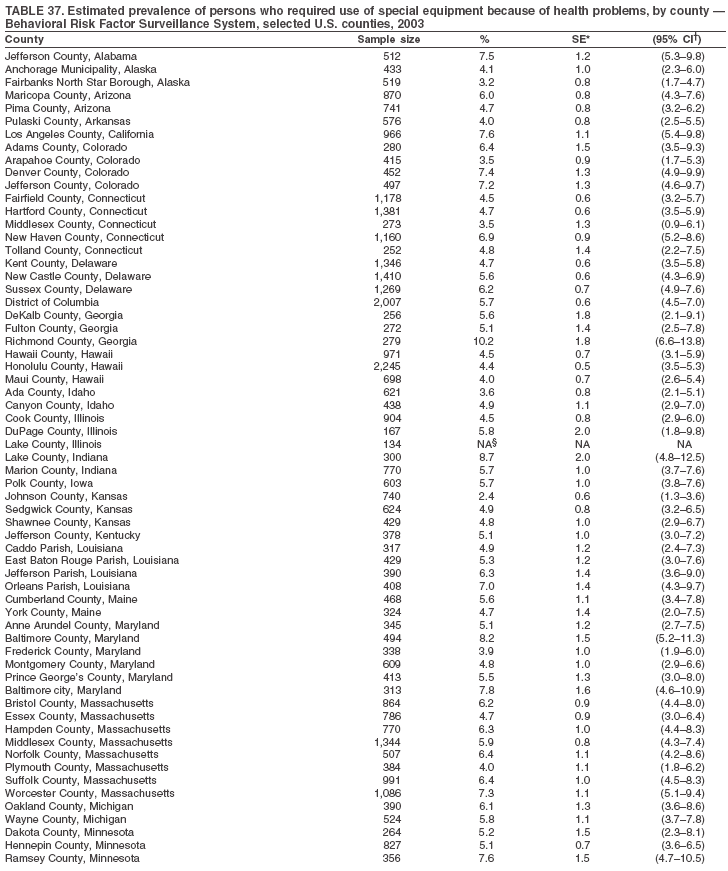

 Return to top. Table 38 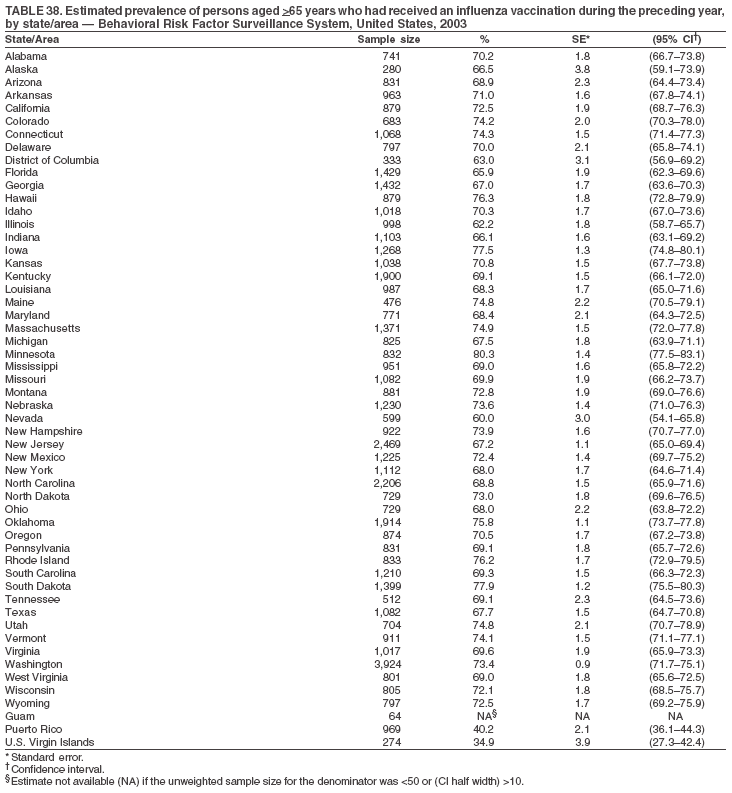 Return to top. Table 39 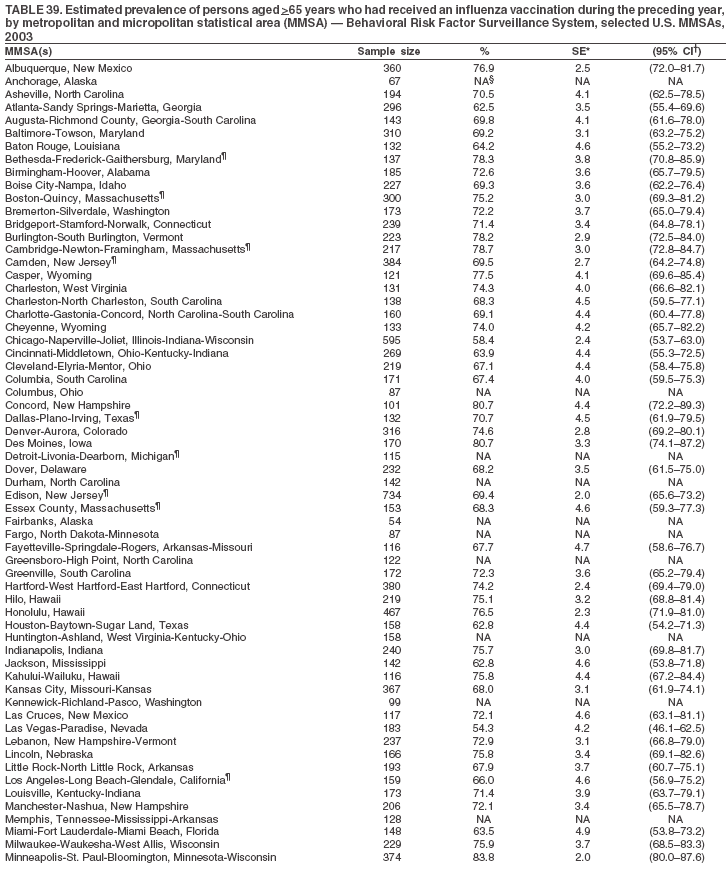
 Return to top. Table 40 
 Return to top. Table 41 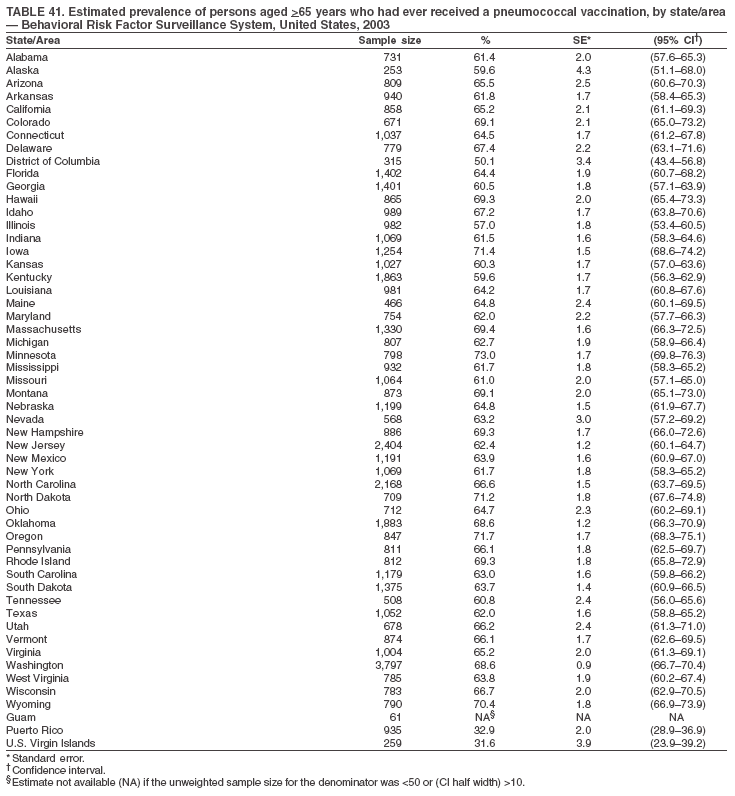 Return to top. Table 42 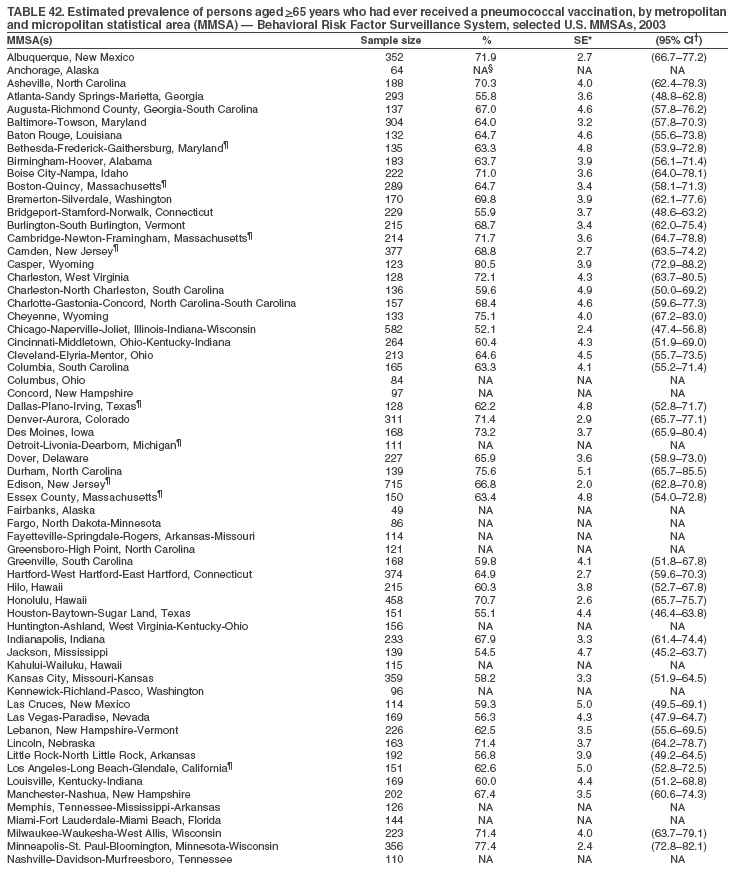
 Return to top. Table 43 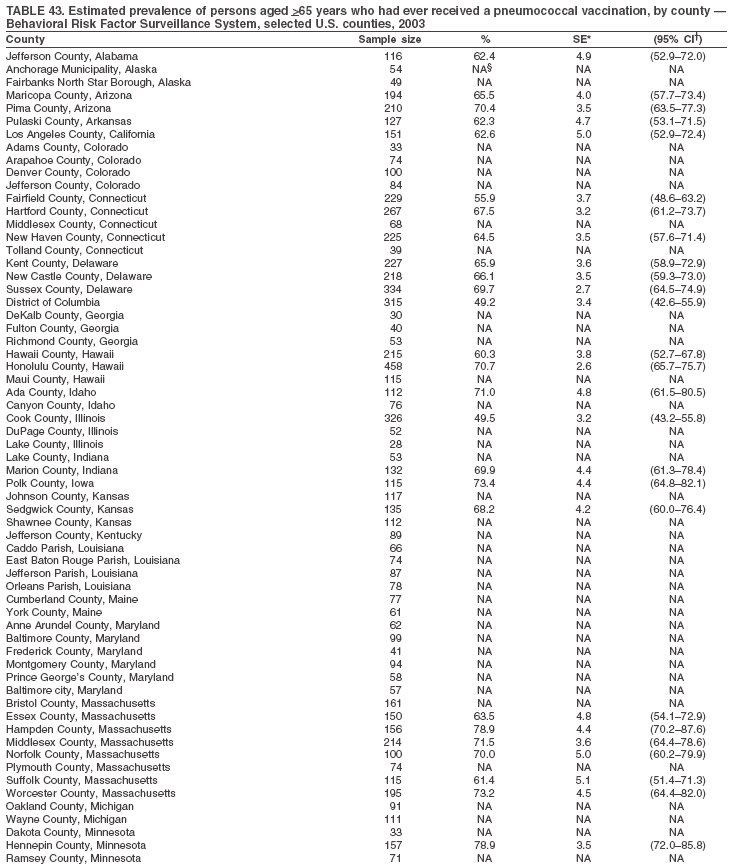
 Return to top. Table 44 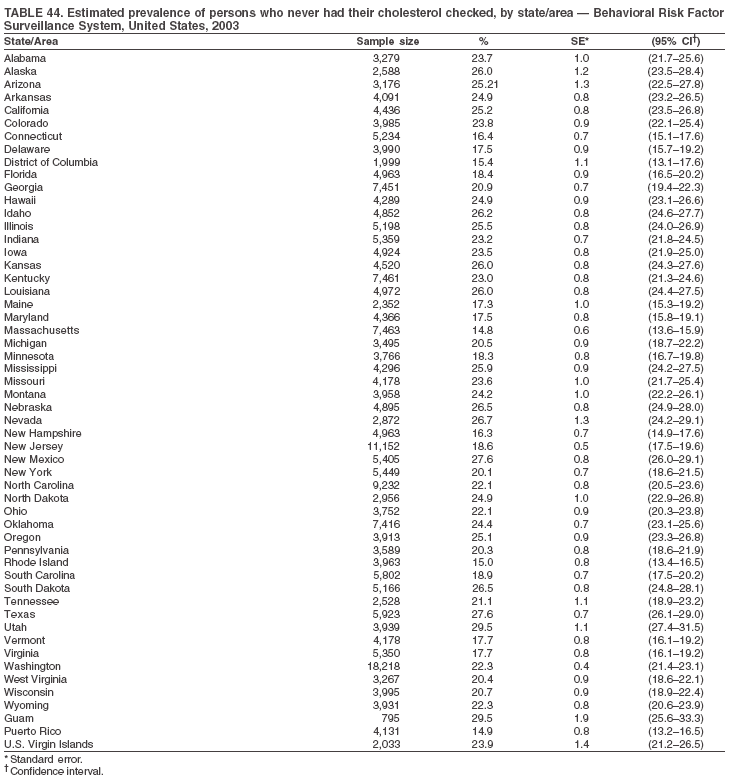 Return to top. Table 45 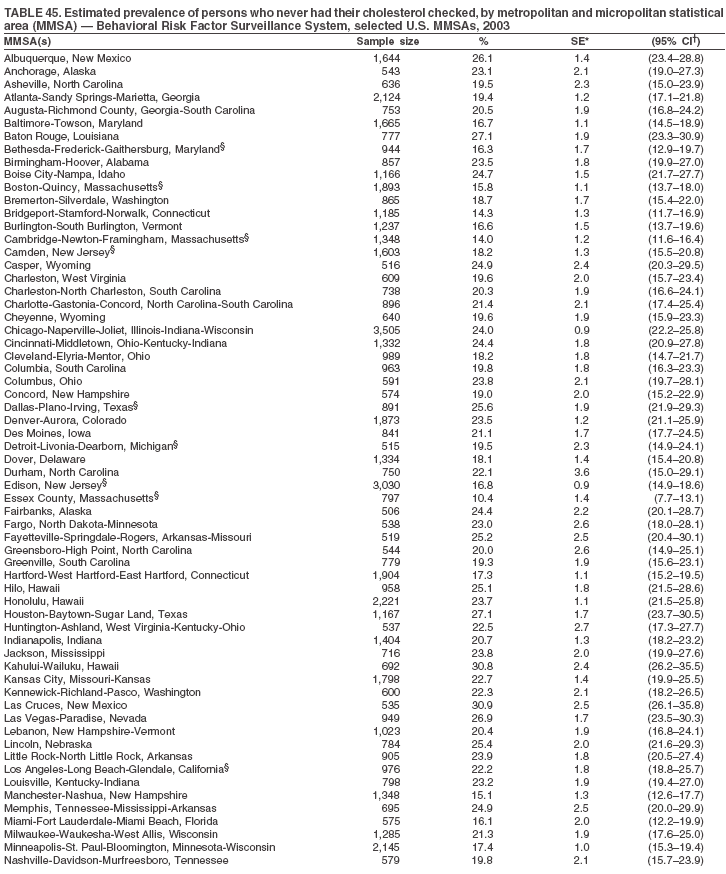
 Return to top. Table 46 
 Return to top. Table 47 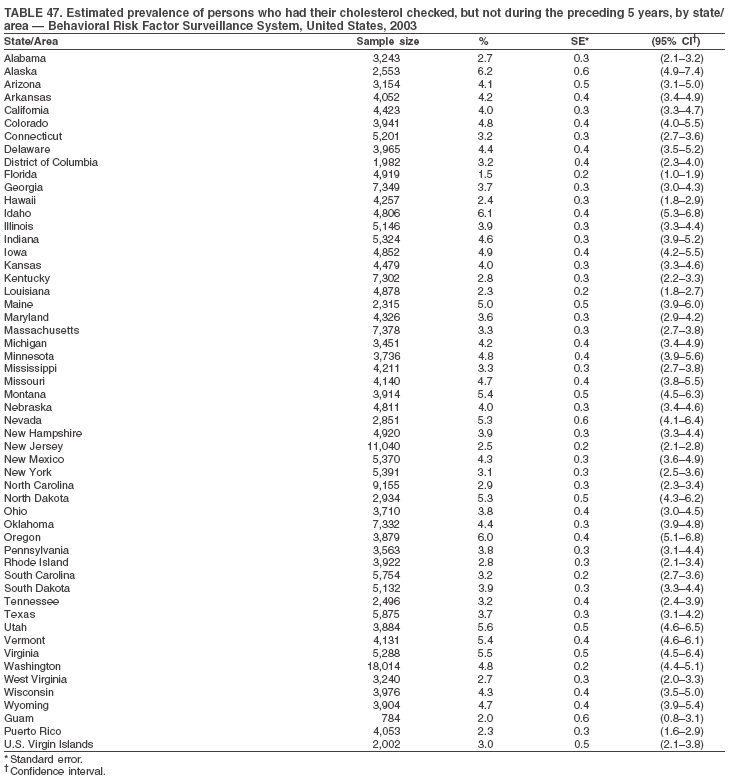 Return to top. Table 48 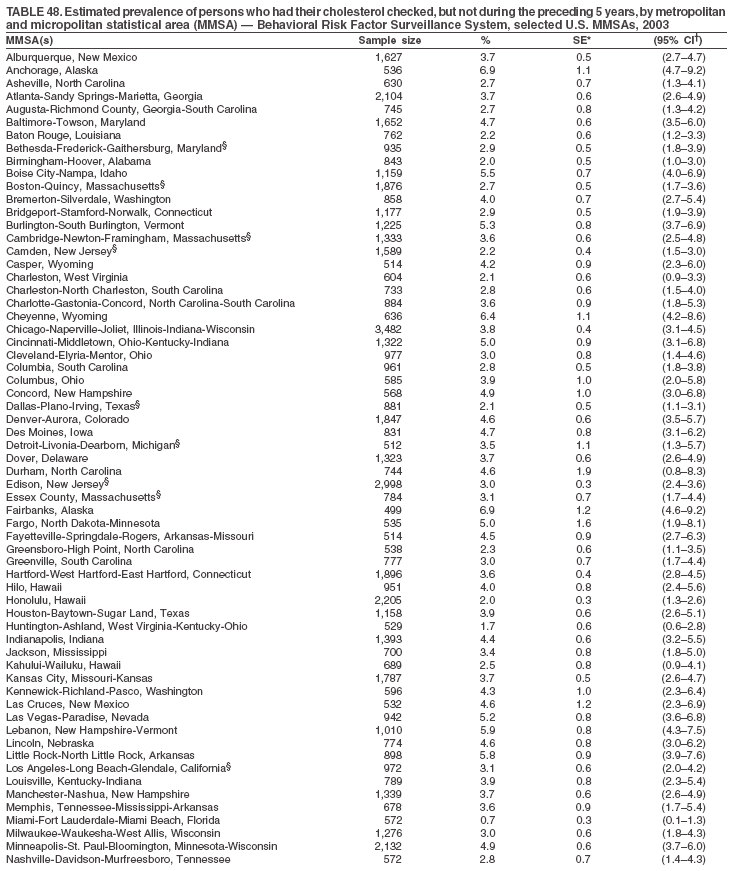
 Return to top. Table 49 
 Return to top. Table 50 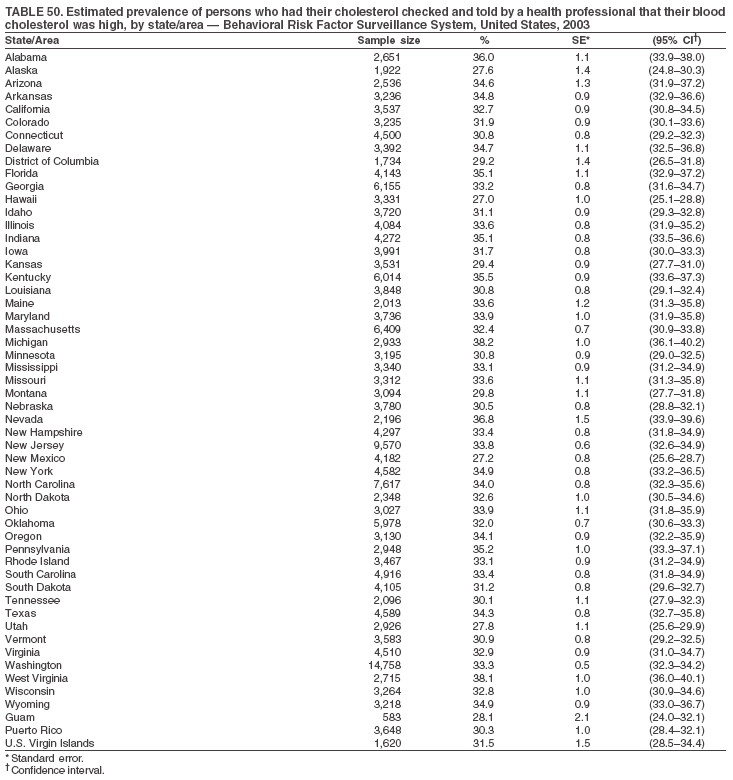 Return to top. Table 51 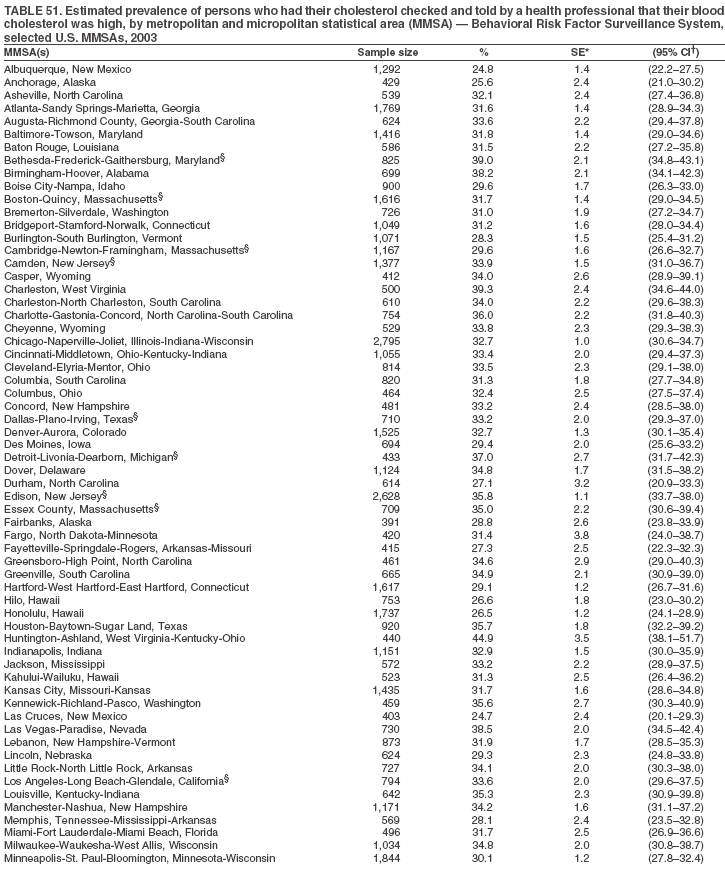
 Return to top. Table 52 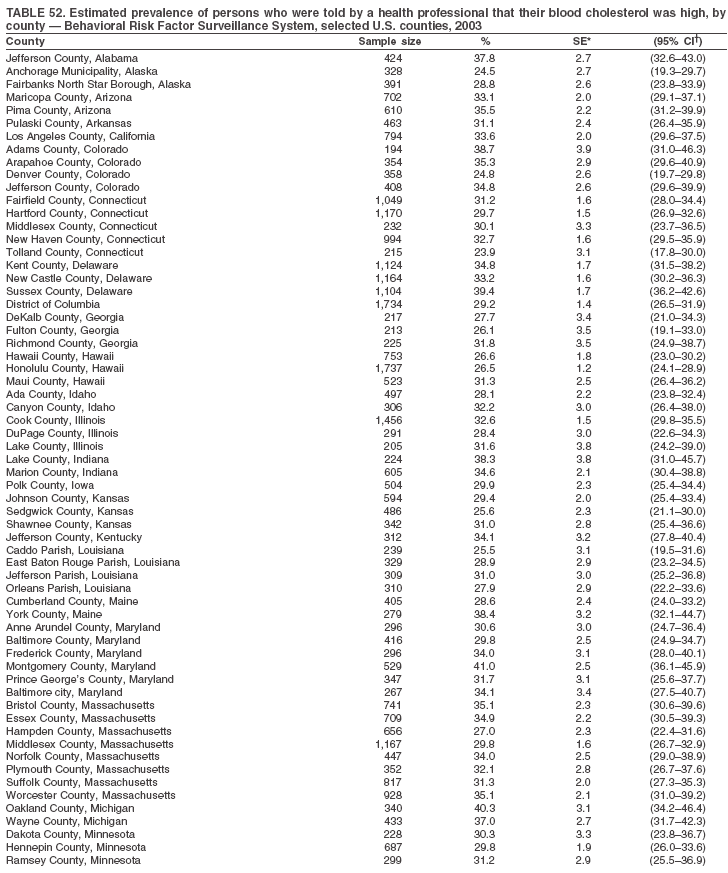

 Return to top. Table 53 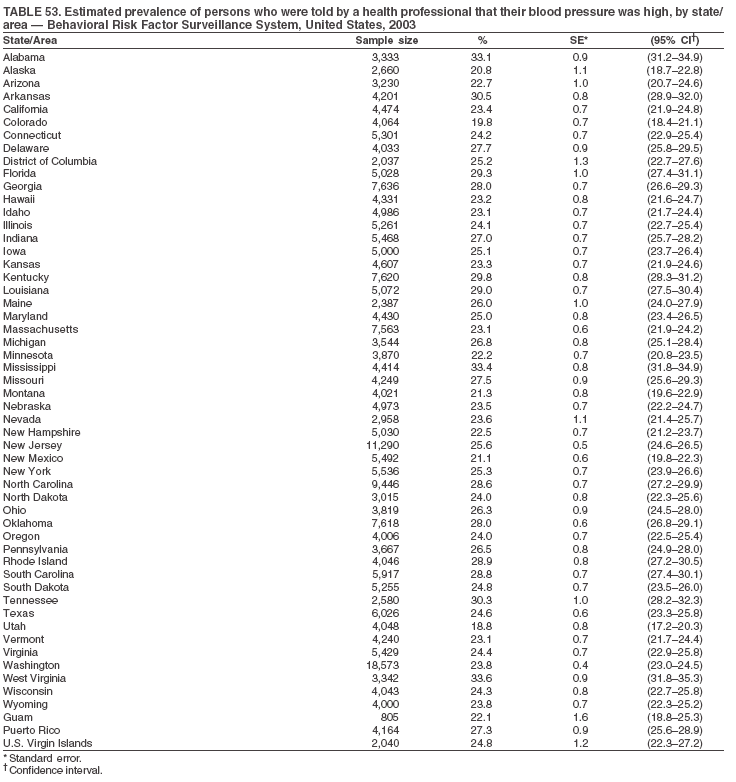 Return to top. Table 54 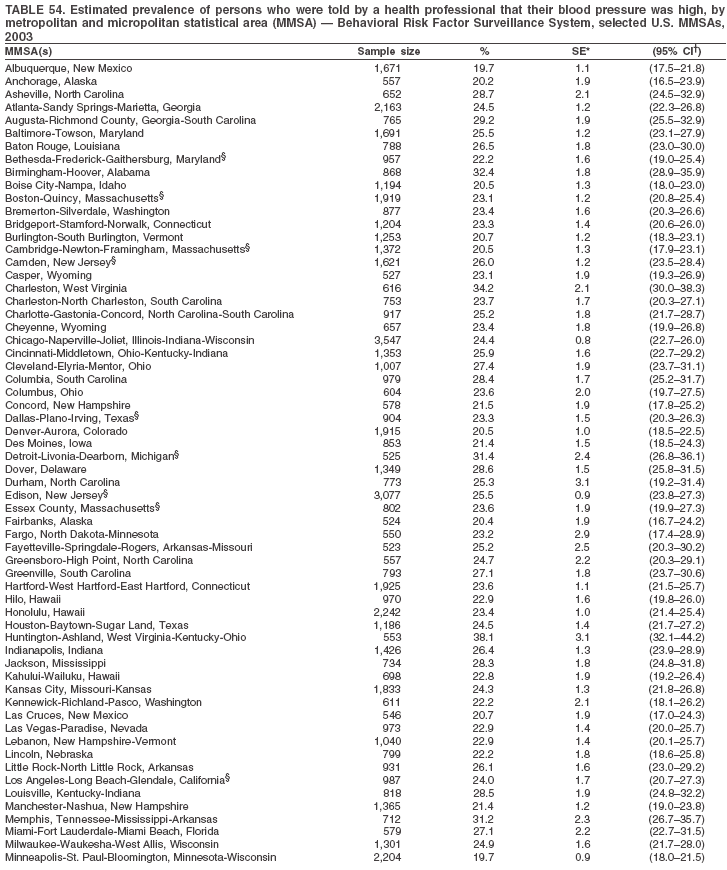
 Return to top. Table 55 
 Return to top.
Disclaimer All MMWR HTML versions of articles are electronic conversions from ASCII text into HTML. This conversion may have resulted in character translation or format errors in the HTML version. Users should not rely on this HTML document, but are referred to the electronic PDF version and/or the original MMWR paper copy for the official text, figures, and tables. An original paper copy of this issue can be obtained from the Superintendent of Documents, U.S. Government Printing Office (GPO), Washington, DC 20402-9371; telephone: (202) 512-1800. Contact GPO for current prices. **Questions or messages regarding errors in formatting should be addressed to mmwrq@cdc.gov.Date last reviewed: 11/22/2005 |
|||||||||
|