 |
|
|
|
|
|
|
| ||||||||||
|
|
|
|
|
|
|
||||
| ||||||||||
|
|
|
|
|
Persons using assistive technology might not be able to fully access information in this file. For assistance, please send e-mail to: mmwrq@cdc.gov. Type 508 Accommodation and the title of the report in the subject line of e-mail. Contraceptive Use --- United States and Territories, Behavioral Risk Factor Surveillance System, 2002Please note: An erratum has been published for this article. To view the erratum, please click here. Diana M. Bensyl, PhD,1 A. Danielle Iuliano,
MPH,2 Marion Carter, PhD,3 John Santelli,
MD,4 Brenda Colley Gilbert, PhD1
The material in this report originated in the National Center for Chronic Disease Prevention and Health Promotion, Janet L. Collins, MD, Director; and the Division of Reproductive Health, John Lehnherr, Acting Director. Corresponding author: Diana M. Bensyl, PhD, Office of Workforce and Career Development, 1600 Clifton Rd, MS E-92, Atlanta, GA 30333. Telephone: 404-498-6153; Fax: 404-498-6355; E-mail: dbensyl@cdc.gov. AbstractProblem: Contraceptive use is an important determinant of unintended pregnancy. In the United States, approximately half of all pregnancies are unintended. Population-based information about contraceptive use patterns is limited at the state level. Information about contraceptive use for states can be used to guide the development of state programs and policies to decrease unintended pregnancy and the spread of sexually transmitted infections. Information about contraceptive use for specific subpopulations can be used to further refine state efforts to improve contraceptive use and subsequently decrease the occurrence of unintended pregnancy. Reporting Period: Data were collected in 2002 for men and women. Description of System: The Behavioral Risk Factor Surveillance System (BRFSS) is a random-digit--dialed, telephone survey of the noninstitutionalized U.S. population aged >18 years. All 50 states, the District of Columbia, Guam, the Commonwealth of Puerto Rico, and the U.S. Virgin Islands participated in BRFSS in 2002. These data can be used to track state progress towards the national health objectives for 2010 for responsible sexual behavior. The 2002 BRFSS data represent the first time state data on contraceptive use in all 50 states will be presented and examined by selected sociodemographic characteristics. The 2002 BRFSS also, for the first time, provided an opportunity to examine state-level contraceptive use patterns among men. Results: Variation across states and territories was observed for the majority of contraceptive methods among the different demographics analyzed and among men and women. The percentage of men and women at risk for pregnancy who said they or their partner was using birth control was high overall and ranged from 67% (Guam) to 88% (Idaho). Oral contraceptives (i.e., the pill), vasectomy, tubal ligation, and condoms were the methods most frequently reported by both male and female respondents who said they or their partner was using birth control. Among female respondents using birth control, the pill was the most common method reported. Among men, vasectomy was the most commonly reported method. The prevalence of use for the four most commonly reported methods (pills, vasectomy, tubal ligation, condoms) varied as much as six-fold among states for vasectomy and three- to four-fold for condoms, pills, and tubal ligation. Interpretation: The findings in this report document substantial differences among states and sociodemographic groups within states in contraceptive method use. Public Health Action: These data can help states identify populations with an unmet need for birth control, barriers to birth control use, and gaps in the range of birth control methods offered by health-care providers. An analysis of the prevalence of birth control use by state and selected population characteristics can help states target contraceptive programs to best meet the needs of their population. IntroductionIn the United States, approximately 49% of all pregnancies and 30% of live births in 1994 were unintended, either mistimed or unwanted, at the time of pregnancy (1). Unintended pregnancies are associated with poor maternal-child health outcomes and behaviors such as smoking and drinking during pregnancy, delayed prenatal care, and low birthweight (2). As a result, the reduction of unintended pregnancies is one of the family planning objectives of the national health objectives for 2010 (3). Specifically, the objective is to increase the proportion of pregnancies that are intended to 70%. Another objective is to increase the proportion of females at risk for unintended pregnancy (and their partners) who use contraception to 100%. Consistent use of effective birth control methods is the primary strategy for preventing unintended pregnancies among sexually active persons. Patterns of contraceptive use by state reflect the availability of publicly supported reproductive health services, preferences of women and health-care providers, and willingness of insurers to cover specific methods. Eliminating barriers to access and to effective use of contraception will help meet the health objectives for 2010. This report summarizes data from the 2002 Behavioral Risk Factor Surveillance System (BRFSS) survey, the first survey to provide population-based information for all states and territories about birth control use for the prevention of pregnancy among both women and men of reproductive age. BRFSS is the only population-based data source that provides basic information for comparing birth control use among states and for informing state-level policy and program development. The National Survey of Family Growth provides more detailed estimates of birth control use and related reproductive health issues on a national and regional level (4). This report focuses on the prevalence of birth control use for those reporting the following five methods: the pill, condoms, tubal ligation, vasectomy, and injectable contraceptives (e.g., Depo-Provera ["the shot"]). These methods account for 83%--93% of birth control use for men and 84%--95% of birth control use for women. MethodsBRFSS comprises population-based telephone surveys administered annually in all 50 U.S. states and four territories among men and women aged >18 years, to collect surveillance data about a range of health behaviors and risk factors; the survey is administered in English and other languages where appropriate and feasible (5). No data are reported where sample sizes for demographic characteristics and method choice are <50. In 2002, the overall response rates for the states ranged from 25% to 79% (median: 45%), and cooperation rates among eligible respondents who were reached ranged from 63% to 99% (77%). All data are presented for each state by sex. To facilitate comparison with later years of BRFSS data on birth control use, data on the use of individual birth control methods are based on the first method mentioned by the respondent, and use of more than one method is not included in this report. The prevalence of each method's use changes little when respondents were categorized by their most effective method rather than the method they mentioned first. Approximately 14% of all respondents reported using more than one method. QuestionnaireRespondents of reproductive age (i.e., women aged 18--44 years and men aged 18--59 years) were asked whether they or their usual partner were doing anything to prevent pregnancy. Those who answered yes were asked what method they or their usual partner was using. Those who answered that they were not doing anything to prevent pregnancy were asked to specify the main reason for not doing so. Survey Questions
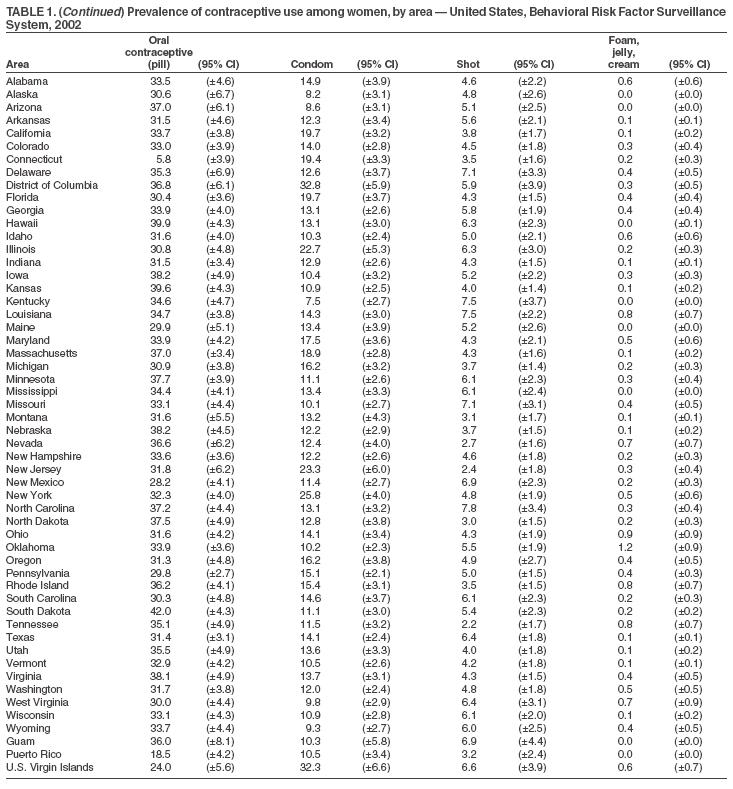
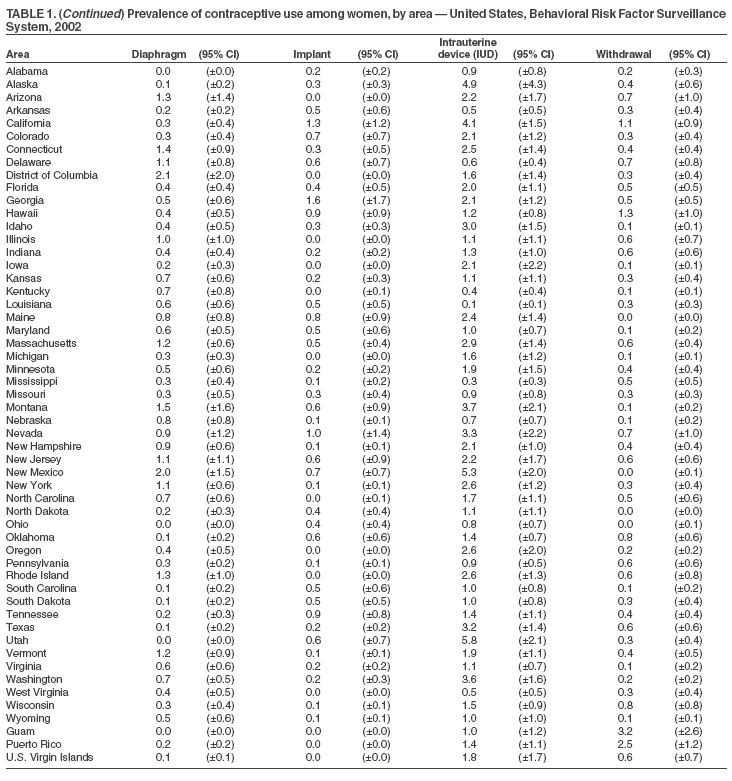
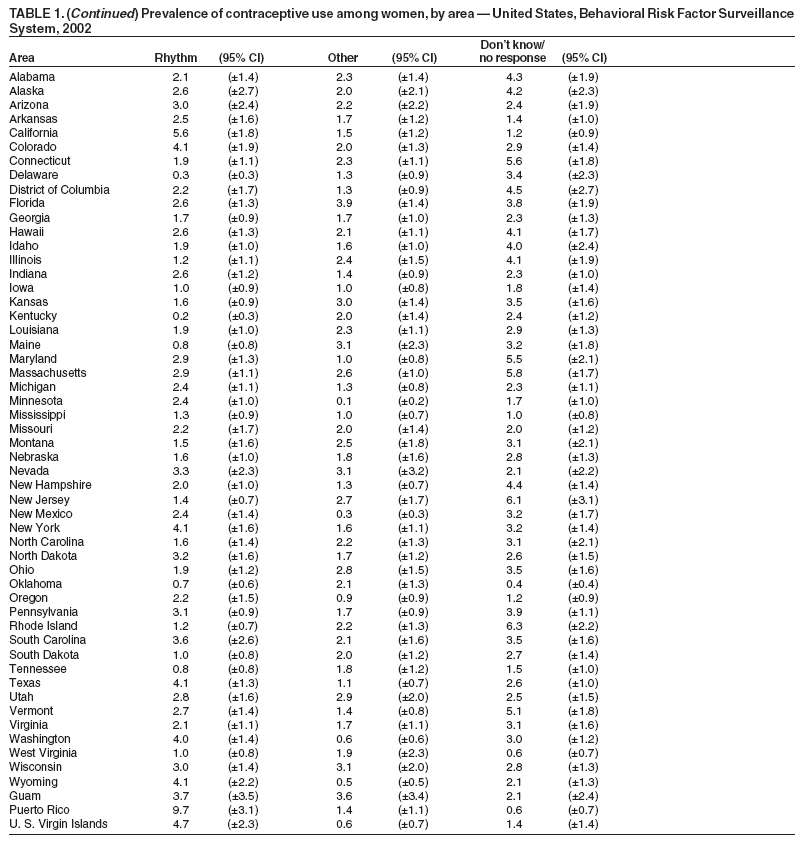
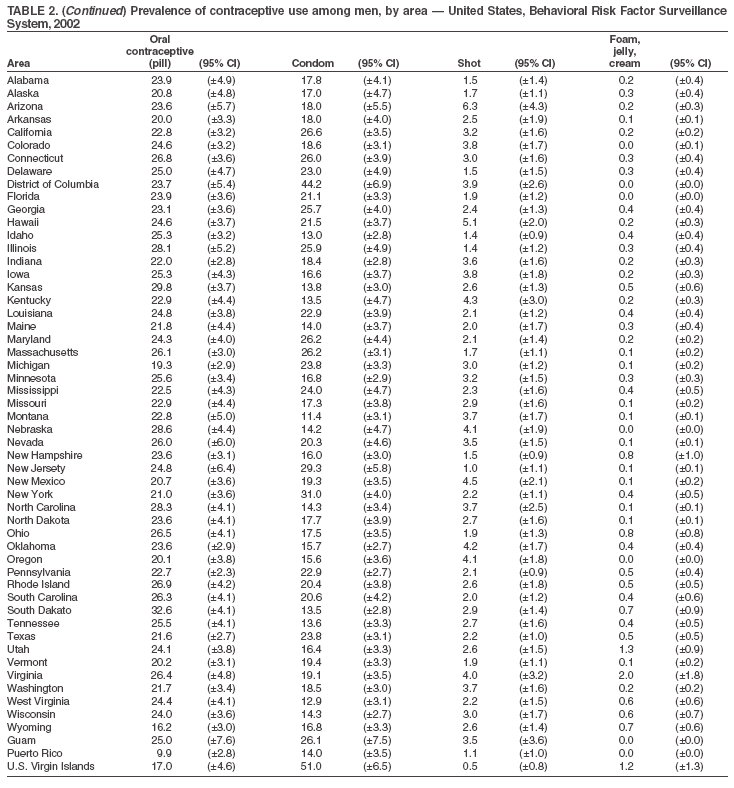
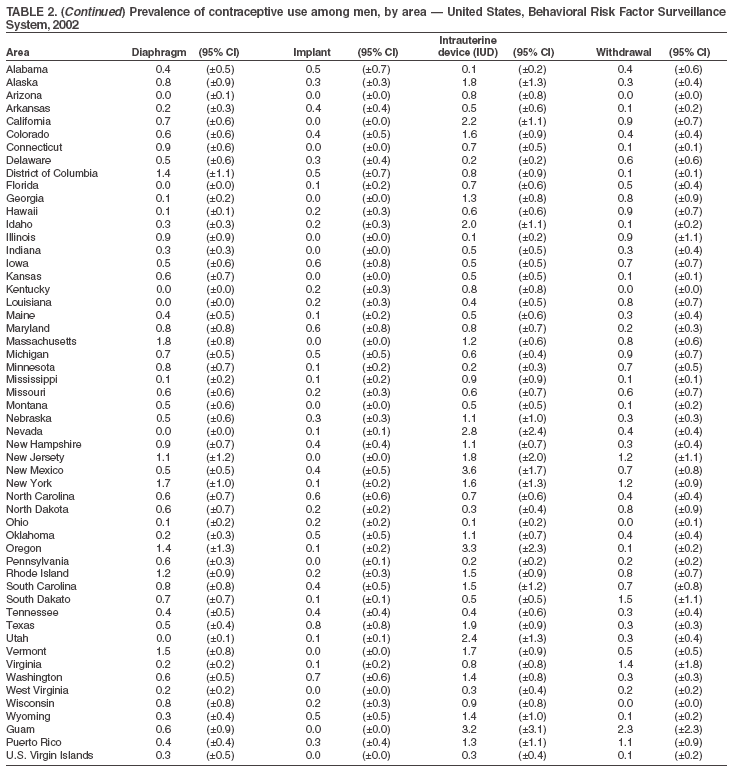
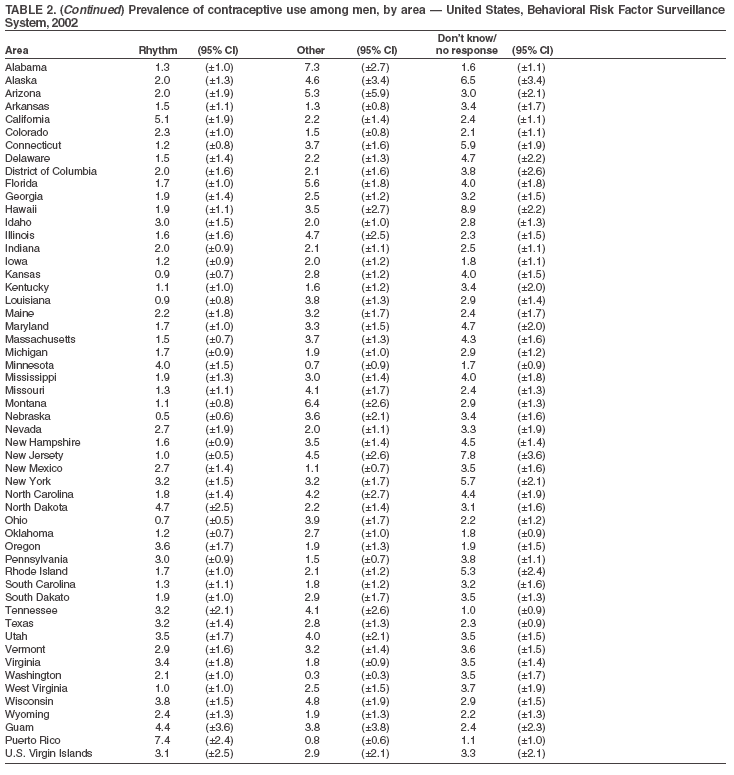
Data CodingFor this analysis, the focus was on the contraceptive practices of men and women of reproductive age considered to be at-risk for pregnancy. To identify men and women who were at-risk for pregnancy, persons who reported low-risk behaviors or biologic reasons that indicated they were not at risk for pregnancy were excluded from the analyses. The not at risk group included persons who reported that they or their partner were pregnant, had a hysterectomy, were not sexually active, were too old to become pregnant, or were the same sex. Because respondents could report methods under question two (i.e., method using to prevent pregnancy) or as a reason for not using a method under question three (i.e., reason for nonuse=hysterectomy), new variables that reflected use of specific methods regardless of how they were reported were created. The created variables were developed from the original birth-control questions and additional questions relating to hysterectomy and current pregnancy. These created variables were generated to facilitate analysis of these variables because of the complexity of the responses and the need to combine multiple variables to obtain the prevalence estimates. Response patterns in the original birth-control questions were complicated and interrelated; therefore, it was important to examine the entire set of questions to report method use correctly. Three variables were created: any use of birth control, first mentioned method type, and reason for nonuse among men and women of reproductive age. To identify users, data from questions 1, 2, and 3 were needed. For example, certain persons who responded that they were not doing anything to prevent pregnancy subsequently indicated in the reason for not doing anything that they or their partner had a tubal ligation or had a vasectomy. Others responded that they were doing something to prevent pregnancy, then indicated in type of method that they did not have a partner or were not sexually active. These respondents were categorized as not at risk for pregnancy and as nonusers of birth control. To describe the reasons for nonuse of birth control, data from all five questions were used. Respondents who did not use birth control because they said they were not sexually active were identified in the first three questions. Respondents who did not use birth control because they said they had a same-sex partner were identified in questions 2 and 3. Respondents who did not use birth control because they said that they or their partner was pregnant were identified in questions 3 and 5. Respondents who did not use birth control because they indicated that they or their partner had a hysterectomy were identified in questions 3 and 4. Reasons for nonuse were self-reported and include self-assessments of the respondents' fertility. For example, a respondent who reported that she did not use birth control because "they can not get pregnant" might be physiologically sterile from previous treatment for cancer, or she might be fertile but have a false perception of her true risk for pregnancy. The 2002 BRFSS had 148,702 female respondents; 65,597 responded to the family-planning questions. Of these, 61,525 (94%) answered the first contraceptive use question, 1,741 (3%) didn't know or refused to respond, 1,416 (2%) were excluded because they did not meet the reproductive age criteria, and 915 (1%) were improperly skipped/not asked the question. The remaining 57,453 women with valid responses were then examined to determine their at risk for pregnancy status. An additional 9,549 (14%) were excluded because they reported that they were not sexually active, 4,128 (5%) were excluded because they reported having had a hysterectomy, 2,693 (5%) were excluded because they reported that they were pregnant, 362 (1%) were excluded because they reported a same-sex partner, and 99 (1%) were excluded because they believed themselves or their partners too old to become pregnant. After the exclusions, a total of 44,694 women respondents were considered to be at-risk for pregnancy and included in the analyses. The 2002 BRFSS had 99,262 male respondents; 74,764 responded to the family-planning questions. A total of 70,784 (93%) men answered the first contraceptive question, 2,852 (3%) didn't know or refused to respond, 523 (1%) did not meet the age criteria, and 1,128 (3%) were improperly skipped/not asked. The same criterion that was used to define the at-risk subgroup for women was used to define the at-risk subgroup for men. Of the 93% of men that responded to the contraceptive questions, 14,717 (20%) were excluded because they reported that they were not sexually active, 2,478 (3%) were excluded because they reported that their partner had a hysterectomy, 940 (1%) were excluded because they reported that their partner was pregnant, 587 (1%) were excluded because they reported a same-sex partner, and 2,556 (3%) were excluded because they believed themselves or their partners to be too old to get pregnant. After the exclusions, a total of 48,983 men were considered to be at risk for pregnancy and included in the final analyses. Prevalence data are presented by state for all reported methods used (Tables 1 and 2) and for nonuse as an aggregate for men and women (Table 3). Data are also presented by selected respondent characteristics for each state and sex for those respondents who are contraceptive users (Tables 4--57). Only the five most commonly reported methods are included. Selected respondent characteristics include age group (18--24, 25--34, 35--44, and 45--59 years), race/ethnicity (white, black, Hispanic, Asian/Pacific Islander, American Indian/Alaska Native, and other), employment status (employed or unemployed), marital status (married, separated/divorced/widowed, and single), education (less than high school, high school degree, and more than high school), health insurance (insured or not insured), and children at home (yes or no). Data Collection and AnalysisBRFSS data are collected monthly by each state and sent to CDC, which then prepares the data for analysis by applying weights by using the probability of being selected and the census estimates for age, race/ethnicity, and sex for each state. SUDAAN® (Survey Data Analysis) software was used for data analysis to account for the complex sampling design. Relations in the data were identified by using 95% confidence intervals for the prevalence estimates. ResultsTotal Prevalence and Prevalence of Nonuse by StateWomen The percentage of women at risk for pregnancy who said they or their partner were using some method of birth control was high overall and ranged from 67% (Guam) to 88% (Idaho). The prevalence of birth control use exceeded 80% in 44 of 54 states (median prevalence: 84%). Among female respondents who said they or their partner were using birth control, the pill was the most common method reported in 49 of 54 states. Approximately one third of female users in the majority of areas reported using this method, although the estimated percentage ranged from 19% (Puerto Rico) to 42% (South Dakota) (Table 1). Tubal ligation was also commonly reported by women and ranged from 11% (District of Columbia) to 46% (Puerto Rico); this method was the most common in four states. Condom and vasectomy were the methods next most commonly reported by women. Among birth control users, condom use ranged from 8% (Kentucky) to 33% (District of Columbia) and was the most common method in one territory (U.S. Virgin Islands). Vasectomy did not rank first in any area and ranged from 2% (District of Columbia) to 23% (Idaho). Injectable birth control (e.g., Depo Provera) was most frequently reported by women in North Carolina (8%) and least frequently in Tennessee (2%). Prevalence of the use of an Intra-Uterine Device (IUD) ranged from 6% in Utah to <1% in Mississippi. Prevalence of the use of foam, jelly, or cream, diaphragms, and implants did not exceed 2% for any state. The prevalence of the rhythm method was highest in Puerto Rico (10%) and lowest in Kentucky (<1%). Prevalence of withdrawal ranged from 3% in Guam and zero in four states (Maine, New Mexico, North Dakota, and Ohio). Use of other methods did not exceed 4%, and those who did not know or did not respond ranged from 6% (Rhode Island) to <1% (Oklahoma). Men Among men, the prevalence of some method of birth control use ranged from 68% (New Jersey) to 86% (Idaho) (Tables 1 and 2). For men, prevalence of birth control exceeded 80% in 28 of 54 states. Tubal ligation, vasectomy, the pill, and condoms were the methods most frequently reported by men who said they or their partner was using birth control (Table 2). However, compared with women, the most common method reported by men varied across states. Vasectomy was most common in 17 states and was highest in Oregon (31%) and lowest in the U.S. Virgin Islands (5%). Pill use had the highest prevalence in 15 states, ranging from 33% in South Dakota to 10% in Puerto Rico. Tubal ligation was the most common method used in 12 states, ranging from 55% in Puerto Rico (55%) to 12% in the District of Columbia. Condom use was highest in the U.S. Virgin Islands (51%) and lowest in Montana (11%) and was the most common method in 10 states. Injectable birth control was most frequently reported by men in Arizona (6%) and least frequently in the U.S. Virgin Islands (<1%). Prevalence of the use of IUD ranged from 4% in New Mexico to <1% in Alabama. Prevalence of the use of foam, jelly, or cream, diaphragms, and implants did not exceed 2% for any state. The prevalence of the rhythm method was highest in Puerto Rico (7%) and lowest in Nebraska (<1%). Prevalence of withdrawal ranged from 2% in Guam and zero in four states (Arizona, Kentucky, Ohio, and Wisconsin). Use of other methods was highest in Alabama (7%). Hawaii had the highest prevalence for those who did not know or did not respond (9%). Among women and men at risk for pregnancy, the most common reason given for not using birth control was that they or their partner wanted to get pregnant (33% and 23%, respectively) (Table 3). Others not using birth control were likely to be at risk for unintended pregnancy. For example, 6% of women said they were not using birth control because they or their partner did not want, or like, to do so (Table 3). Substantial percentages of both men (14%) and women (9%) reported they were not using birth control because they did not think they or their partner could become pregnant. The proportion of those who were physiologically infertile is unknown. Data by Selected CharacteristicsWomen Although the shot had the next highest prevalence of use following pills, tubal ligation, vasectomy, and condoms, it was never the most prevalent method for any state. Therefore, prevalence data are not discussed in detail in the results. In all but one state, birth control pill use was highest among those aged 18--24 years. Prevalence of pill use among this group ranged from 72% (Kansas) to 39% (New Jersey). In New Jersey, persons aged 18--24 years reported condoms (44%) as the most common method. Among those aged 25--34 years, the pill was also the most common method reported. However, for certain areas, condoms (District of Columbia) or tubal ligation (Mississippi, South Carolina, West Virginia, Wyoming, and Puerto Rico) were more commonly reported. Women aged 35--44 years reported tubal ligation or vasectomy as the most common method, except in the District of Columbia, where condoms were the most commonly reported method. As a result of small sample size in certain states for specific racial/ethnic populations, data are not reported for every state. Data for white women were available for all states except Guam, Puerto Rico and U.S. Virgin Islands. White women most commonly reported using the pill, except in Kentucky, Tennessee, and West Virginia, where tubal ligation was reported more often. Prevalence of pill use ranged from 50% (District of Columbia) to 29% (New Mexico). Twenty-four states had adequate sample size for black women; methods of contraception varied more for black women than white women. Tubal ligation was the most commonly reported method (15 states), followed by condoms (five states) and the pill (four states). Hispanic women in 16 states reported most commonly using tubal ligation (eight states), followed by the pill (seven) and condoms (one). Only a few states had adequate sample size to examine other racial/ethnic populations: Asian/Pacific Islander (California, Hawaii, New Jersey, and Guam), American Indian/Alaska Native (Alaska, Montana, and Oklahoma) and other (Hawaii). In California, Hawaii, Guam, and Alaska, these groups most commonly reported pill use. Montana and Oklahoma most commonly reported tubal ligation and New Jersey reported condom use. Among employed women, the birth control pill was the most reported method; prevalence ranged from 48% (Guam) to 21% (Puerto Rico). However, in Mississippi, New Mexico, South Carolina, West Virginia, and Puerto Rico, tubal ligation was more commonly reported. In the District of Columbia, condoms were more commonly reported (39%). The unemployed category in this survey included students, homemakers, retirees, and those who were disabled. For those reporting unemployment, pill use was the most common method except in Alabama, Kentucky, Tennessee, Texas, West Virginia, Guam, and Puerto Rico, where tubal ligation was most common. In Illinois, New Jersey, and the U.S. Virgin Islands, condoms were most commonly reported. In Washington, vasectomy was the most common method reported by unemployed women. The two most commonly reported methods used by married women for pregnancy prevention were the pill (24 states) and tubal ligation (22). Vasectomy was the most common method reported for Idaho, Michigan, New Hampshire, Oregon, Vermont, Washington, and Wisconsin. In Arkansas, pill use and tubal ligation had the same prevalence (30%). In all states with adequate sample size, women who were separated, divorced, or widowed reported tubal ligation as the most common method of birth control, except in Idaho, Kansas, New Jersey, and Wyoming, where pill use was more common. For single women, pill use was the most common method except in Puerto Rico, where tubal ligation was more prevalent (32%), and the U.S. Virgin Islands, where condom use was more prevalent (47%). Certain states had sample sizes too small to include for those with less than a high school education, reflecting higher educational attainment in those states. For 15 of the 18 areas with adequate sample size, tubal ligation was the most common method reported by women with less than a high school education. Two states reported pill use and one state reported condoms as the most common method. For those with a high school education, the most common reported method was tubal ligation (37 states) followed by the pill (13). Condoms had the highest prevalence for pregnancy prevention in the District of Columbia (30%) and vasectomy had the highest prevalence in Washington (31%). For persons with more than a high school education, the majority reported pill use as the most common pregnancy prevention method except in Puerto Rico, where tubal ligation was most prevalent (40%) and the U.S. Virgin Islands, where condom use was the most prevalent method (29%). Women with health insurance in 51 areas reported using the pill as their method of birth control. In West Virginia, Puerto Rico, and the U.S. Virgin Islands, tubal ligation had the highest prevalence among those with insurance. For those without insurance, pill use was reported most often (24 states). However, tubal ligation (19 states) was also common. In addition, condom use was most prevalent for five states. For those with children at home, pill use was the most prevalent method of birth control. For those without children at home, tubal ligation was the most prevalent method (31 states), followed by pill use (17), vasectomy (four), and condoms (two). Men Injectable birth control had the next highest prevalence of use after pills, tubal ligation, vasectomy, and condoms. However, it was never the most prevalent method for any state. Men reported use of contraceptives for themselves or their usual partner. Among men, condom use had the highest prevalence among those aged 18--24 years, and use ranged from 64% in New Jersey to 21% in Oregon. Pill use was the next most common method. Prevalence of pill use ranged from 67% (Nevada) to 18% (Mississippi). Among those aged 25--34 years, pills were the most common method reported (46 states). However, for certain areas, condoms (seven states) or tubal ligation (Puerto Rico) were more commonly reported. Men aged 35--44 years reported tubal ligation or vasectomy as the most common method, except in the District of Columbia, Illinois, and the U.S. Virgin Islands, where condoms were the most commonly reported method and in Connecticut, where the pill was the most common method. For men aged 45--59 years, tubal ligation or vasectomy was reported most often except in the District of Coulmbia and the U.S. Virgin Islands, where condoms were more commonly reported. Race/ethnicity information was lacking for certain areas because of small sample sizes. White men most commonly reported pill use (23 states), followed by vasectomy (20) and tubal ligation (seven). In New York and the U.S. Virgin Islands, condoms were most commonly reported. Prevalence of pill use ranged from 45% (District of Columbia) to 17% (Wyoming). Sample sizes were inadequate for Guam and Puerto Rico for white men. In 21 states, data were available for black men; condoms were the most commonly reported method (14 states), followed by tubal ligation (six). One state (New Jersey) reported the pill as the most common method. Hispanic men in 15 states reported most commonly using tubal ligation, followed by condoms (five states), and the pill (two). Only a few states had adequate sample sizes for the other racial/ethnic populations: Asian/Pacific Islander (California, Hawaii, New Jersey, and Guam); American Indian/Alaska Native (Alaska, Montana, and Oklahoma); and other (Hawaii and Nevada). For Asian/Pacific Islanders, condom use was most commonly reported in New Jersey and California, tubal ligation in Hawaii, and the pill in Guam. American Indians/Alaska Natives in Alaska most commonly reported condoms, and those in Oklahoma and Montana most commonly reported tubal ligation. For those reporting "other" as their race, in Hawaii, condom use was most common, and in Nevada, pill use was most common. Employed men reported using the pill (19 states) more often than other methods. Vasectomy (17 states) and tubal ligation (11) were the next most common methods. For unemployed men, condoms were the most common method in 23 states. In 10 states, tubal ligation was the most prevalent method, and in 10 states, pill use was most prevalent. In Nevada, the prevalence of pill use was the same as the prevalence for condom use. In Alaska, Idaho, Montana, Oklahoma, Vermont, and Washington, vasectomy was the most common method reported by unemployed men. The two most commonly reported methods reported by married men for pregnancy prevention were tubal ligation (27 states) and vasectomy (25). In Maryland, tubal ligation and vasectomy had the same prevalence (25%). In Illinois, South Dakota, and Utah, pill use was most common. For men who were separated, divorced, or widowed, tubal ligation and vasectomy were the most common method of birth control in 30 states. In 12 states, condoms were most common and in six states, pill use was most common. For single men, condoms were the most common method in 35 states and pill use was most common in 19 states. As with women, many states had sample sizes too small to include for those with less than a high school education. For states with adequate sample sizes for those with less than a high school education, 20 reported tubal ligation as the most common method, four reported condoms (California, Michigan, North Carolina, and U.S. Virgin Islands), and one reported pill use (Nevada). For those with a high school education, the most common reported method was also tubal ligation (25 states), followed by condoms (12). For those with more than a high school education, pill use was the most commonly reported method (31 states) followed by vasectomy (12), condoms (six), and tubal ligation (five). The majority of men with health insurance reported using tubal ligation or vasectomy as their method of birth control (31 states). Pill use was the most common method for 19 states, and condoms were most common in four states (Delaware, District of Columbia, New York, and U.S. Virgin Islands). For those without insurance, condoms were reported most often (25 states), followed by pill use (17), and tubal ligation (nine). In Tennessee, the prevalence of pill use and tubal ligation was the same (28%). For those with children at home, pill use was the most prevalent method of birth control (33 states) followed by condoms (13), and tubal ligation (seven). In Montana, vasectomy and pill use had the same prevalence (28%). In Wyoming, vasectomy was the most common method. For those without children at home, tubal ligation was the most prevalent method (33 states), followed by vasectomy (18), and condoms (nine). Pill use was most prevalent in Nevada, Rhode Island, and South Dakota. In Kansas, prevalence of pill use and vasectomy was the same (27%). DiscussionSeveral factors influence whether a couple at risk for pregnancy uses birth control to prevent pregnancy, what method they use, and how effectively they use it. These include whether they have access to affordable, high-quality reproductive health services and methods, their beliefs about the effectiveness of various methods, their perceptions of pregnancy risk, their fertility goals, their partner's preferences, and their provider's recommendations (2). Differences among state and territory populations in these and other factors might account for differences in the prevalence of birth control use and in the types of birth control methods used. The findings in this report indicate substantial differences among states and sociodemographic groups within states in contraceptive method use and raises questions about how reproductive health attitudes and services differ among states, especially among those of similar demographic composition. Geographic variation might reflect the demographic composition of specific states, the influence of state policies and programs, the prescribing preferences of health-care providers, and other factors. For example, the prevalence of condom use in a state might be influenced by rates for human immunodeficiency virus (HIV) infection and acquired immunodeficiency syndrome (AIDS) within that state. Previous studies indicate that negative attitudes toward contraception affect a woman's decision whether or not to use (6--10). Concern about contraceptive methods, including problems with methods in the past and fear of side effects, are also common reasons for nonuse among women aged >18 years. In addition, women report perceived low risk and unexpected/unwanted sex as reasons for contraceptive nonuse (9,10). Variation by age and other sociodemographic factors within states are similar to recent national data on contraceptive use (e.g., older respondents are expected to report sterilization methods more often) (5). Tubal ligation was higher for older women in every state and, among male respondents, vasectomy increased by age in every state, although tubal ligation was sometimes reported more often by men aged 35--44 years than those aged 45--59 years. The majority of surveillance of birth control use has been among women only. Data on men point to differences between men and women in the reported prevalence with which certain methods are used, and in some states and territories, in the reported percentage using birth control of any kind. The age difference in the two samples (age 18--44 years for women and 18--59 years for men) accounts for part of these differences. Another explanation might be that BRFSS asks respondents to report whether and what they or their partner is doing to prevent pregnancy. Because most available birth control methods are female methods, women might be better able to report on birth control use and type than their male partners. Women and men also might not tell their partner(s) whether they are using birth control and, if so, what kind(s). Although use of contraceptives by those at risk for pregnancy was high overall, usage and method choice varied substantially by state. In particular, the District of Columbia and the territories demonstrated unique characteristics from the states. Condom use prevalence was much higher in the District of Columbia and the U.S. Virgin Islands for both men and women than use of other methods in the 50 states. This might be attributed to an increased prevalence of sexually transmitted infections. The overall AIDS rate for the United States in 2003 was 167 per 100,000 population. However, the AIDS rate was 1,833 for the District of Columbia and 345 for the U.S. Virgin Islands (11). The high prevalence of condom use might indicate that messages for protecting against infections are effective in increasing condom use, a lack of quality family planning services, or limited accessibility to other methods. For example, funding sources for contraceptive programs vary by state depending on local support for contraceptive activities, private foundation funding, and other resources. Within states, groups might exist with a higher unmet need for birth control, increased barriers to contraceptive use, and gaps in the range of methods offered by health-care providers (12,13). The differences in contraceptive prevalence and method choice underscore the existence of geographic variation and how programs must be tailored to the population to increase contraceptive use and promote effective use. Results for all methods demonstrate that certain effective (and some ineffective) methods are relatively rare. For example, the diaphragm might have some value in preventing sexually transmitted infection and was once a relatively common method. However, it has ceased to be a common birth control method. In addition, some of the methods reported have limited effectiveness in preventing pregnancy (e.g., withdrawal and rhythm). This report describes the percentage of respondents using various birth control methods but does not address other important aspects of birth control use that are important for the evaluation of state and other family planning programs. These include method efficacy, the consistency and correctness of method use, use of more than one method, satisfaction with methods, use for stopping or spacing childbearing, and use for all reasons, including HIV/STD prevention. Whenever possible, information on these aspects of birth control use should be considered when analyzing and interpreting the reported results. LimitationsBRFSS focuses on chronic disease risk behaviors and experiences and collects data for a limited range of explanatory variables for analysis. The contraceptive module in 2002 does not include information on sexual and reproductive health behaviors beyond those addressing method use and reasons for not using. For example, information on pregnancy intentions was not explicitly collected in 2002. In addition, the information collected pertains only to contraceptive use to prevent pregnancy; the questions do not address method use for preventing sexually transmitted diseases. This might explain the lower prevalence observed for condoms. For example, the prevalence of condom use for the District of Columbia and the U.S. Virgin Islands might reflect dual efforts of disease and pregnancy prevention. Coding of the contraceptive variables to determine who was at risk for pregnancy presented some limitations. For example, "not sexually active" might reflect different periods (i.e., not active during the preceding week to not active during the preceding year). Respondents choosing this option might move in and out of the at-risk group. In addition, specifying with precision the populations both at risk for pregnancy and at risk for unintended pregnancy is difficult with these data because few questions could be dedicated to this topic in the core questionnaire. The National Survey of Family Growth provides more detailed estimates of birth control use and related reproductive health issues on a national and regional level (5). BRFSS response rates are generally lower than comparable reproductive health surveys such as the National Survey of Family Growth (5). However, response rates are similar to other national telephone surveys, and the reliability and validity of BRFSS measures have been extensively examined (14). ConclusionComparable population-based information on contraceptive use for states can be used to guide the development of state programs and policies to decrease unintended pregnancy and the spread of sexually transmitted diseases. States support various family-planning programs through Medicaid programs. States also support Title X and other programs. Information on contraceptive use for specific subpopulations can be used to further refine these state efforts. These data can help states identify groups within a state who are experiencing a greater unmet need for birth control and who might have increased barriers to birth control use. Low contraceptive prevalence within subgroups might suggest reduced access to health-care services or other barriers to contraceptive use. Data also might indicate gaps in birth control methods offered by health-care providers. An analysis of the prevalence of birth control use by state and selected population characteristics and the analysis of the prevalence of birth control methods by state can help states target contraceptive programs to best meet the needs of their population. This information can be used to gain a better understanding of contraceptive use patterns within and across states and among sociodemographic groups. As the first population-based assessment of contraceptive practices in all 50 states, these results can serve as a baseline for tracking future progress and changes in usage patterns as future rounds of BRFSS become available. Such tracking can be important in evaluating state-supported family-planning programs, policies that expand insurance coverage for contraceptive methods, and other programs to prevent unintended pregnancy. These data can be combined with data from public and private sources such as family-planning programs and encounter data from health insurers to provide a more complete picture of state efforts to prevent unintended pregnancy. To monitor the prevention of unintended pregnancy and efforts to improve pregnancy planning, these data also can be combined with state data from the Pregnancy Risk Assessment Monitoring System (15), which monitors births from unintended pregnancies and guides state program developments. Overall, these data can help states identify populations with an unmet need for birth control, barriers to birth-control use, and gaps in the range of birth control methods offered by health-care providers. Acknowledgments William Mosher, PhD, and Joyce Abma, PhD, National Center for Health Statistics, Division of Vital Statistics, CDC, provided comments on the initial analysis and content of the report. References
Table 1 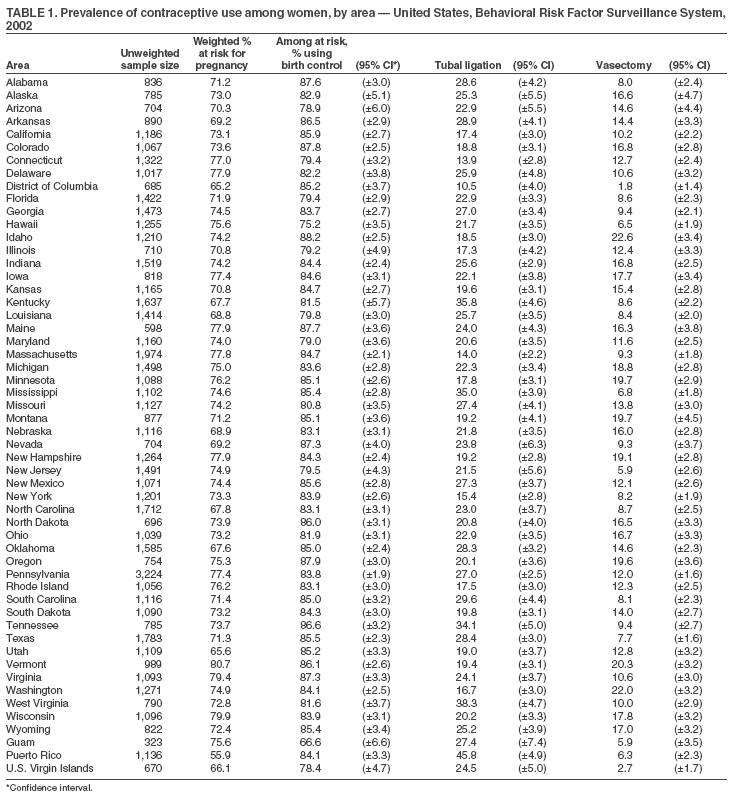
 Return to top. Table 2 
Return to top. Table 3 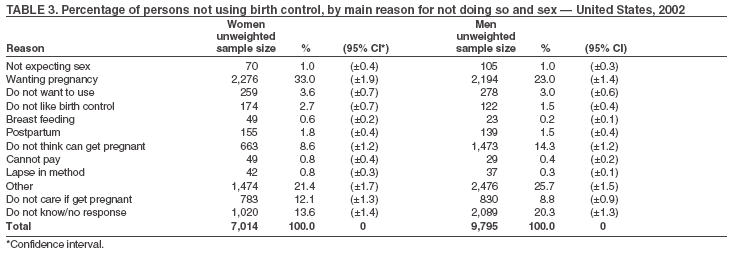 Return to top. Table 4  Return to top. Table 5  Return to top. Table 6  Return to top. Table 7  Return to top. Table 8 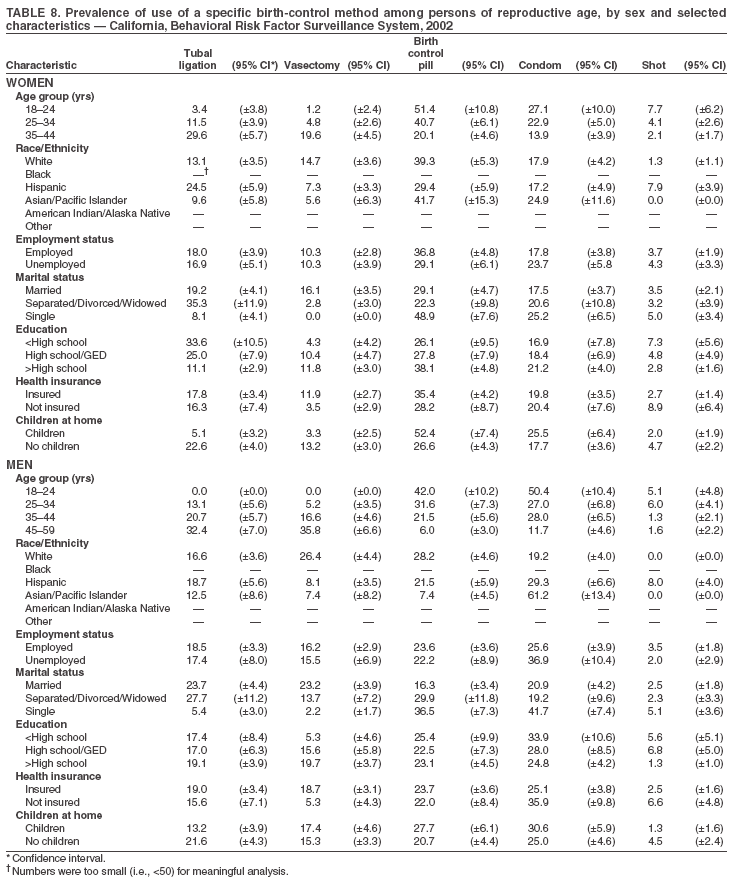 Return to top. Table 9  Return to top. Table 10  Return to top. Table 11  Return to top. Table 12 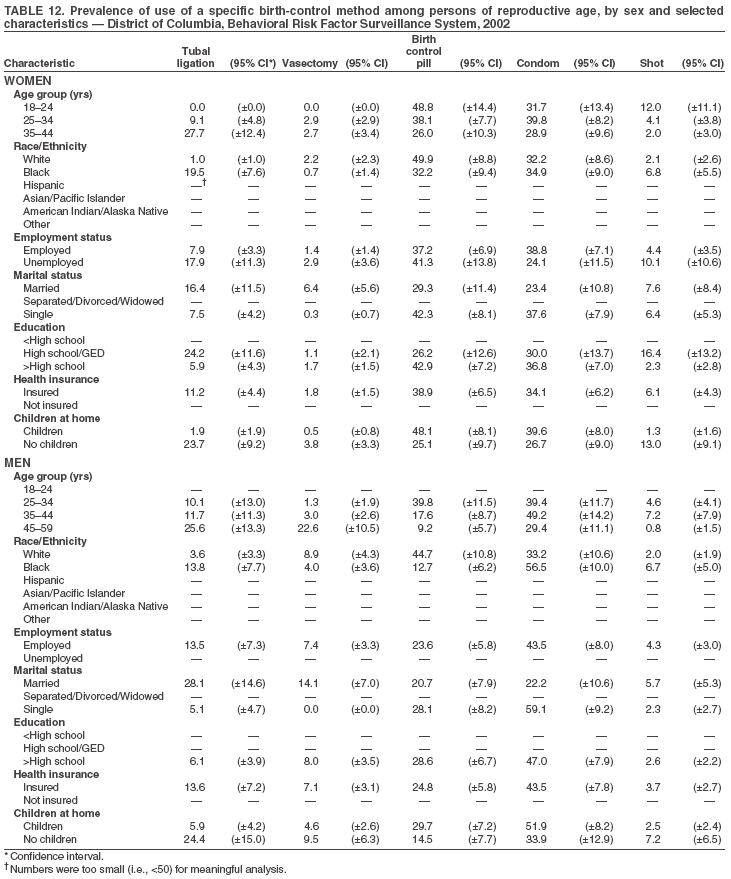 Return to top. Table 13  Return to top. Table 14  Return to top. Table 15  Return to top. Table 16 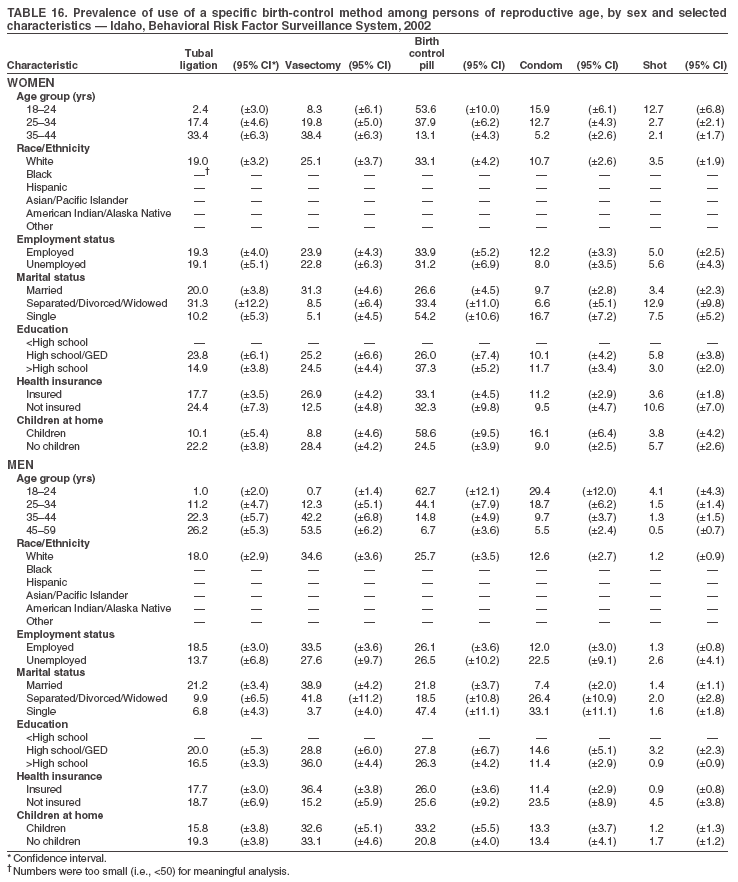 Return to top. Table 17  Return to top. Table 18  Return to top. Table 19 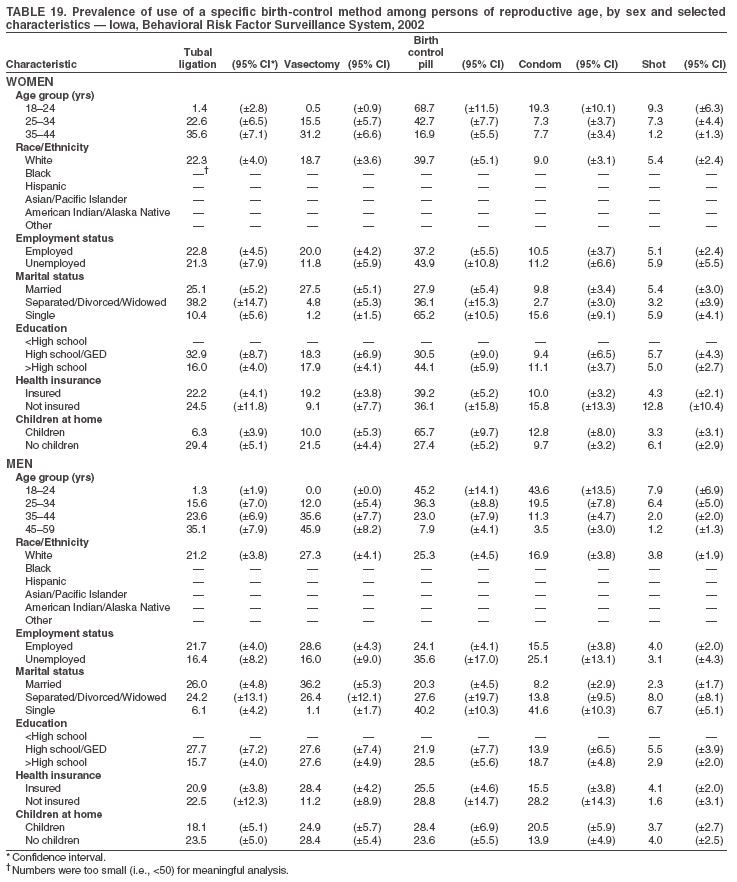 Return to top. Table 20 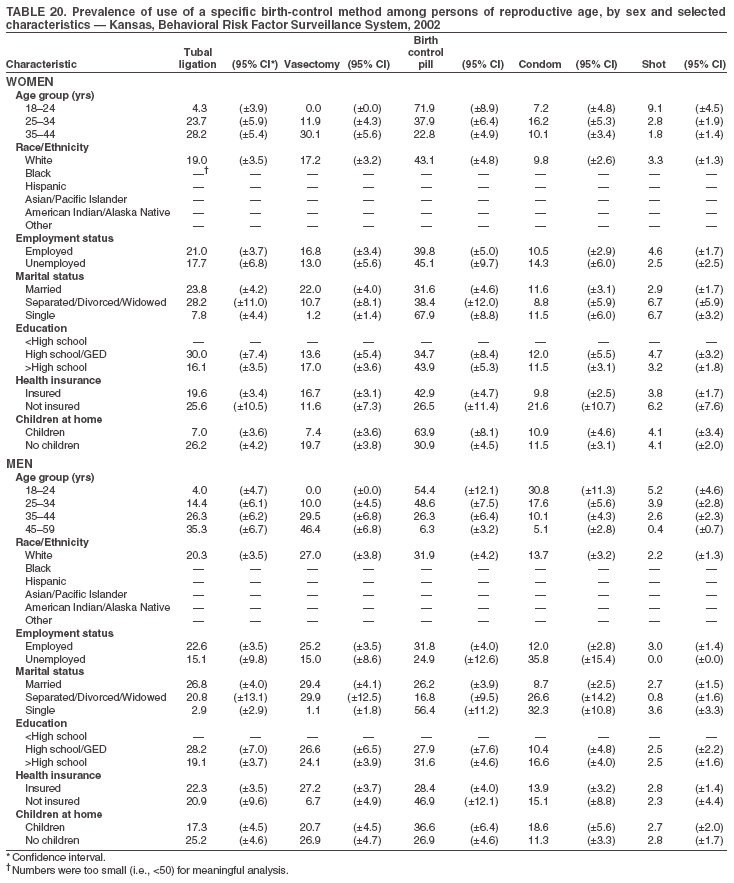 Return to top. Table 21 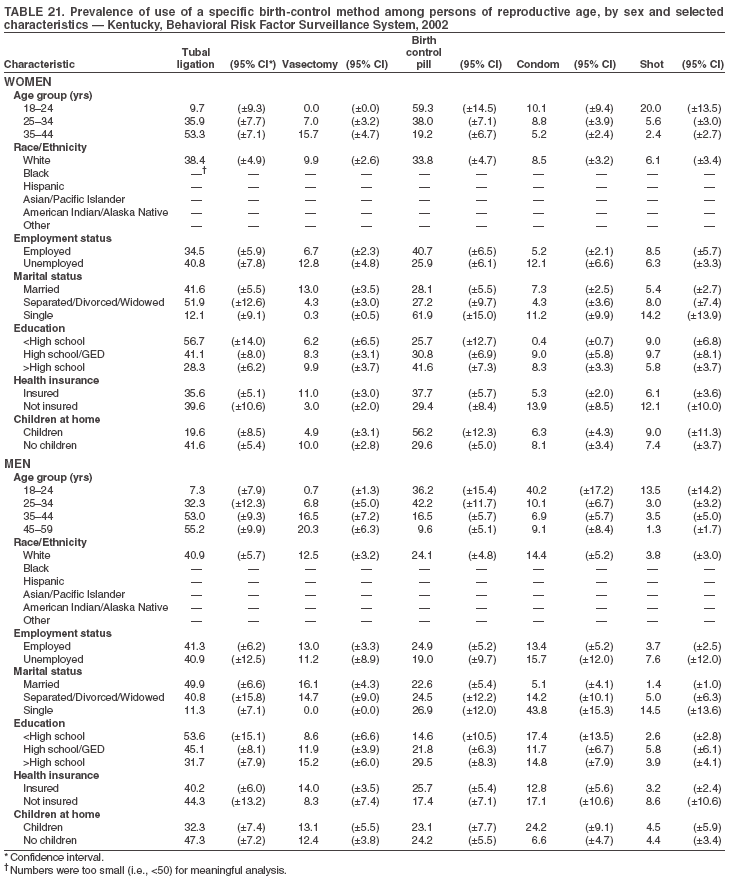 Return to top. Table 22  Return to top. Table 23  Return to top. Table 24  Return to top. Table 25  Return to top. Table 26 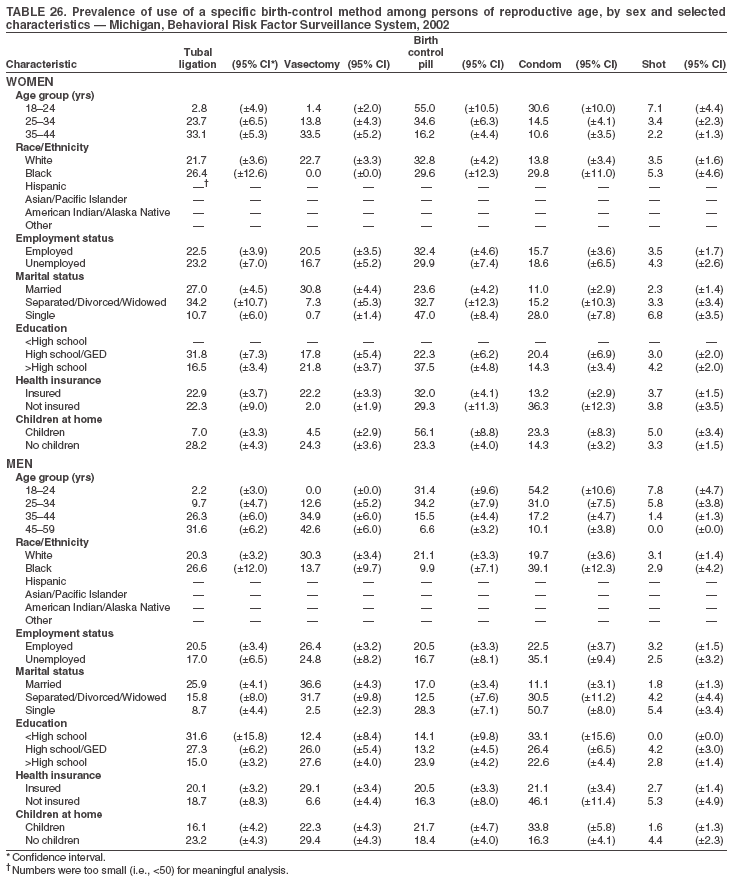 Return to top. Table 27  Return to top. Table 28 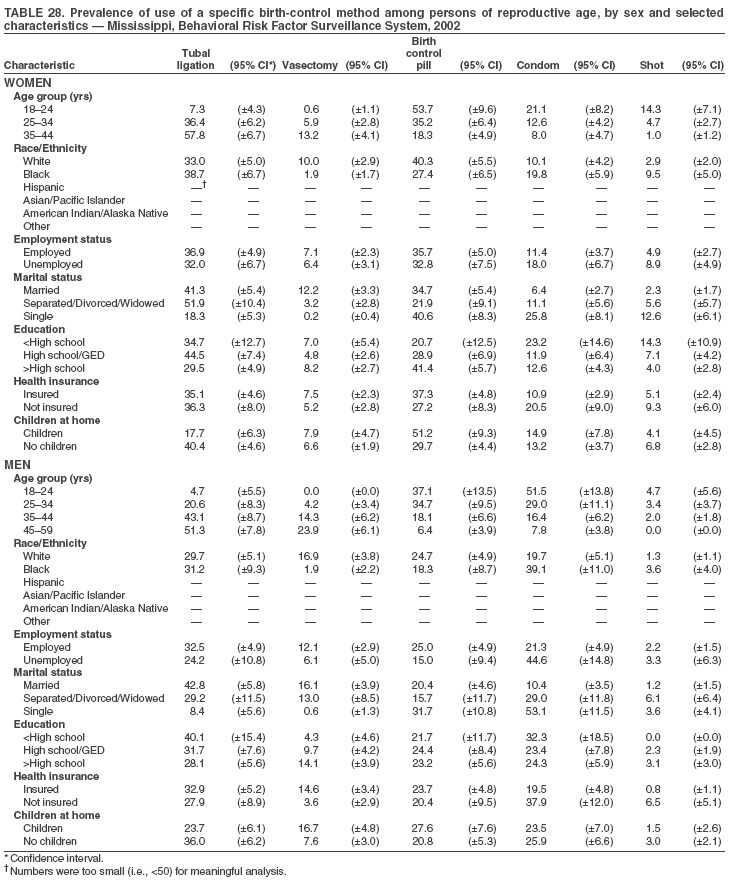 Return to top. Table 29 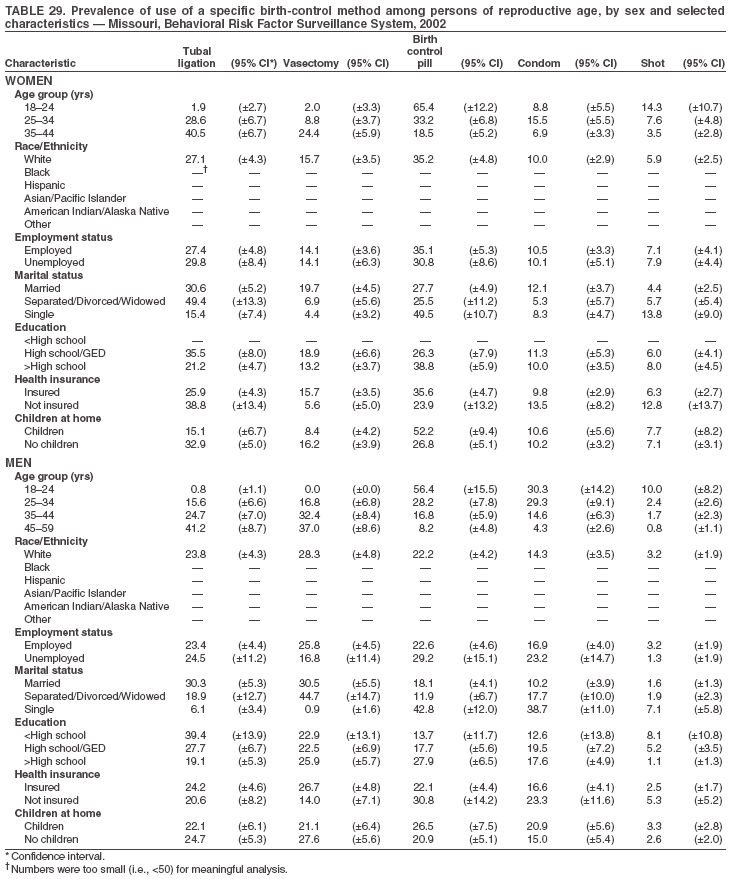 Return to top. Table 30  Return to top. Table 31  Return to top. Table 32 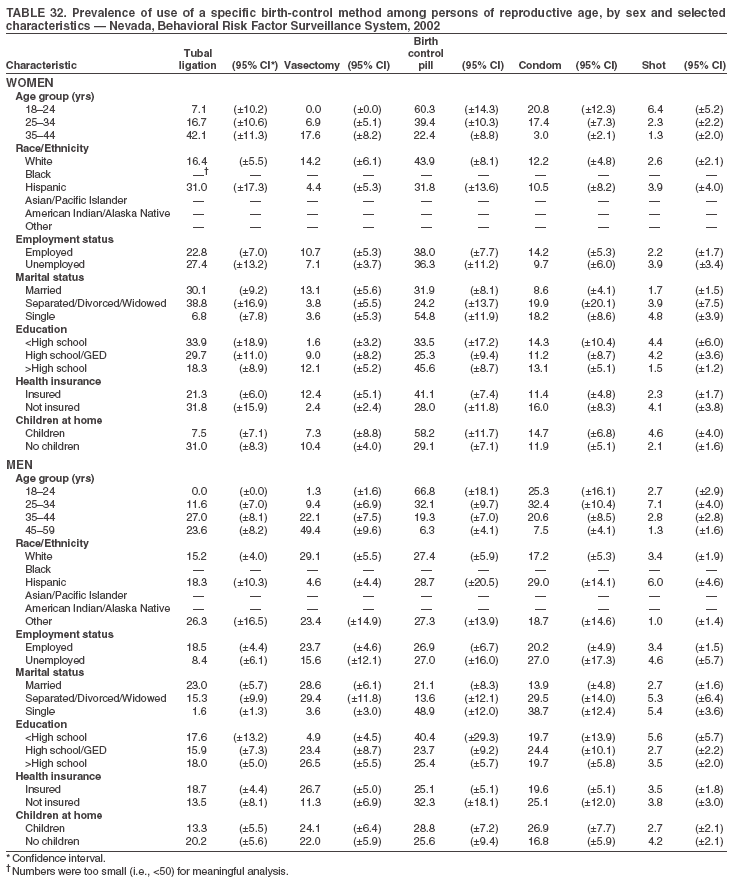 Return to top. Table 33  Return to top. Table 34  Return to top. Table 35 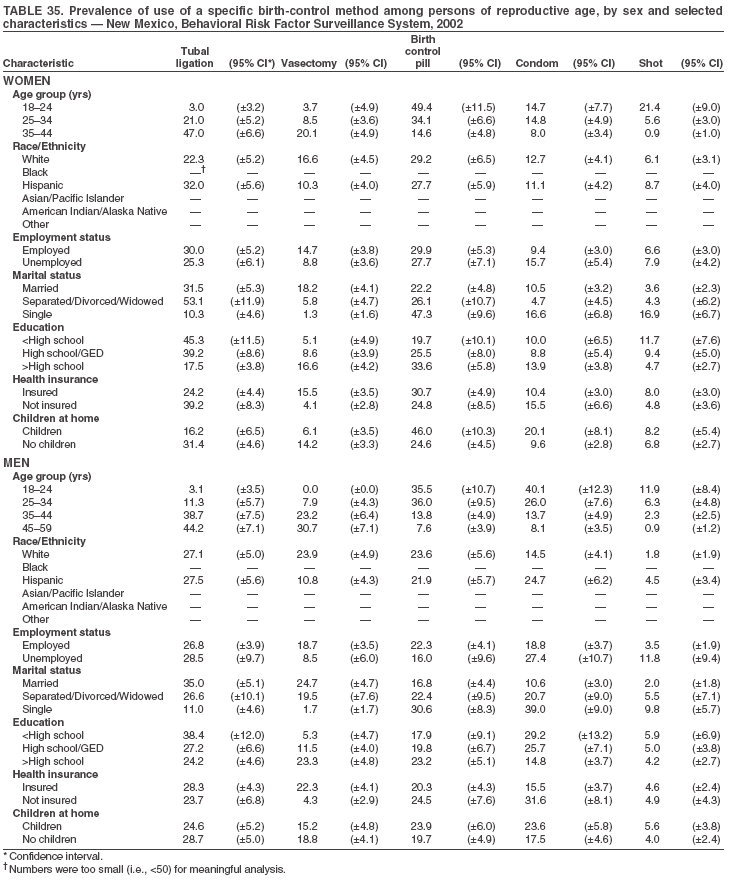 Return to top. Table 36  Return to top. Table 37  Return to top. Table 38  Return to top. Table 39 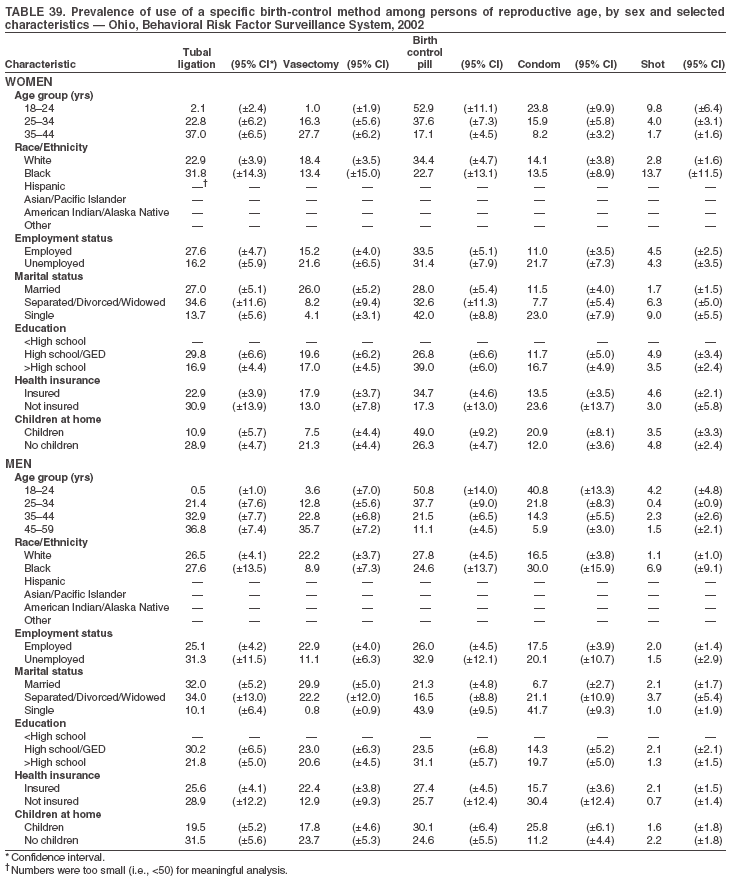 Return to top. Table 40  Return to top. Table 41 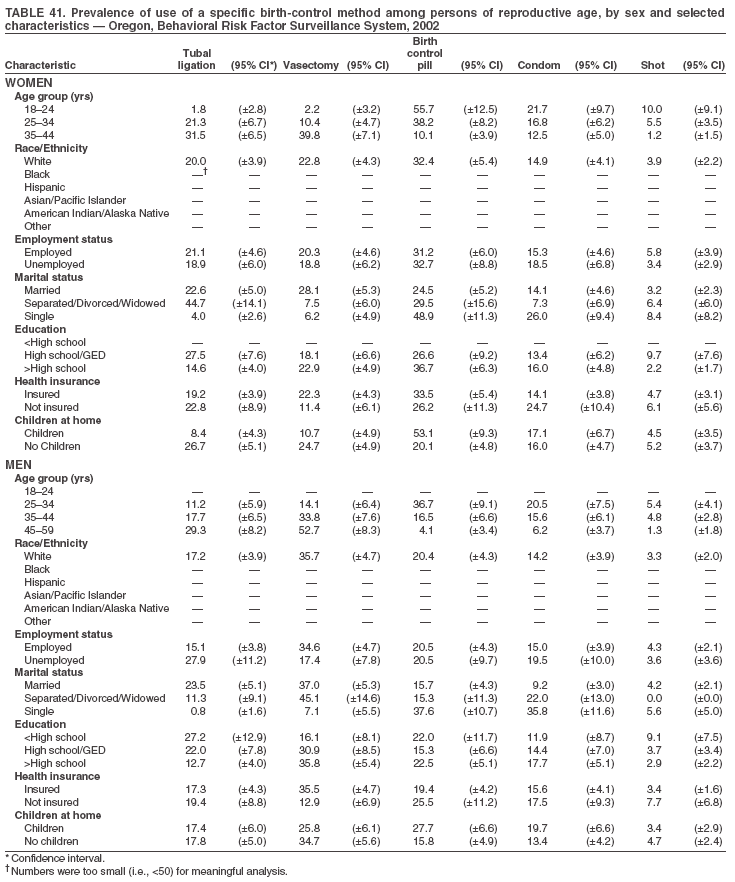 Return to top. Table 42  Return to top. Table 43 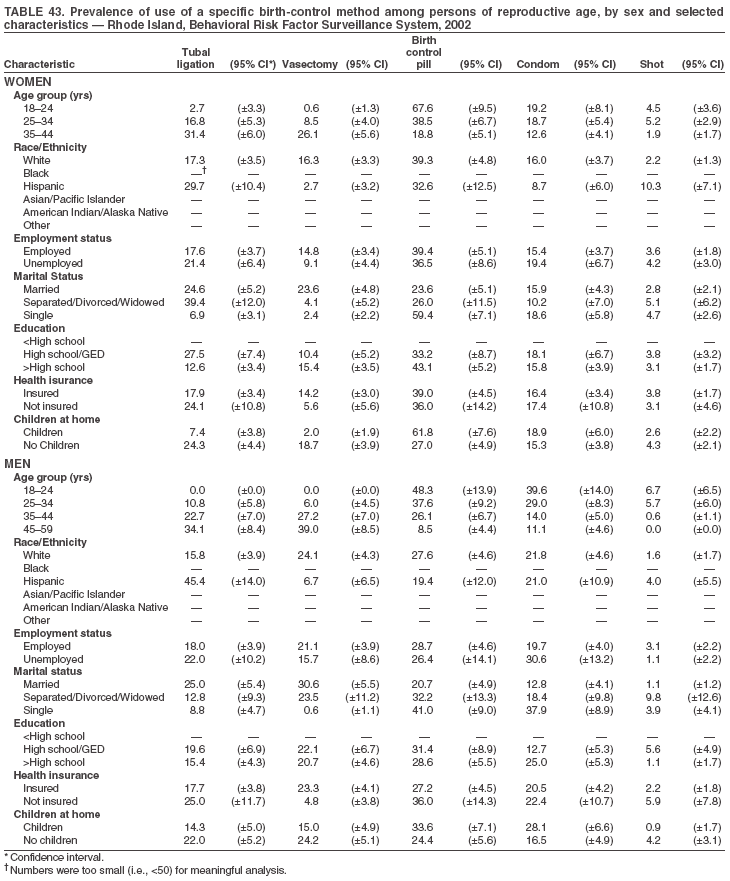 Return to top. Table 44  Return to top. Table 45 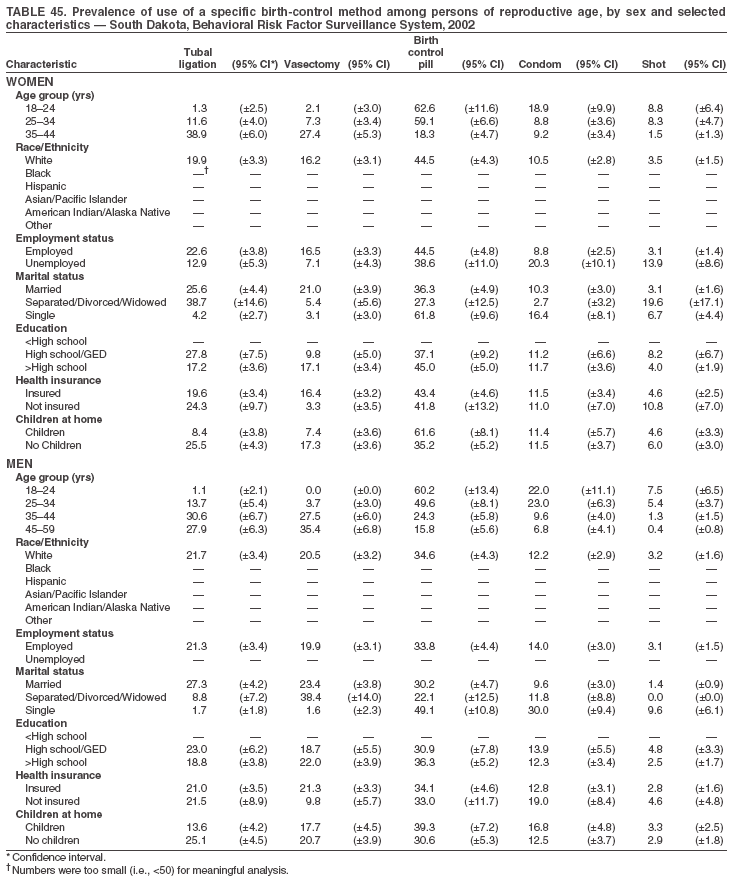 Return to top. Table 46 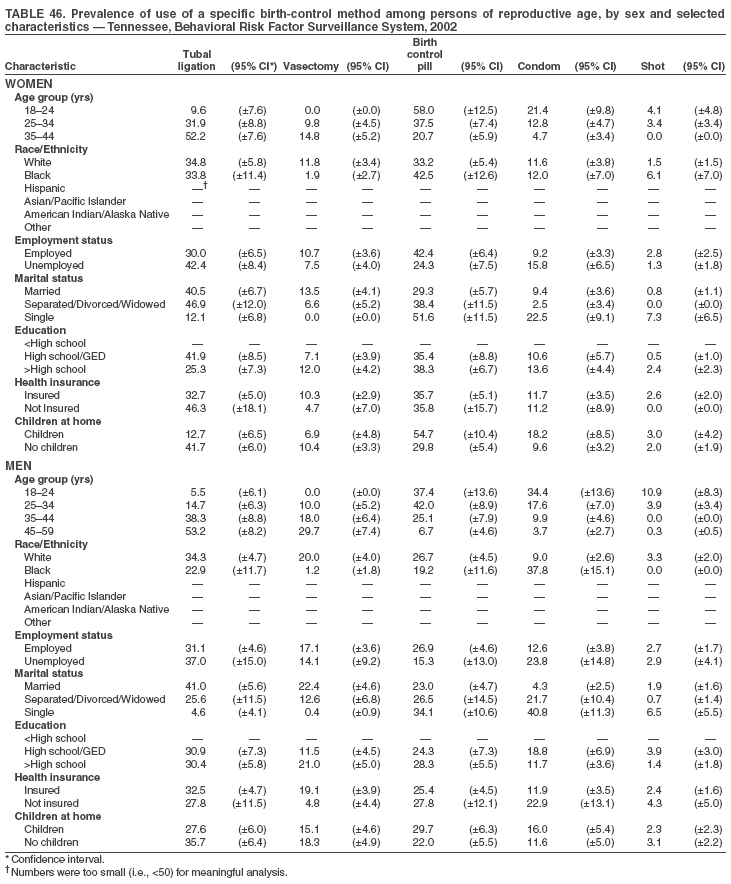 Return to top. Table 47  Return to top. Table 48 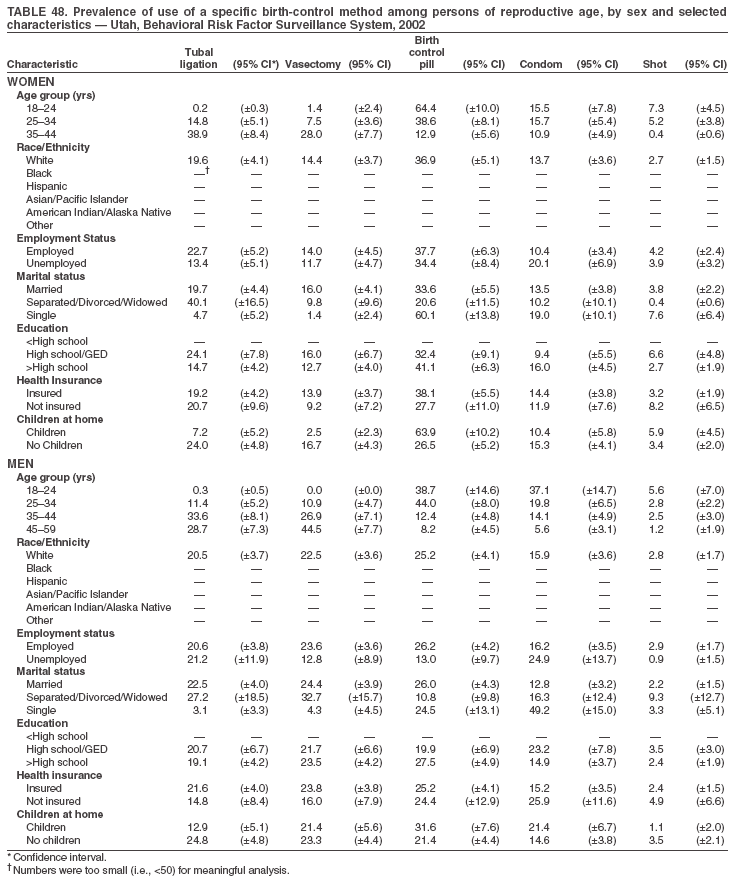 Return to top. Table 49  Return to top. Table 50  Return to top. Table 51 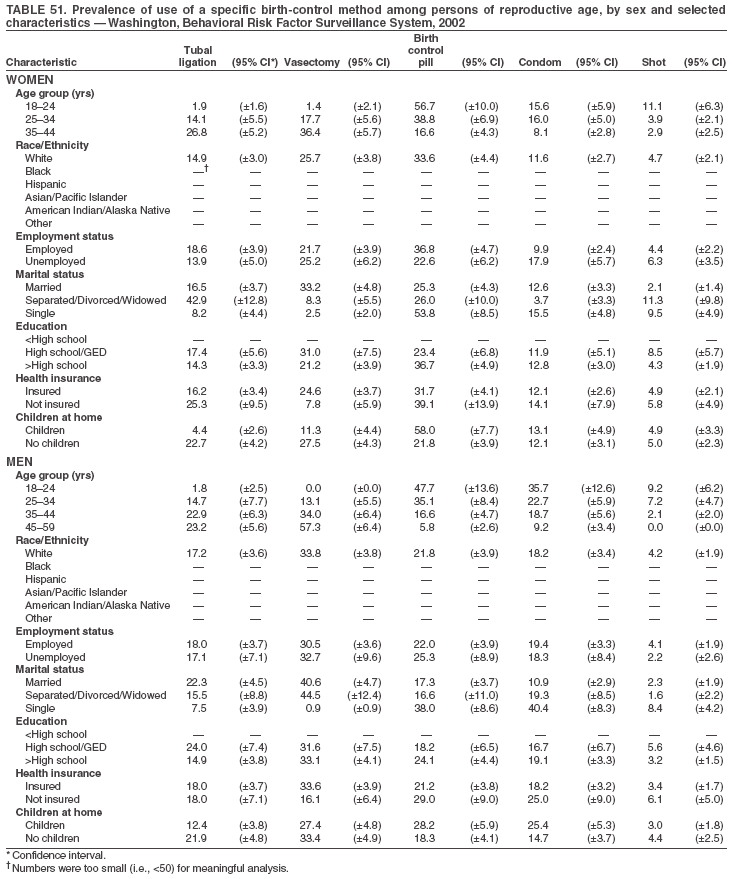 Return to top. Table 52 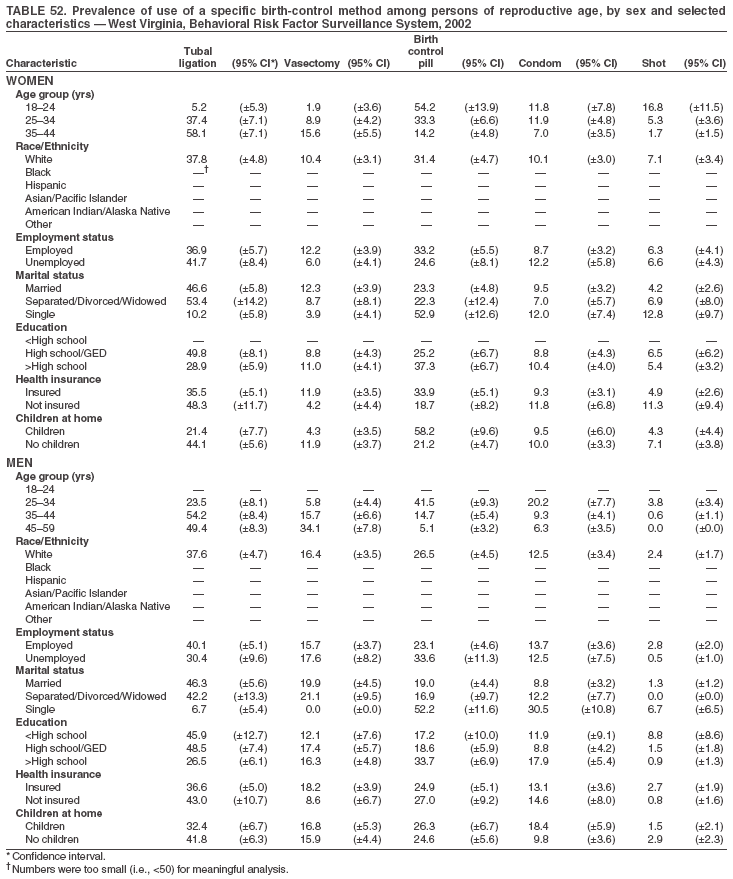 Return to top. Table 53  Return to top. Table 54 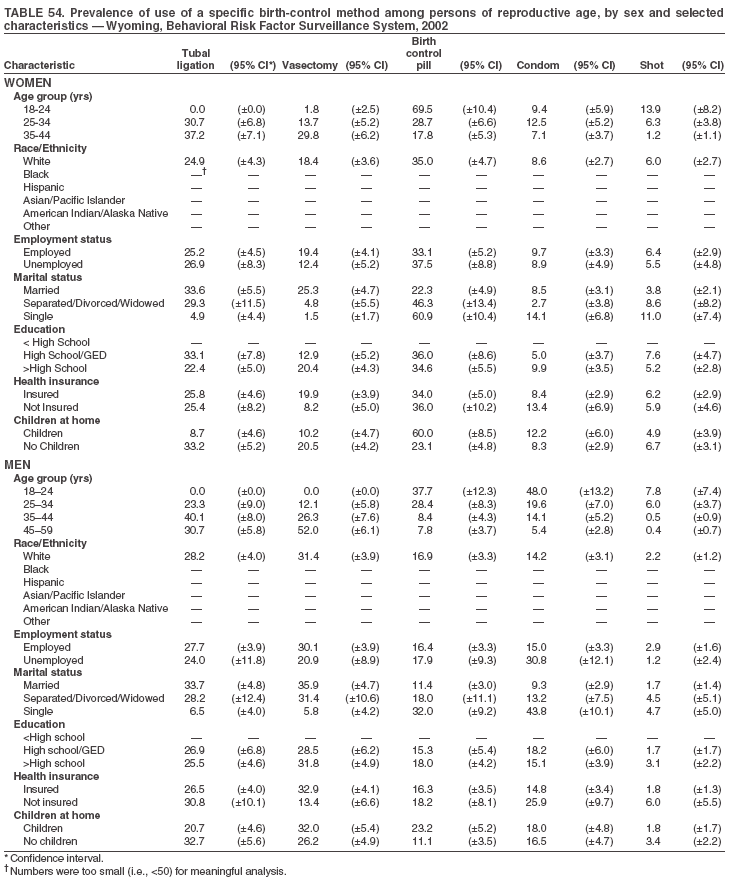 Return to top. Table 55 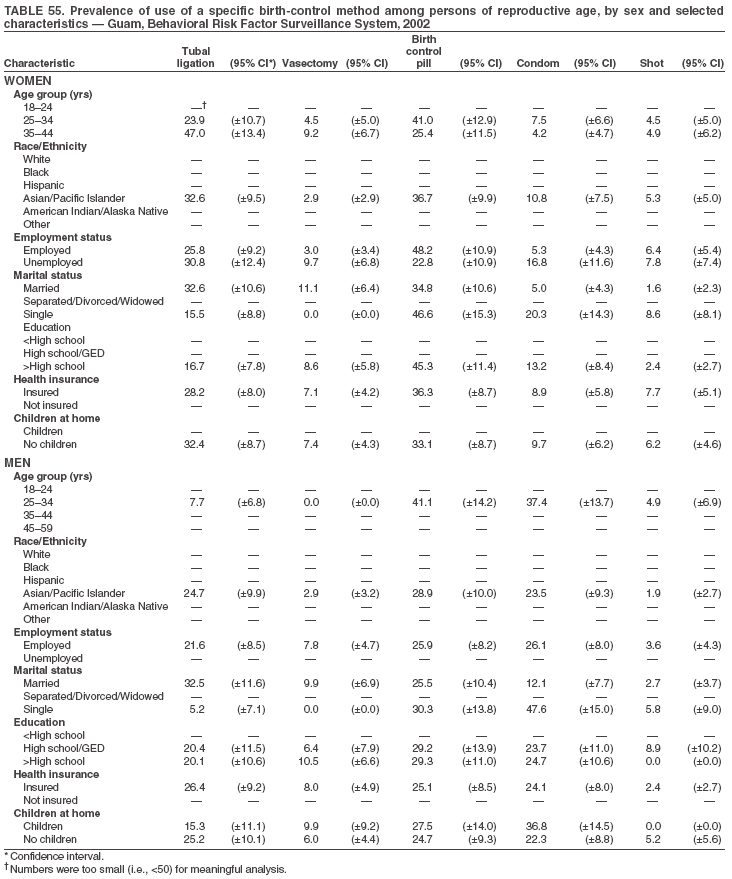 Return to top. Table 56 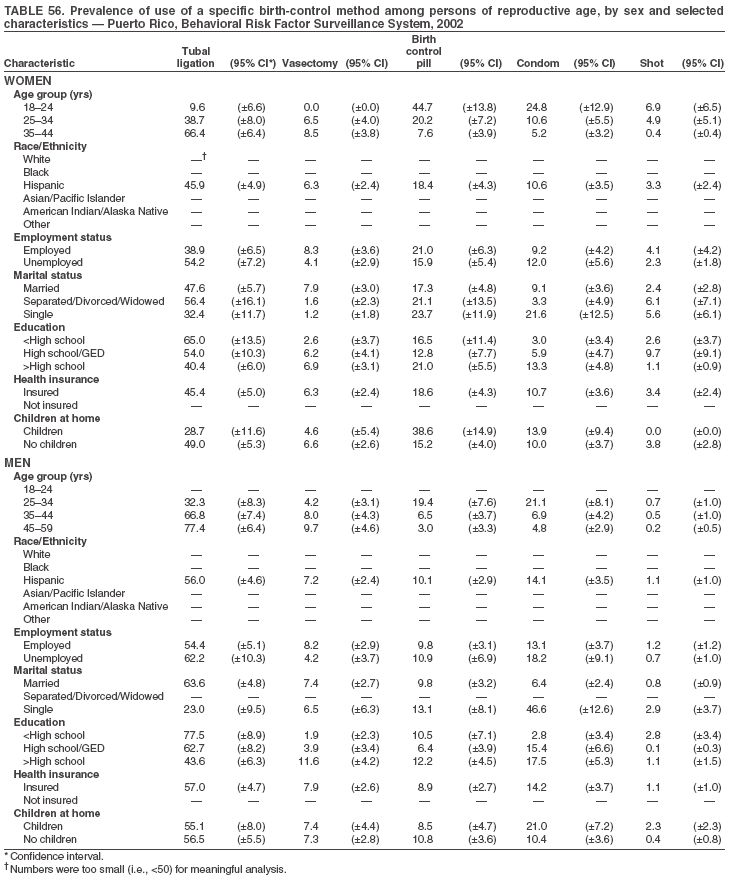 Return to top. Table 57 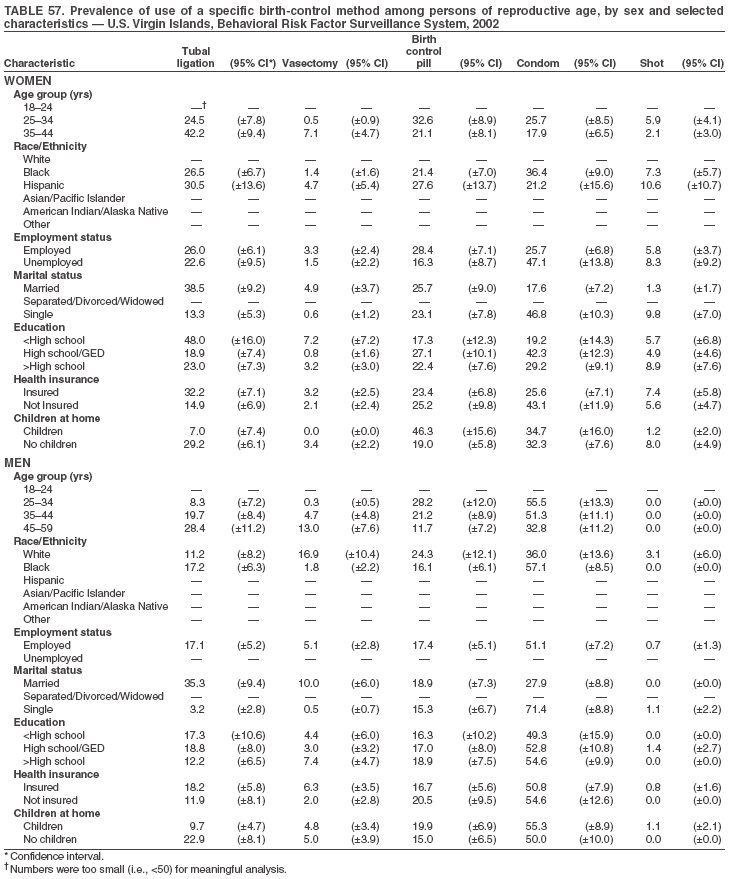 Return to top.
Disclaimer All MMWR HTML versions of articles are electronic conversions from ASCII text into HTML. This conversion may have resulted in character translation or format errors in the HTML version. Users should not rely on this HTML document, but are referred to the electronic PDF version and/or the original MMWR paper copy for the official text, figures, and tables. An original paper copy of this issue can be obtained from the Superintendent of Documents, U.S. Government Printing Office (GPO), Washington, DC 20402-9371; telephone: (202) 512-1800. Contact GPO for current prices. **Questions or messages regarding errors in formatting should be addressed to mmwrq@cdc.gov.Date last reviewed: 11/3/2005 |
|||||||||
|