 |
|
|
|
|
|
|
| ||||||||||
|
|
|
|
|
|
|
||||
| ||||||||||
|
|
|
|
|
Persons using assistive technology might not be able to fully access information in this file. For assistance, please send e-mail to: mmwrq@cdc.gov. Type 508 Accommodation and the title of the report in the subject line of e-mail. Pulmonary Hypertension Surveillance --- United States, 1980--2002Alexandra Hyduk, MPH This material in this report originated in the National Center for Chronic Disease Prevention and Health Promotion, Janet L. Collins, PhD, Director; and the Division for Heart Disease and Stroke Prevention, Darwin R. Labarthe, MD, Acting Director. Corresponding author: Janet B. Croft, PhD, National Center for Chronic Disease Prevention and Health Promotion, 4770 Buford Hwy, NE, Atlanta, GA 30341, MS K-47. Telephone: 770-488-2424; Fax: 770-488-8151; E-mail: JCroft@cdc.gov. AbstractProblem/Condition: Pulmonary hypertension, which is listed on hospital records and death certificates as either primary (i.e., idiopathic) pulmonary hypertension or pulmonary hypertension secondary to another underlying condition or disease, is considered rare amongst the U.S. population. Limited reports have been published regarding surveillance data for this debilitating and often fatal condition. Reporting Period Covered: 1980--2002. Description of Systems: This report summarizes mortality data from the National Vital Statistic System (NVSS) and hospital discharge data from the National Hospital Discharge Survey (NHDS) for 1980--2002 and Medicare hospital claims data for 1990--2002. NVSS, maintained by CDC's National Center for Health Statistics (NCHS), compiles multiple cause of death information from official death certificates filed in the United States. NHDS, also conducted annually by NCHS, includes information on discharges from a sample of nonfederal, short-stay hospitals. Annual hospital claims and enrollment data for all Medicare beneficiaries aged >65 years are provided by the Center for Medicare and Medicaid Services. Because pulmonary hypertension might be reported secondary to other diseases, this report presents data for pulmonary hypertension as any contributing cause of death or any-listed hospital diagnosis. Since 1980, the numbers of deaths and hospitalizations, death rates, and hospitalization rates have increased for pulmonary hypertension, particularly among women and older adults. During 1980--2000, death rates were higher for men than women; however, by 2002, no difference in rate was observed because of increasing death rates among women and declining death rates among men. Hospitalization rates were higher for men than for women until 1995; after 1995, higher rates were observed among women. Death rates since 1985 and Medicare hospitalization rates throughout the reporting period 1990--2002 have been higher for blacks than for whites. In addition, two distinct geographic clusters were observed for the highest hospitalization rates in the Medicare population and the highest death rates for pulmonary hypertension, in the western United States and in the Appalachian region. Interpretation: Increases in mortality from and hospitalization for pulmonary hypertension might reflect increased physician awareness and changes in diagnosing and reporting this chronic disease. Although pulmonary hypertension historically has been considered a disease of women of childbearing age, it affects all ages and racial populations. Older women represent the majority of patients and decedents with this condition. More research is needed concerning cause, prevention, and treatment of pulmonary hypertension. Public health initiatives should include increasing physician awareness that early detection is needed to initiate prompt, effective disease management. Additional epidemiologic initiatives also are needed to ascertain prevalence and incidence of various pulmonary hypertension disease entities such as pulmonary arterial hypertension. IntroductionPulmonary hypertension is a hemodynamic state signifying the presence of one or more pulmonary vascular disease entities and is characterized by a severe elevation in the mean pulmonary arterial pressure and pulmonary vascular resistance (1). Because early symptoms (i.e., difficulty in breathing and fatigue) and later manifestations (i.e., reduced exercise tolerance, palpitations, fainting, swelling of the ankles or legs, chest pain, or hoarseness) are symptomatic of other diseases, prompt diagnosis and treatment can be delayed because physicians often have to exclude other causes for these symptoms (2--4). Pulmonary hypertension is a devastating chronic disease with a poor long-term prognosis; results from a national registry of patients with primary (i.e., idiopathic) pulmonary hypertension indicated that the duration from onset of symptoms to death was an average of 2.8 years (5). In recent years, new treatments have become available for primary pulmonary hypertension, particularly for pulmonary arterial hypertension, which include anticoagulants, calcium channel blockers, and prostacyclins (3,4,6--12); these treatments prolong survival and provide clinical improvement but can often be expensive. Although effective management might be possible with early detection, the majority of persons have pulmonary hypertension diagnosed in later stages of the disease, making treatment more difficult and less successful. Pulmonary hypertension is reported on hospital records and death certificates as either primary pulmonary hypertension or as pulmonary hypertension secondary to another underlying condition or disease. Pulmonary hypertension might be secondary to congenital heart disease, valvular heart disease, chronic thromboembolic disease, lung diseases, liver diseases, sleep-disordered breathing and hypoxemia, lupus, scleroderma, rheumatoid arthritis, vasculitis, or human immunodeficiency virus (HIV) infection (3,7,13). Traditionally, primary pulmonary hypertension might have been diagnosed when no obvious cause of death could be identified. The traditional classification of primary or secondary pulmonary hypertension has limitations and has not been useful in clinical practice (4). In 1998, a conference sponsored by the World Health Organization proposed a new treatment-oriented classification of all pulmonary hypertensive diseases rather than addressing only primary pulmonary hypertension (4,14). Therefore, this report will focus on all forms of pulmonary hypertension. Limited national statistics are available regarding pulmonary hypertensive diseases (15,16). Although a rare condition, death rates for primary pulmonary hypertension as the underlying cause of death have increased since 1979 (15), and the number of all cases is likely higher than that reported because of difficulties in disease detection (16). This report describes trends during 1980--2002 in diagnosed pulmonary hypertension--related deaths and hospitalizations, the only national surveillance data available for pulmonary hypertension. Because pulmonary hypertension might be more likely to be reported secondary to other diseases, this report presents data for pulmonary hypertension as any contributing cause of death or as any-listed hospital diagnosis. MethodsFor this analysis, pulmonary hypertension included primary pulmonary hypertension (i.e., idiopathic pulmonary arteriosclerosis, idiopathic or primary pulmonary artery hypertension, and essential or idiopathic pulmonary hypertension); secondary pulmonary hypertension; other specified pulmonary heart disease, including a small number of cardiopulmonary events; and unspecified chronic pulmonary heart disease, including chronic cardiopulmonary disease and chronic cor pulmonale (17--19). To examine trends in pulmonary hypertension, CDC analyzed data from the National Vital Statistics System (NVSS), the National Hospital Discharge Survey (NHDS), and Medicare hospital claims and enrollment records. Mortality DataNVSS, which is maintained by the National Center for Health Statistics (NCHS), compiles data from vital records on all deaths occurring annually in the United States. Public use data from NVSS files provide the underlying cause of death and up to 19 additional contributing causes and demographic data on decedents (20). Demographic data on death certificates are reported by funeral directors, usually from information provided by family members of decedents. A physician, medical examiner, or coroner reports on the death certificate the diseases, injuries, or complications that caused the death. The underlying cause of death is the disease (or injury) that initiated the sequence of events leading directly to death. For this analysis, all diseases and conditions reported on death certificates were classified according to codes from the International Classification of Diseases, Ninth Revision (ICD-9) for deaths during 1980--1998 (17) and codes from the International Classification of Diseases, Tenth Revision (ICD-10) for deaths during 1999--2002 (18,19). Pulmonary hypertension was diagnosed for decedents with ICD-9 codes 416.0, 416.8, or 416.9 during 1980--1998 or ICD-10 codes I27.0, I27.8, or I27.9 during 1999--2002 reported as any contributing cause of death (i.e., any of the possible 20 conditions, including underlying cause) on the death certificate. Numbers of U.S. residents for the period 1980--2002 were provided by the U.S. Bureau of the Census and used to calculate death rates per 100,000 population. Bridged-race Census estimates were used as denominators for groups defined by race and Hispanic origin during 1990--2002 (20). Death rates were age-standardized to the 2000 U.S. standard population (21,22). Age-specific death rates were calculated for groups aged <45, 45--54, 55--64, 65--74, 75--84, and >85 years. Before 1990, race categories on Census data included only white, black, and other race; beginning in 1990, race categories included white, black, Asian/Pacific Islander, and American Indian/Alaska Native. Hispanic origin was also included in Census data beginning in 1990. Because numbers of deaths with pulmonary hypertension as a contributing cause were relatively small each year, data were aggregated into four 5-year periods (1980--1984, 1985--1989, 1990--1994, and 1995--1999) and one 3-year period (2000--2002) to examine decedent characteristics and age-specific and -standardized death rates among groups defined by race, sex, or age. For 2000--2002, data were aggregated for all 50 states and the District of Columbia (DC) to examine geographic variations in deaths with pulmonary hypertension as a contributing cause. The distribution of selected disease categories reported as the underlying cause of death among decedents with reported pulmonary hypertension was examined for each period. These disease categories were selected based on reported associations of particular diseases with pulmonary hypertension. A major category of interest was chronic lower respiratory disease (e.g., chronic bronchitis, unspecified bronchitis, emphysema, asthma, and other chronic lower respiratory diseases), of which encompasses chronic obstructive pulmonary disease (23). HospitalizationsNHDS is conducted annually by NCHS and provides demographic and discharge information abstracted from medical records of inpatients selected from a nationally representative sample of nonfederal, short-stay hospitals in the 50 states and DC (24,25). Only hospitals with six or more staffed beds and an average length of patient stay of <30 days or those with a general (i.e., medical or surgical) specialty or children's specialty were included in the survey (25). Estimates of the number and rate of hospitalizations attributed to pulmonary hypertension (International Classification of Diseases, Ninth Revision, Clinical Modification [ICD-9-CM] codes 416.0, 416.8, or 416.9 [26]) are provided in this report. These estimates are based on counting a patient if a diagnosis is determined as any one of the up to seven medical diagnoses recorded in NHDS. Estimates from NHDS were calculated by using the weights (i.e., inflation factors) that allow estimation from the sample. Data on the U.S. civilian population for the period 1980--2002 were obtained from the U.S. Bureau of the Census and used to calculate age- and sex-specific hospitalization rates per 100,000 population. Age-specific hospitalization rates were calculated for persons aged <45, 45--54, 55--64, 65--74, 75--84, and >85 years. Hospitalization rates for pulmonary hypertension as any-listed diagnosis were age-standardized to the 2000 U.S. standard population (21,22). To examine trends in hospitalizations during 1980--2002, data were aggregated into four 5-year periods (1980--1984, 1985--1989, 1990--1994, and 1995--1999) and one 3-year period (2000--2002). Race-specific estimates are not provided because of incomplete reporting of race on hospital records (27). In addition, the sampling design for NHDS does not provide for state-specific estimates of hospitalizations. The distribution of selected disease categories as the principal (i.e., first listed) diagnosis also was examined for each period among hospitalizations with any-listed pulmonary hypertension. Medicare ClaimsMedicare hospital claims represent the only available source of hospital discharge information for racial populations and all states and DC. All Medicare hospital claims and enrollment record data for 1990--2002 were obtained from the Centers for Medicare and Medicaid Services. A hospitalization for pulmonary hypertension was defined as one for which any of up to 10 diagnoses (five diagnoses in 1990) on the hospital claim was classified as an ICD-9-CM code 416.0, 416.8, or 416.9. The number of persons at risk (i.e., U.S. residents in the 50 states and DC aged >65 years who were entitled to Medicare Part A benefits on July 1 during 1990--2002, excluding members of health maintenance organizations) was obtained from Medicare enrollment records. Hospitalization rates per 100,000 Medicare enrollees were age-standardized to the 2000 U.S. standard population aged >65 years (21,22). Age-specific hospitalization rates were calculated for groups aged 65--74, 75--84, and >85 years. Race categories on hospital claims and enrollment records included white, black, Asian, Hispanic, and American Indian. State-specific numbers were obtained, and age-standardized rates of hospitalizations with pulmonary hypertension as any-listed diagnosis were calculated for the Medicare population in all 50 states and DC. ResultsMortality DataDuring 1980--2002, the total number of deaths attributed to pulmonary hypertension as any contributing cause of death increased from 10,922 to 15,668 (Table 1); however, the increase was observed only among women. During 1980--1991, women had lower numbers of deaths from pulmonary hypertension than men; after 1991, women had higher numbers of deaths than men. Age-standardized death rates for the total U.S. population remained relatively stable from 1980 (5.2 per 100,000) through 2002 (5.4 per 100,000) (Table 1). However, rates increased among women but decreased among men during this period such that the age-standardized death rates were similar beginning in 2000 (Figure 1). Among all racial populations, the number of deaths from pulmonary hypertension reported as any contributing cause of death increased, with blacks having the highest age-standardized death rates (Table 2, Figure 2). Non-Hispanics had higher age-standardized death rates than Hispanics (Table 3). Age-specific death rates for pulmonary hypertension reported as any contributing cause of death also increased, primarily among adults aged >85 years, particularly during 1990--2002 (Table 4, Figure 3). The annual number of deaths from pulmonary hypertension as any contributing cause of death was aggregated into the five selected periods (1980--1984, 1985--1989, 1990--1994, 1995--1999, and 2000--2002) for groups defined by sex, age, race, and Hispanic ethnicity to obtain stable estimates for comparisons. Over the five periods, age-standardized death rates for pulmonary hypertension as any contributing cause of death increased among women and blacks (Table 5). Age-specific death rates increased among men aged >85 years, women aged >65 years, whites aged >75 years, and blacks aged >65 years (Table 5). Nevertheless, during 2000--2002, men had slightly higher age-specific death rates than women in the older age groups (Figure 4). At ages <75 years, blacks had higher age-specific death rates than whites during 2000--2002, but whites had higher death rates than blacks at ages >85 years (Figure 5). During 2000--2002, age-standardized death rates for pulmonary hypertension reported as any contributing cause of death varied among states/areas (Table 6). States/areas with the highest age-standardized death rates were Wyoming (9.9), Idaho (8.9), DC (8.8), Colorado (8.6), Vermont (8.4), Alaska (7.7), Montana (7.4), North Carolina (7.4), Ohio (7.4), West Virginia (7.3), and New Hampshire (7.2). During 1980--2002, because of increased numbers of death among women, the proportion of decedents with reported pulmonary hypertension who were female increased. During 2000--2002, 58.3% of all decedents with pulmonary hypertension reported on their death certificates were female (Table 7). Among decedents with reported pulmonary hypertension, the proportion whose race was reported as black also increased. Among decedents with pulmonary hypertension reported, little change was observed in the proportions of those who were aged <55 years. However, the proportion of decedents aged >75 years increased during 1980--2002 such that 30.6% of all decedents with pulmonary hypertension reported during 2000--2002 were aged 75--84 years and 18.1% were aged >85 years, compared with 23.7% and 6.5%, respectively, during 1980--1984 (Table 7). Age distributions were similar among females and males aged <55 years during 2000--2002 (Figure 6); however, 21% of all female decedents with pulmonary hypertension reported were aged >85 years, compared with 14% of male decedents, although greater proportions of men than women were aged 65--74 years. Only 11.1% of male decedents and 9.6% of female decedents with pulmonary hypertension reported during 2000--2002 were aged <45 years, an age category that includes women of childbearing age affected by pregnancy-related pulmonary hypertension and newborns and young children with congenital anomalies or familial pulmonary hypertension. In contrast, a higher proportion of decedents were aged <45 years among blacks compared with whites (22.4% versus 8.0%) during 2000--2002 (Figure 7). The proportions who were aged 45--54 years and 55--64 years were higher among blacks than among whites; in contrast, the proportion who were aged >65 years was higher among whites than among blacks during 2000--2002 (75.1% versus 48.2%, respectively). Some disease categories that are commonly reported with pulmonary hypertension were rarely reported as the underlying cause of death among decedents (Table 8). During 2000--2002, among decedents with pulmonary hypertension reported on the death certificate, the most commonly reported underlying cause was pulmonary hypertension (30.3%), followed by chronic lower respiratory disease (25.9%). During 1980--2002, the proportions of decedents with pulmonary hypertension reported as the underlying cause of death increased among all decedents with pulmonary hypertension reported as any cause on the death certificate. Although chronic lower respiratory disease was the most commonly reported underlying cause of death for persons with pulmonary hypertension during 1980--1984 (49.2%), the proportion decreased during 1980--2002. The increase in reported pulmonary hypertension and the decline in reported chronic lower respiratory disease as the underlying cause of death among all decedents with pulmonary hypertension reported were observed in all groups defined by sex, race, and age. Among decedents aged <45 years, the most common underlying causes of death were pulmonary hypertension; congenital malformations; complications of pregnancy, childbirth, and the puerperium, or conditions originating in the perinatal period; and other cardiovascular diseases (Table 9). HospitalizationsDuring 1980--2002, the estimated number of hospitalizations with pulmonary hypertension as any-listed diagnosis tripled for the total U.S. population (Table 10). Compared with estimated numbers of hospitalizations in 1980, the numbers in 2002 were two times higher among men and four times higher among women. Age-standardized hospitalization rates doubled for men and tripled for women. Rates of hospitalizations for pulmonary hypertension among women were higher than those for men, only after 1995 (Figure 8). In 2002, the age-standardized hospitalization rate for pulmonary hypertension as any-listed diagnosis was 95.3 for women and 82.3 for men. Numbers of hospitalizations and age-specific hospitalization rates increased for all age groups in the total U.S. population (Table 11). The greatest increase in hospitalization rate was among adults aged >75 years (Figure 9). To examine trends by sex and age, sample sizes were increased to obtain more reliable estimates by aggregating years of data from NHDS. During 1980--2002, the greatest increase was for ages >85 years among men and for ages >65 years among women (Table 12). Because of major increases in hospitalizations among women aged >85 years, during 2000--2002, women had higher hospitalization rates than men in this older age group (Figure 10). During 1980--2002, because of substantial increases in the number of women hospitalized with pulmonary hypertension, the proportion increased such that 60.6% of all hospitalizations with any-listed diagnosis of pulmonary hypertension during 2000--2002 were among women (Table 13). During the 2 decades, the proportion of patients aged >65 years increased from 55.4% during 1980--1984 to 66.0% during 2000--2002 among all hospitalizations with pulmonary hypertension as any-listed diagnosis. During 2000--2002, the proportion of hospitalized persons aged >85 years was higher among women than men (Figure 11). During 1980--2002, trends in the most commonly reported principal diagnosis changed (Table 14). During 1980--1984, the most commonly reported principal diagnoses among hospitalizations with any-listed diagnosis of pulmonary hypertension were chronic lower respiratory diseases (42.0%), followed by pulmonary hypertension (12.8%) and other cardiovascular diseases (6.8%). By 2000--2002, heart failure (18.7%) was the most commonly reported principal diagnosis, followed by chronic lower respiratory diseases (12.9%) among hospitalizations with any-listed diagnosis of pulmonary hypertension. During 2000--2002, pulmonary hypertension was the principal diagnosis of only 4.2% of hospitalizations involving pulmonary hypertension as any-listed diagnosis. Declines in reporting pulmonary hypertension and chronic lower respiratory disease and the increase in reporting heart failure as the principal diagnosis in these cases were observed among all groups defined by sex and age. Among persons aged <45 years, the principal diagnosis was more likely to be pulmonary hypertension (26.0%) and congenital malformations (22.9%) during 1980--1984; however, by 2000--2002, these conditions had declined as the principal diagnosis among hospitalizations with pulmonary hypertension as any-listed diagnosis (Table 15). Other cardiovascular diseases (29.8%), other respiratory diseases (9.8%), pulmonary hypertension (9.5%), and chronic lower respiratory diseases (7.1%) were the major principal diagnoses during 2000--2002. During this period, other frequently reported principal diagnoses were examined for these pulmonary hypertension hospitalizations among patients aged <45 years. Influenza and pneumonia (4.6%), congenital malformations (4.3%), complications related to specific procedures (3.9%), cellulites and abscess (3.6%), and complications related to pregnancy and childbirth (3.2%) also were principal diagnoses for these younger patients. Medicare ClaimsDuring 1990--2002, the annual number of hospitalizations for pulmonary hypertension as any-listed diagnosis tripled among Medicare enrollees aged >65 years, from 55,516 to 187,205 (Table 16). The age-standardized hospitalization rate was 197.8 in 1990 and 649.7 in 2002. Men had higher age-standardized Medicare hospitalization rates with any-listed pulmonary hypertension than women until 1999 (Figure 12). Increases in numbers of Medicare hospitalizations for pulmonary hypertension were observed among all groups defined by race (Table 17) and age (Table 18). Age-standardized hospitalization rates were higher for blacks than whites (Figure 13). Age-specific hospitalization rates increased for all age groups, but the rates were not the highest among adults aged >85 years until after 1995 (Figure 14). By 2000--2002, age-specific hospitalization rates were higher among women at ages 65--74 years and 75--84 years, and whites had higher age-specific hospitalization rates than blacks at ages >85 years (Table 19). During 1990--2002, age-standardized Medicare hospitalization rates increased each year in each state. State data were aggregated for 2000--2002 to obtain more stable Medicare hospitalization rates (Table 20). During 2000--2002, states/areas with the highest age-standardized hospitalization rates with pulmonary hypertension as any-listed diagnosis were Wyoming (1172.1), Colorado (1022.8), West Virginia (954.7), Pennsylvania (907.0), Maryland (841.1), Montana (833.2), Idaho (796.3), New Mexico (792.5), Virginia (788.3), DC (782.0), and Delaware (781.7). DiscussionThe findings in this report indicate that, during 1980--2002, death rates and hospitalization rates for pulmonary hypertension as either any contributing cause of death or as any-listed hospital diagnosis increased. The number of pulmonary hypertension--related deaths and number of hospitalizations also increased, particularly among women, blacks, and older adults. Nevertheless, death rates were higher for men than women during the 2 decades, and hospitalization rates were higher for men than women until 1995. A geographic clustering of the highest Medicare hospitalization rates and highest death rates for pulmonary hypertension was observed in the western United States (in Colorado, Idaho, Montana, and Wyoming) and a second clustering in the Appalachian region (in DC, Maryland, Pennsylvania, Virginia, and West Virginia). In addition, reporting of pulmonary hypertension as the underlying cause of death increased, and reporting pulmonary hypertension as the principal diagnosis decreased during 1980--2002. Among all decedents and all persons hospitalized with pulmonary hypertension, the reporting of chronic lower respiratory disease (including chronic obstructive pulmonary disease) as the underlying cause of death or principal hospital diagnosis declined, and reporting heart failure as the principal diagnosis on the hospital record increased for all age groups. Increases in reporting pulmonary hypertension as any-listed diagnosis on hospital records might indicate an actual increase in the number of patients or, more likely, a greater increased awareness among physicians to evaluate and diagnose pulmonary hypertension. In 1996, studies suggested a link between appetite suppressants and increases in primary pulmonary hypertension (28--30), which probably created greater public and professional interest in the disease, particularly in terms of cases among women. Hospitalization rates for pulmonary hypertension began increasing among both men and women during the early 1990s at the same time that use of appetite suppressants was prevalent (31); however, the major increases in hospitalization rates with pulmonary hypertension as any-listed diagnosis seem to have occurred among older women than among younger and middle-aged women who were more likely to take suppressants (32). As the reporting of chronic lower respiratory disease as the underlying cause of death and principal hospital diagnosis declined, heart failure as the principal diagnosis on hospital records and the reporting of pulmonary hypertension as the underlying cause of death on death certificates increased. Changes in the reporting of pulmonary hypertension as the underlying cause of death might be related to changes in medical opinion and interpretation of certification instructions. In addition, increased perception of a condition as serious or fatal could lead to increased reporting of that condition as a contributing cause of death (33) or hospitalization. Heart failure is rarely reported on death certificates as the underlying cause because specific instructions on the death certificate state that "cardiac failure" should not be listed as the underlying cause of death. Whether these patterns reflect reporting trends on the part of physicians and health-care systems or actual changes in the etiology and prevalence of pulmonary hypertension should be investigated further. Nevertheless, efforts to eliminate underdiagnosis of pulmonary hypertension and improve the reporting on death certificates and hospital records must be systematic to obtain a more credible estimate of the true distribution of pulmonary hypertension in the U.S. population. At least three possible explanations exist for the geographic clusterings of Medicare hospitalizations and death rates for pulmonary hypertension in the western United States and Appalachian region. First, differences may exist in medical opinion on certification instructions or on the number of causes to be reported per death certificate. Second, these cases might be more likely to be detected by physicians affiliated with recognized pulmonary hypertension centers of excellence and referral that are located in Denver (CO), Baltimore (MD), and Philadelphia (PA). Third, particular genetic factors or environmental toxins might be more prevalent in those regions. For example, higher hospitalization rates for pulmonary hypertension in the Medicare population in states bordering the Appalachian region might reflect higher proportions of the population who were employed in the coal-mining industry decades ago and who might have contracted respiratory diseases such as "coal-workers" pneumoconiosis, diseases that predispose to pulmonary hypertension. In addition, altitude might also play an important role in the development of pulmonary hypertension in states such as Colorado, Montana, and Wyoming. Identification of these unreported clusters warrants further investigations. The findings in this report are subject to at least six limitations. First, mortality data are subject to diagnosis and reporting errors by physicians, medical examiners, and coroners, particularly in the absence of an autopsy. Second, the current ICD classifications do not allow data users or those reporting the causes of death and diagnoses to differentiate specific diseases that are of interest in the study of pulmonary hypertension. For example, approximately 99% of all heart failure diagnoses documented in this report were congestive heart failure, a category which also includes right heart failure secondary to left heart failure; however, isolated right heart failure and isolated left heart failure do not have reportable codes but could be of greater interest to future investigators. Similarly, the current ICD codes do not allow differentiation of the five major categories of pulmonary hypertension entities (Table 21). Thus, population estimates for pulmonary arterial hypertension cannot be ascertained, although this category might be of greater interest to current and future research. Third, NHDS does not include patients admitted to government hospitals (i.e., Veterans Affairs or military); therefore, results might underestimate the total number of hospitalizations for pulmonary hypertension among adults. Fourth, the use of hospital discharge records and Medicare claims records includes the possibility that trends in hospitalization rates could reflect patterns in financial incentives to report other diseases as the principal diagnosis rather than pulmonary hypertension. Fifth, hospital discharge data should not be used to represent prevalence or incidence of the disease because distinguishing between first or new hospitalizations or multiple readmissions during the year is not possible. Finally, a limitation of hospital discharge records and Medicare hospital claims is the inability to determine the accuracy of physician or administrative reporting or the validity of ICD classification of the various disease entities; no information on results of clinical diagnostic evaluations is available. Whether pulmonary hypertension is rare is debatable given the likely underdiagnosis and, thus, underreporting of persons with the disease. Pulmonary hypertension has had an unclear pathogenesis (13,34--37). Although advances have occurred in understanding the pathogenesis of pulmonary hypertension among specialists in the past decade, this understanding might not have reached general practice. In 1998, a World Health Organization symposium developed a more inclusive and clinically useful treatment-based classification system that divided the causes of pulmonary hypertension into five distinct categories of disease entities (5,14). Unfortunately, this classification system has not been translated into useful ICD classifications for reporting and distinguishing specific disease entities for surveillance purposes. In 2003, another symposium assessed the impact and usefulness of this classification and determined that, although the new classification was accepted and widely used among specialists and in centers with the largest clinical experience, less experienced physicians apparently continued to use the old classification (i.e., primary versus secondary) (38). Therefore, this could complicate prompt evaluation and diagnosis and lead to further misdiagnosis and inaccurate reporting on death certificates and hospital records. Continued clinical research is underway to better understand pulmonary hypertension and its risk factors, as well as the prevention and treatment of pulmonary hypertension. However, professional education efforts should be considered to prompt physician recognition of the early symptoms of suspected pulmonary hypertension, to inform physicians about the treatment-based classification of disease entities, and to educate physicians about the multiple diagnostic evaluations necessary for the categorization and appropriate treatment of patients. A 2-year delay can occur between onset of symptoms and diagnosis (12); however, new treatment modalities have been determined to improve the prognosis of this disease (11). In addition to the use of anticoagulants and vasodilators, atrial septostomy, and lung transplants as therapeutic approaches for various pulmonary hypertension entities (8--12,35,39--41), clinical trials since 2000 have demonstrated therapeutic efficacy with prostaglandins and endothelin antagonists for pulmonary arterial hypertension (37,42). Correct diagnosis of the distinct disease entities of pulmonary hypertension provides direction for management of the underlying disease (39,43) and is imperative to prevent a treatment regimen that might worsen the condition or create serious sequelae (3). Disease assessment includes physical examination, electrocardiogram, echocardiogram, chest radiograph, ventilation-perfusion scintigraphy, and other assessments (2,4,10,11,43). Limitations develop as the symptoms become worse, particularly for symptoms of other comorbid conditions. For example, among patients with HIV, symptoms related to pulmonary hypertension might overshadow the overall clinical problems of these patients (44). In addition, pulmonary hypertension might increase the risk for complications and death during pregnancy (45--47). ConclusionThe high proportion of pulmonary hypertension--related deaths and hospitalizations that occurred among adults aged >65 years suggested that as the proportion of older adults in the U.S. population increases, pulmonary hypertension might continue to be a more frequent diagnosis, particularly with concomitant chronic heart failure. Because the majority of patients with pulmonary hypertension are older adults, the burden of chronic disability and morbidity on the Medicare system and families will increase. Prevention efforts, including broad-based public health efforts to increase awareness of pulmonary hypertension and to foster appropriate diagnostic evaluation and timely treatment from health-care providers, should be considered. The science base for the etiology, pathogenesis, and complications of pulmonary hypertension disease entities must be further investigated to improve prevention, treatment, and case management. Additional epidemiologic initiatives also are needed to ascertain the prevalence and incidence of the various disease entities. Although multiple predisposing factors and associated conditions have been identified for pulmonary hypertension, the causal roles and strengths of association have not been well established (38,48). Therefore, it is not possible to establish preventive measures regarding risk factor reduction. However, attention should be focused on the following key areas: identifying the initiation of disease, discovering a common link between known and emerging causal factors, exploring associations between suspected variables and the disease, and identifying prevention efforts. Acknowledgments The authors acknowledge the comments, suggestions, and insights provided by the scientific leadership of the Pulmonary Hypertension Association. References
Table 1 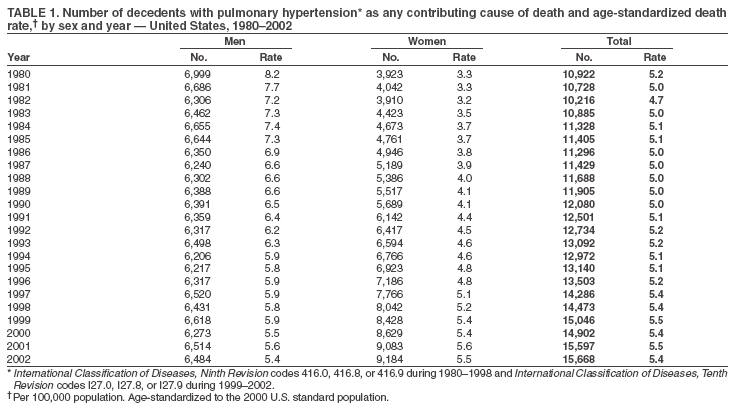 Return to top. Figure 1 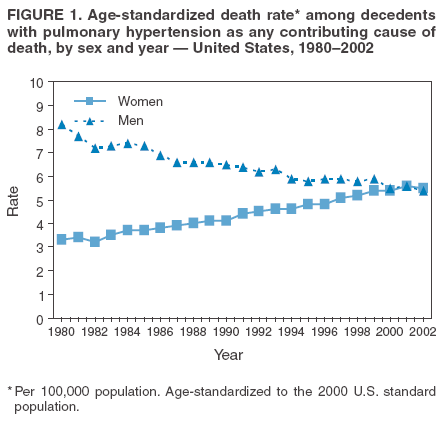 Return to top. Table 2 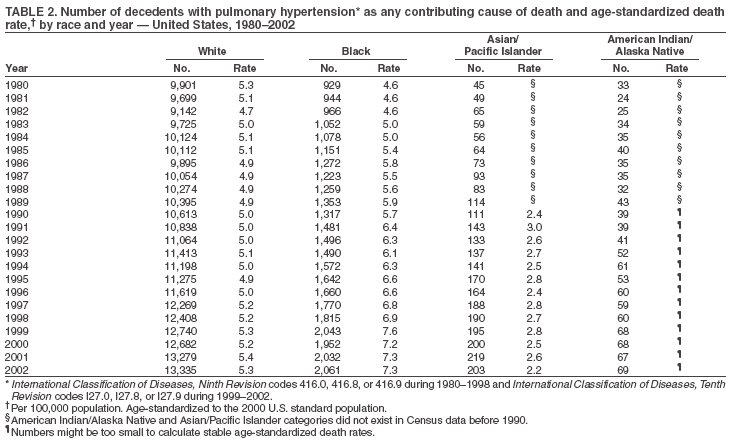 Return to top. Figure 2 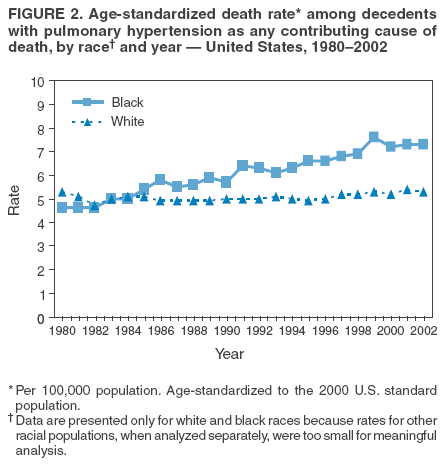 Return to top. Table 3 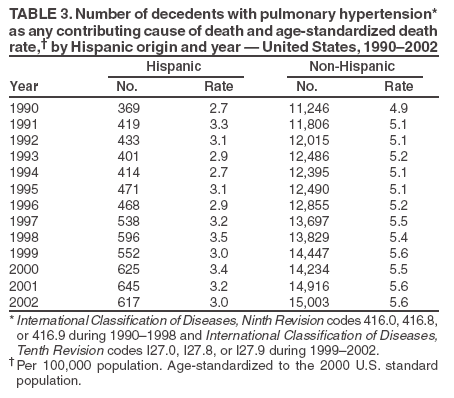 Return to top. Figure 3 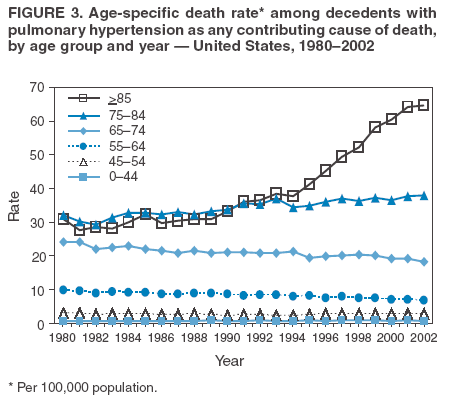 Return to top. Table 4 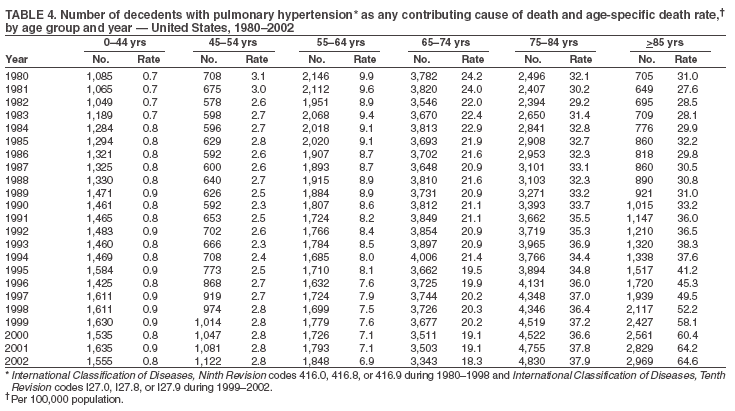 Return to top. Figure 4 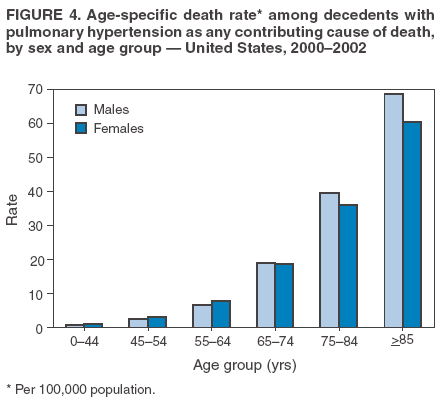 Return to top. Table 5 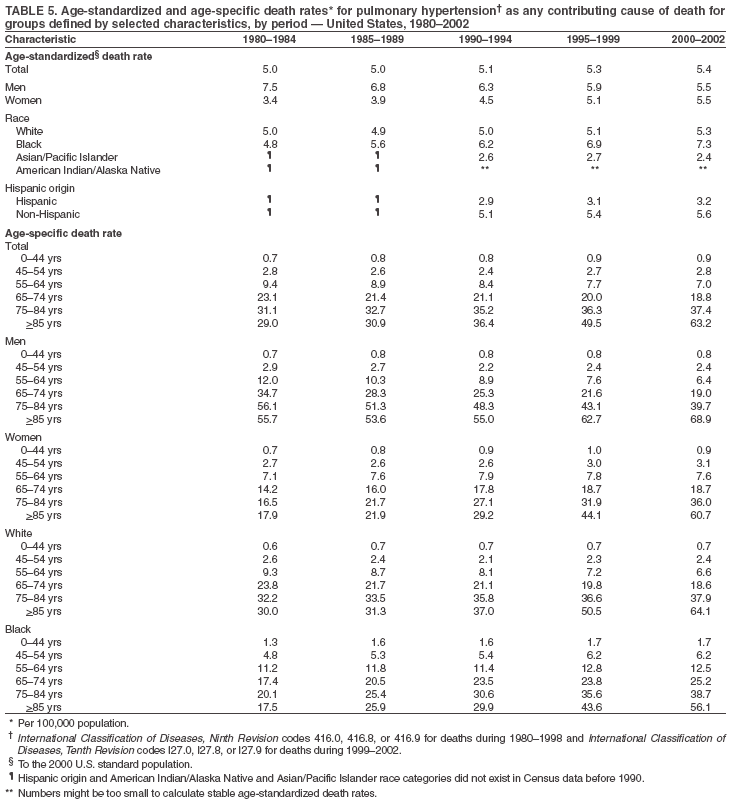 Return to top. Figure 5 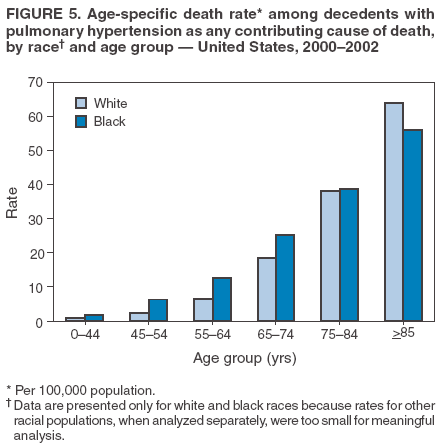 Return to top. Table 6 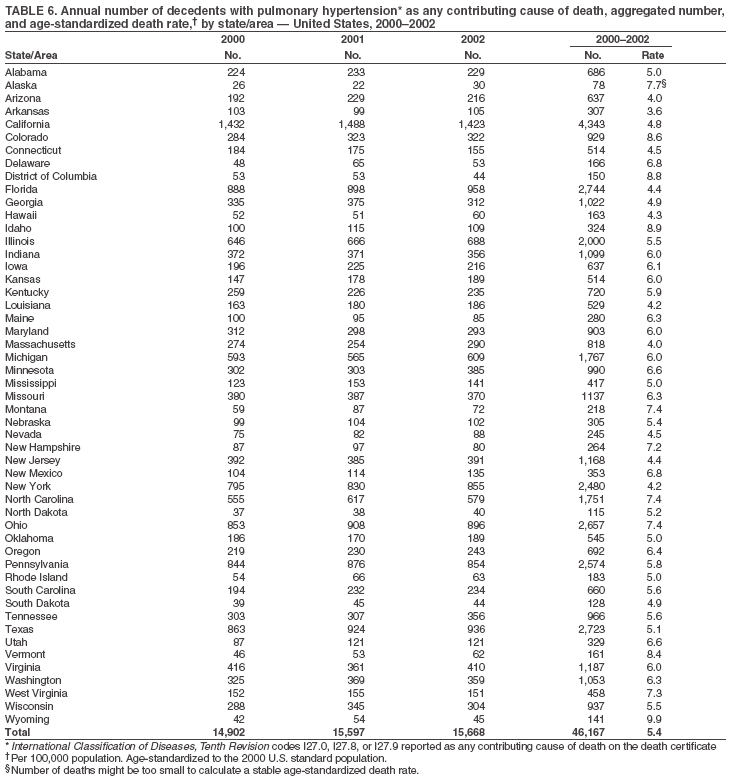 Return to top. Figure 6 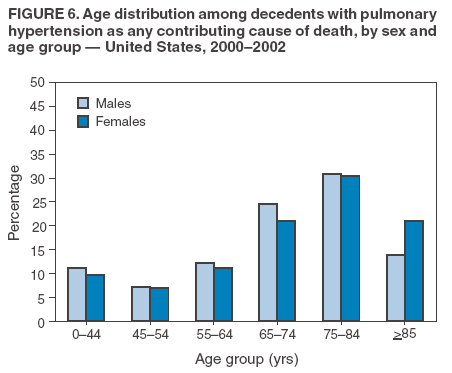 Return to top. Table 7 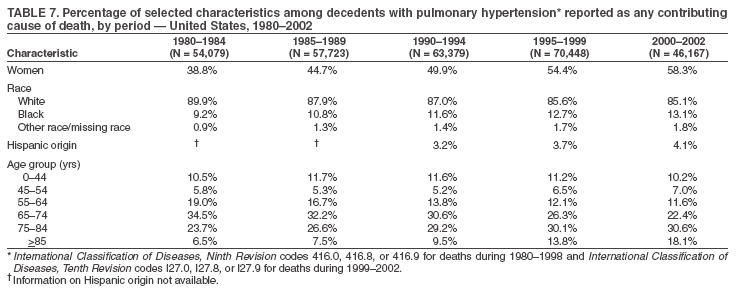 Return to top. Figure 7 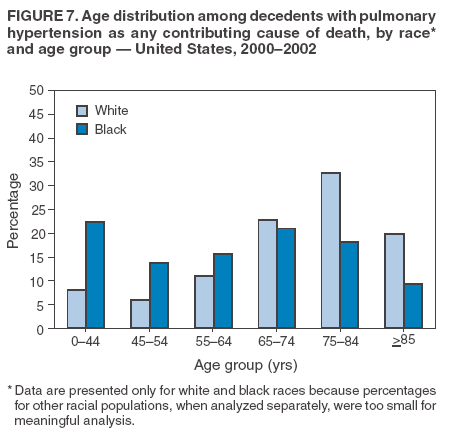 Return to top. Table 8 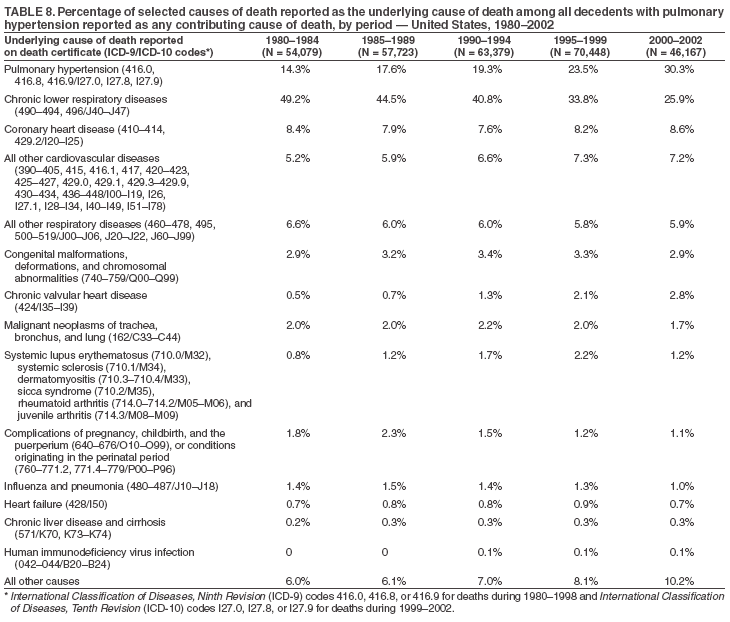 Return to top. Figure 8 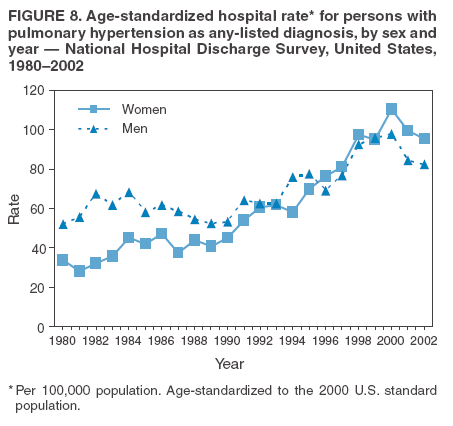 Return to top. Table 9 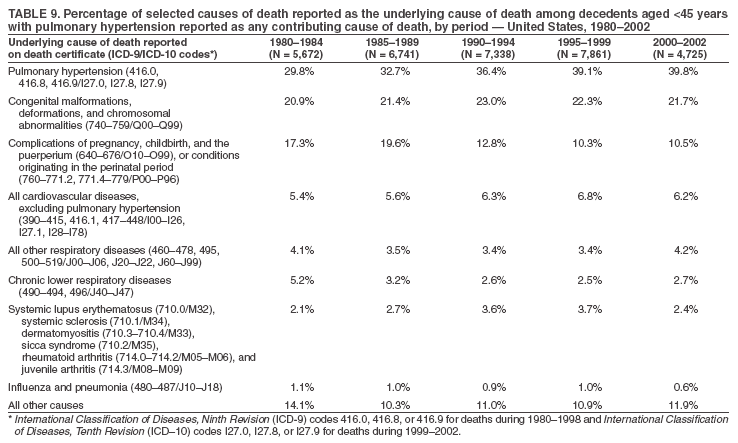 Return to top. Figure 9 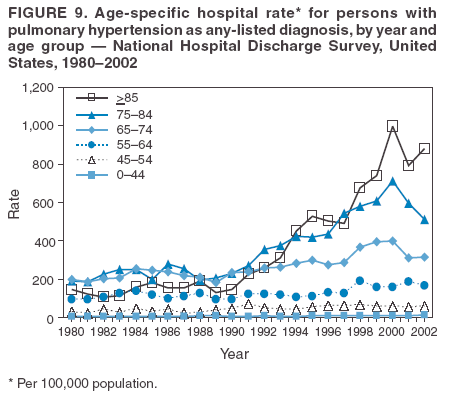 Return to top. Table 10 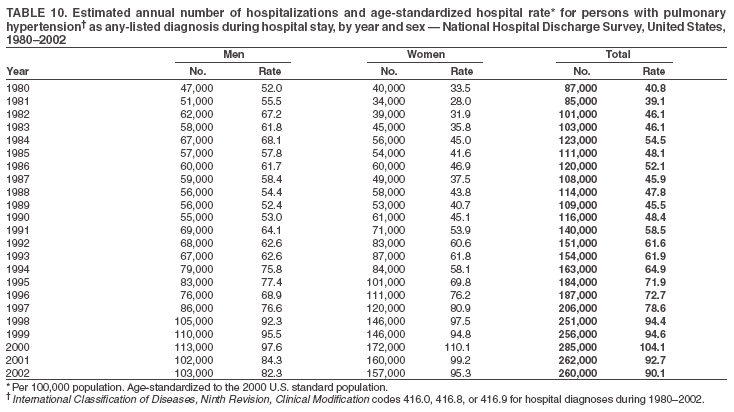 Return to top. Figure 10 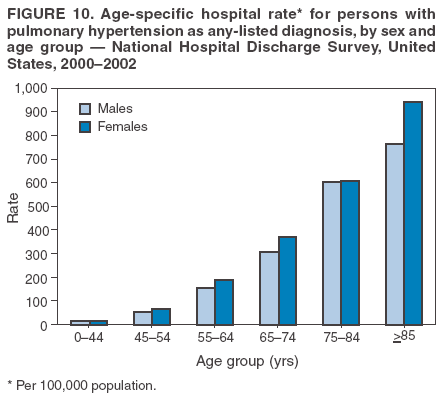 Return to top. Table 11 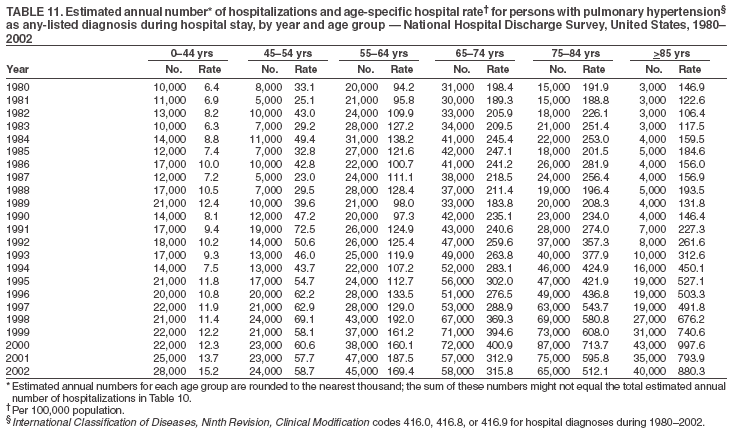 Return to top. Figure 11 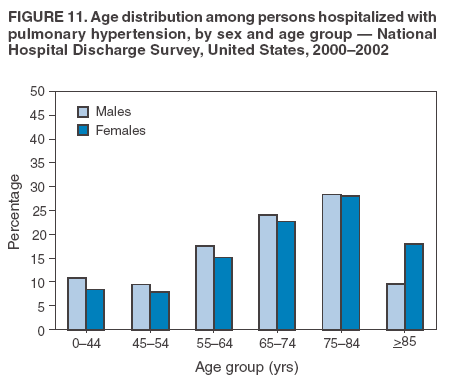 Return to top. Table 12 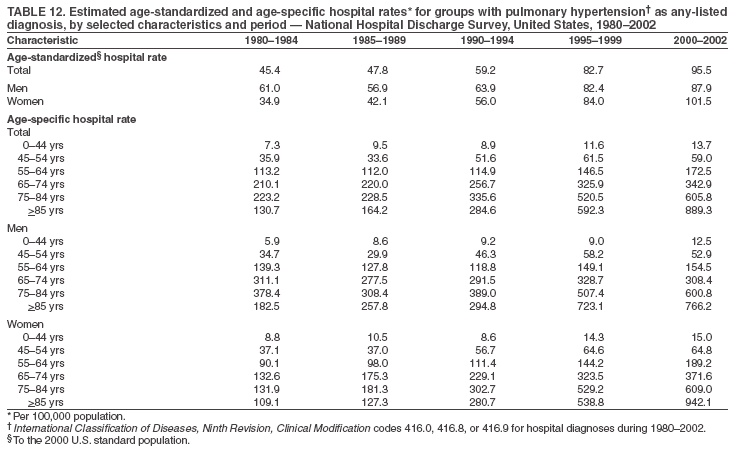 Return to top. Figure 12 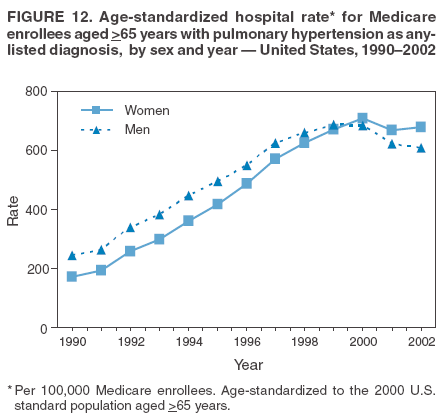 Return to top. Table 13 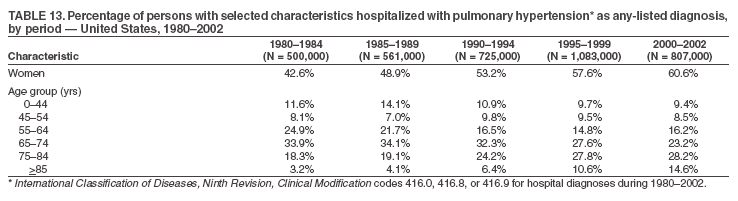 Return to top. Figure 13 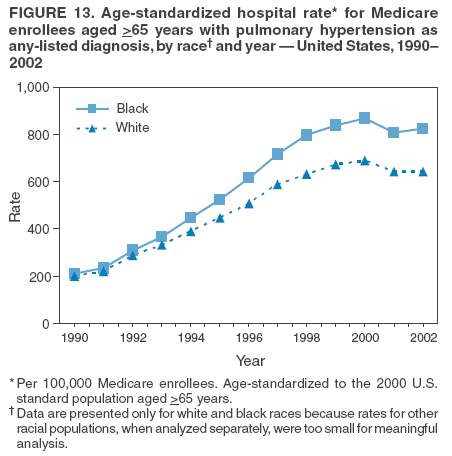 Return to top. Table 14 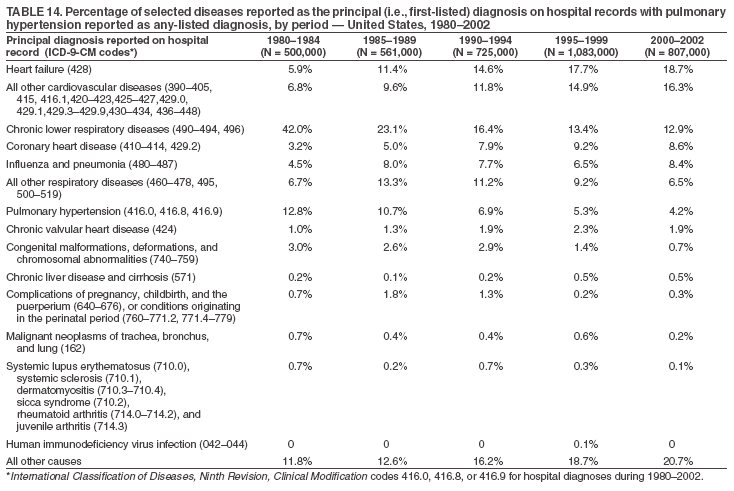 Return to top. Figure 14 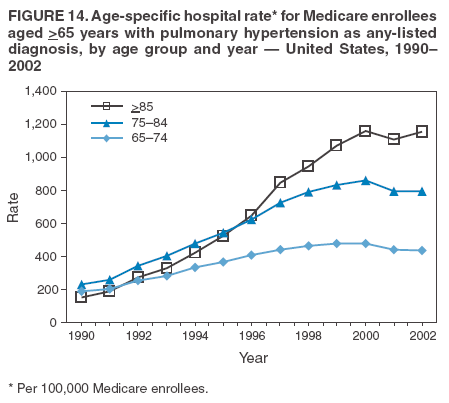 Return to top. Table 15 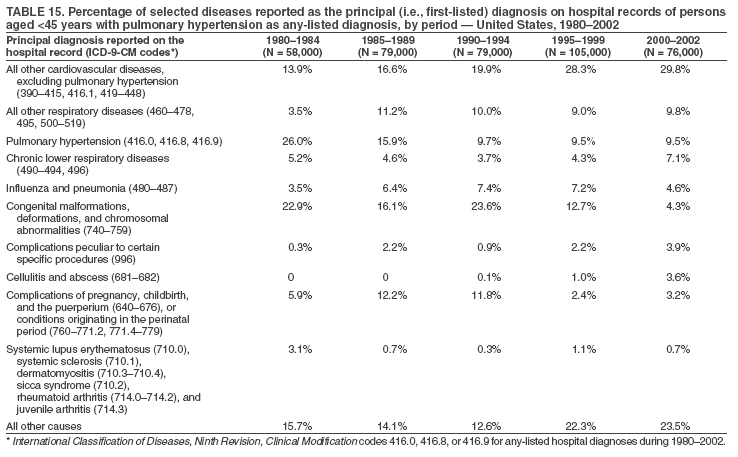 Return to top. Table 16 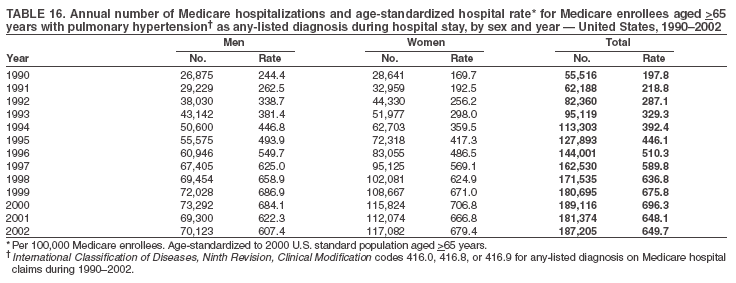 Return to top. Table 17 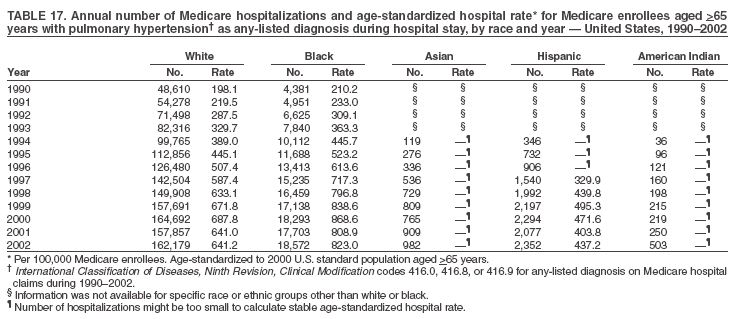 Return to top. Table 18 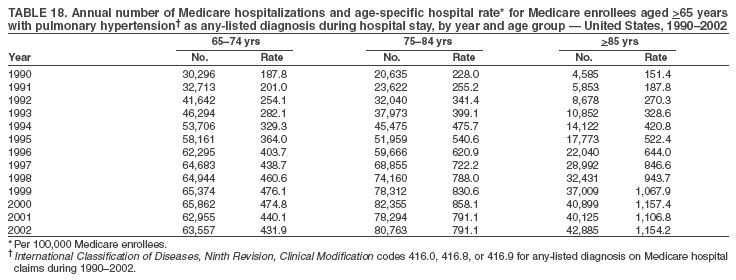 Return to top. Table 19 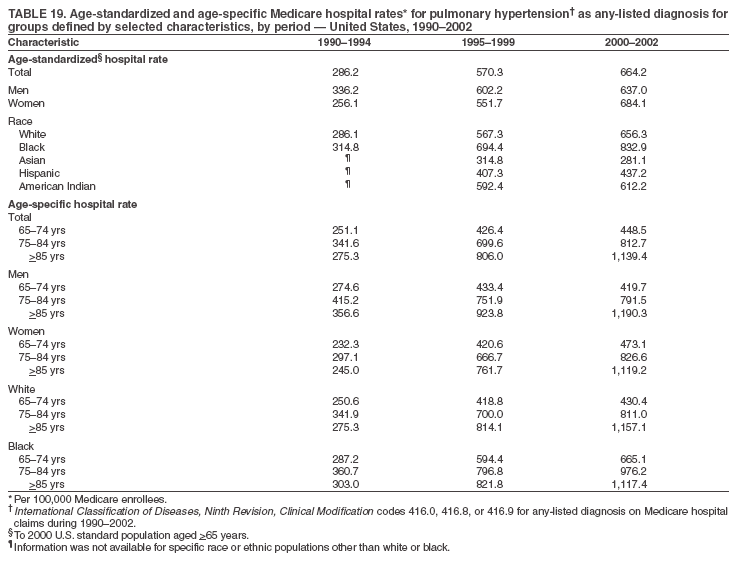 Return to top. Table 20 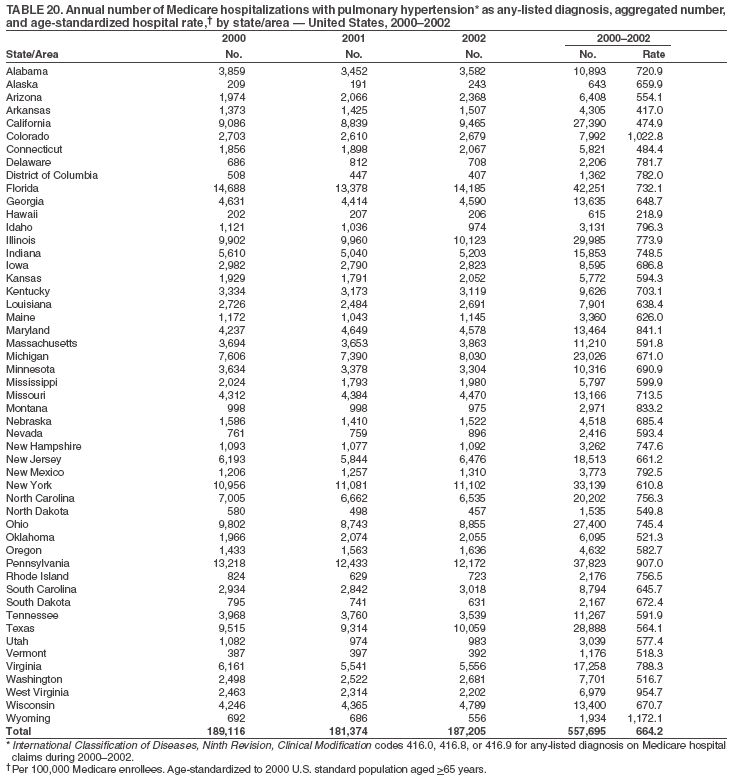 Return to top. Table 21 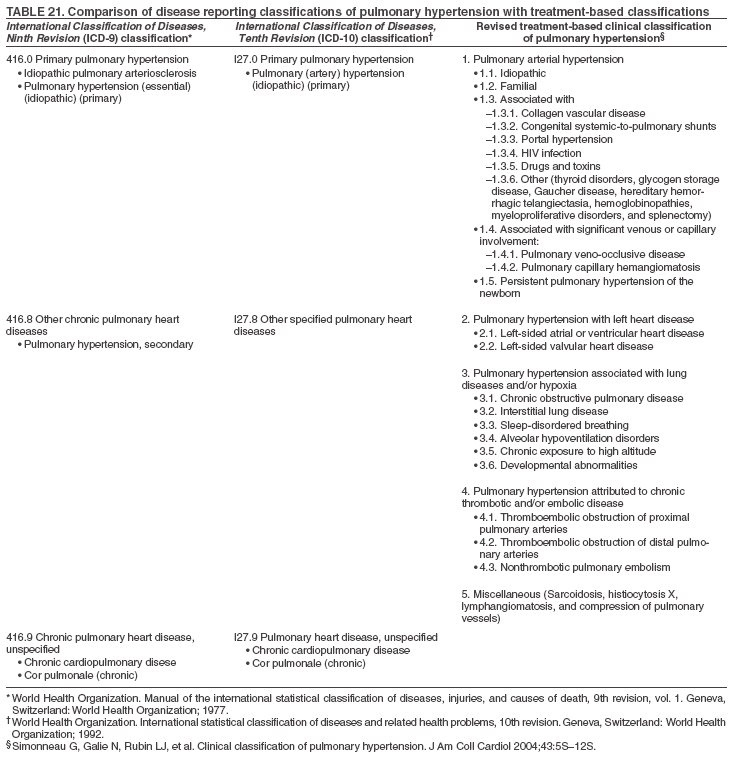 Return to top.
Disclaimer All MMWR HTML versions of articles are electronic conversions from ASCII text into HTML. This conversion may have resulted in character translation or format errors in the HTML version. Users should not rely on this HTML document, but are referred to the electronic PDF version and/or the original MMWR paper copy for the official text, figures, and tables. An original paper copy of this issue can be obtained from the Superintendent of Documents, U.S. Government Printing Office (GPO), Washington, DC 20402-9371; telephone: (202) 512-1800. Contact GPO for current prices. **Questions or messages regarding errors in formatting should be addressed to mmwrq@cdc.gov.Date last reviewed: 10/26/2005 |
|||||||||
|