 |
|
|
|
|
|
|
| ||||||||||
|
|
|
|
|
|
|
||||
| ||||||||||
|
|
|
|
|
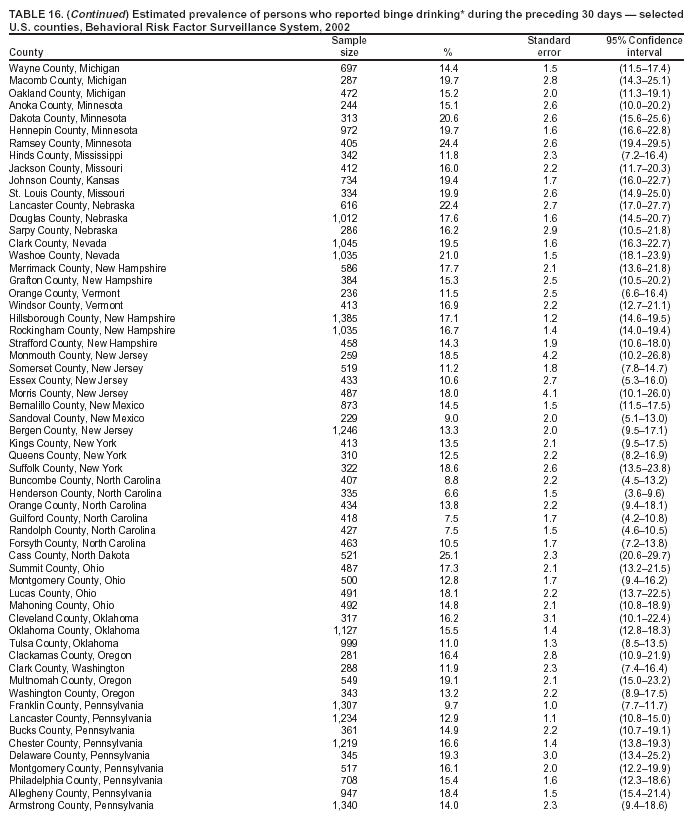
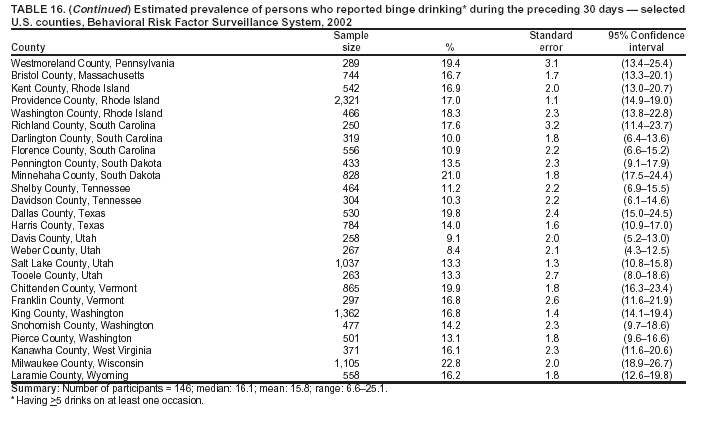
Persons using assistive technology might not be able to fully access information in this file. For assistance, please send e-mail to: mmwrq@cdc.gov. Type 508 Accommodation and the title of the report in the subject line of e-mail. Surveillance for Certain Health Behaviors Among Selected Local Areas --- United States, Behavioral Risk Factor Surveillance System, 2002Lina Balluz, Sc.D. Problem: Monitoring risk behaviors for chronic diseases and participation in preventive practices are important for developing effective health education and intervention programs to prevent morbidity and mortality. Therefore, continual monitoring of these behaviors and practices at the state, city, and county levels can assist public health programs in evaluating and monitoring progress toward improving their community's health. Reporting Period Covered: Data collected in 2002 are presented for states, selected metropolitan, and micropolitan statistical areas (MMSA), and their counties. Description of the System: The Behavioral Risk Factor Surveillance System (BRFSS) is an on-going, state-based, telephone survey of the civilian, noninstitutionalized population aged >18 years. All 50 states, the District of Columbia (DC), Guam, the Virgin Islands, and the Commonwealth of Puerto Rico participated in BRFSS during 2002. Metropolitan and MMSA and their counties with >500 respondents or a minimum sample size of 19 per weighting class were included in the analyses for a total of 98 MMSA and 146 counties. Results: Prevalence of high-risk behaviors for chronic diseases, awareness of certain medical conditions, and use of preventive health-care services varied substantially by state, county, and MMSA. Obesity ranged from 27.6% in West Virginia, 29.4% in Charleston, West Virginia, and 32.0% in Florence County, South Carolina, to 16.5% in Colorado, 12.8% in Bethesda-Frederick-Gaithersburg, Maryland, and 11.8% in Washington County, Rhode Island. No leisure-time physical activity ranged from 33.6% in Tennessee, 36.8% in Miami-Miami Beach-Kendall, Florida, and 36.8% in Miami-Dade County, Florida to 15.0% in Washington, 13.8% in Seattle-Bellevue-Everett Washington, and 11.4% in King County, Washington. Cigarette smoking ranged from 32.6% in Kentucky, 32.8% in Youngstown-Warren-Boardman, Ohio-Pennsylvania, and 31.1% in Jefferson County, Kentucky to 16.4% in California, 13.8% in Ogden-Clearfield, Utah, and 10.9% in Davis County, Utah. Binge drinking ranged from 24.9% in Wisconsin, 26.1% in Fargo, North Dakota-Minnesota, and 25.1% Cass County, North Dakota, to 7.9% in Kentucky, 8.2% in Greensboro-High Point, North Carolina, and 6.6% in Henderson County, North Carolina. At risk for heavy drinking ranged from 8.7% in Arizona, 9.5% in Lebanon, New Hampshire-Vermont, and 11.3% in Richland County, South Carolina, to 2.8% in Utah, 1.9% in Ogden-Clearfield, Utah, and 1.7% in King County, New York. Adults who were told they had diabetes ranged from 10.2% in West Virginia, 11.1% in Charleston, West Virginia, and 11.1% in Richland, South Carolina, to 3.5% in Alaska, 2.7% in Anchorage, Alaska, and 2.4% in Weber County, Utah. Percentage of adults aged >50 years who were ever screened for colorectal cancer ranged from 64.8% in Minnesota, 67.9% in Minneapolis-St. Paul-Bloomington Minnesota-Wisconsin, and 73.6% in Ramsey County, Minnesota, to 39.2% in Hawaii, 30.7% in Kahului-Wailuku, Hawaii, and 30.7% in Maui County, Hawaii. Persons aged >65 years who had received pneumococcal vaccine ranged from 72.5% in North Dakota, 74.8% in Minneapolis-St. Paul-Bloomington, Minnesota-Wisconsin, and 73.1% in Milwaukee County, Wisconsin, to 47.9% in DC, 47.5% in New York-Wayne-White Plains, New York, New Jersey, and 47.9% in DC County, DC. Older adults who had received influenza vaccine ranged from 76.6% in Minnesota, 80.0% in Minneapolis-St. Paul-Bloomington, Minnesota-Wisconsin, and 76.3% in Middlesex County, Massachusetts, to 57.0% in Florida, 55.8% in Houston-Baytown-Sugar Land, Texas, and 56.2% in Cook County, Illinois. Interpretation: BRFSS data indicate substantial variation in high-risk behaviors, participation in preventive health-care services, and screening among U.S. adults at states and selected local areas, indicating a need for continued efforts to evaluate public health programs or policies designed to reduce morbidity and mortality. Public Health Actions: Data from BRFSS are useful in developing and guiding public health programs and policies. Therefore, states, selected MMSA, and their counties can use BRFSS data as a tool to prevent premature morbidity and mortality among adult population and to assess progress toward national health objectives. The data indicate a continued need to develop and implement health promotion programs for targeting specific behaviors and practices and serve as a baseline for future surveillance at the local level in the United States. IntroductionReducing the impact of and increasing screening for diseases are among the goals of Healthy People 2010 (1). Certain behaviors (e.g., no participation in physical activity, smoking cigarettes, and excessive alcohol consumption) contribute to chronic diseases in the United States. Morbidity and mortality can be reduced by participation in healthy behaviors and by timely use of preventive health-care services (2--6). The Behavioral Risk Factor Surveillance System (BRFSS) is an ongoing, state-based surveillance system and a key source for information on health-risk behavior, preventive health practices, and access to health care. BRFSS has been a unique source of risk behavior data since 1984. The growth in BRFSS sample size facilitates calculation of selected metropolitan and micropolitan statistical areas (MMSA) and county estimates. The report provides 2002 prevalence estimates for selected risk factors by geographic location that allow comparisons at the state and local level and assesses progress toward national goals. The reliability and validity of measures of BRFSS and new challenges facing this increasingly complex system have been previously described (7,8). Prevalence estimates of risk factors for chronic diseases, awareness of certain medical conditions that place persons at risk for developing diseases, screening practices, and vaccination coverage are provided for 2002 to examine disease-related behaviors and practices at the state, selected MMSA, and their county levels. MethodsBRFSS is a cross-sectional telephone survey conducted by the state health departments with assistance from CDC. BRFSS uses a multistage design based on random-digit--dialing methods to select a representative sample from each state's noninstitutionalized civilian population aged >18 years (n = 247,964). The BRFSS questionnaire consists primarily of questions about personal behaviors that increase risk for one or more of the 10 leading causes of death in the United States. This report includes data from states, selected MMSA, and their counties in the 50 states and the District of Columbia (DC) with a sample size of >500 respondents or 19 per weighting class, a total of 98 MMSA and 146 counties. Statistics for selected cities and counties were reported as not available if the denominator was <50 or the confidence interval half width was >10. Statistics for certain women's health concerns also were not reported because of limited cell sizes. QuestionnaireThe 2002 BRFSS questionnaire included core questions related to health status, health-care access, exercise, eating of fruit and vegetables, asthma, diabetes, oral health, vaccination, tobacco use, alcohol consumption, seat belt use, family planning, use of firearms, women's health, prostate cancer screening, colorectal cancer screening, and human immunodeficiency virus/acquired immunodeficiency syndrome (HIV/AIDS). In addition, states selected some of the following optional modules: diabetes (48 states), arthritis (30), childhood asthma (25), tobacco indicators (25), healthy days (22), quality of life (21), adult asthma history (19), physical activity (19), weight control (15), cholesterol awareness (14), hypertension awareness (12), health-care coverage (10), heart attack and stroke (10), cardiovascular disease (eight), and effects of the September 11 attack (two). Measures used in this report include cigarette smoking; alcohol use; patterns for chronic and binge drinking; participation in leisure-time physical activity; risk for being overweight; diabetes; colorectal cancer screening; two types of vaccinations for persons aged >65 years; and, for women, measures of mammography and Papanicolaou (PAP) smears. Data Collection and ProcessingBRFSS data are collected monthly during the interviewing period in each state. Data are sent to CDC after the monthly interviewing cycle ends, where they are checked for reliability. A computer-assisted telephone interviewing (CATI) system was used in 54 states and territories in 2002. Data Weighting and AnalysisCDC edits and aggregates the monthly data files to create a yearly sample for each state. That file is weighted to the respondent's probability of being selected and the age-, race- and sex-specific population from the 2002 census for each state. These weights are used to calculate the state prevalence estimates. Starting in 2000, the final state-level weights were adjusted to reflect the adult population for each metropolitan area, producing metropolitan-level weights. The metropolitan-level weight is used to generate metropolitan estimates. To adjust the final state-level weights, the state-level poststratification adjustment factor was first removed from the BRFSS weighting formula, leaving the true design weight. Respondents located in metropolitan areas were then assigned to weighting classes. Within each metropolitan area, weighting classes were based on either age/sex cross-classification totals or age/sex/race cross-classification totals, depending on whether the state the metropolitan area is located in an area that uses race in their original state-level poststratification. A minimum sample size of 19 was used for each weighting class, and weighting classes were collapsed if sample sizes were <19. Within each weighting class, a single adjustment factor was applied to all respondents that forced the sum of the design weights to equal the metropolitan population total for that weighting class. For each respondent, the new metropolitan-level weight is the product of the design weight and the metropolitan-level post-stratification adjustment factor. Metropolitan areas were defined by the Bureau of the Census as metropolitan statistical areas (MSAs). For this report, MSA is referred to as MMSA. The largest MSAs are known as consolidated metropolitan statistical areas (CMSAs). A CMSA is an area in the United States that is recognized as an MSA, has a population >1 million persons, and can be separated into component areas. These component areas are referred to as the primary metropolitan statistical areas (PMSAs). Metropolitan areas are defined by a collection of towns and cities for the New England states instead of by counties. Therefore, the Census Bureau has defined New England County metropolitan areas (NECMAs) in New England as an alternative to MSAs. NECMAs, PMSAs, and MSAs are included in the list of candidate analysis areas. The list was restricted to NECMAs, PMSAs, and MSAs with >500 respondents in the BRFSS data. This minimized the amount of weight class collapsing. Respondents located in rural counties or metropolitan areas with <300 respondents were not included in the reweighting. SAS® and SUDAAN® were used in the analyses to account for the complex sampling design and calculate the standard errors and 95% confidence intervals (9,10). In 2002, the number of interviews completed ranged from 805 in Guam to 12,759 in Pennsylvania, and the response rates ranged from 42.2% in New Jersey to 82.6% in Minnesota based on Council of American Survey and Research Organizations guidelines and from 66.4% in New Jersey to 99.8% in Minnesota for cooperation rate. BRFSS has good data quality, and when BRFSS data are compared with census data , BRFSS data have a minimal bias. Bias estimates in 2000 were lower compared with BRFSS data collected in 1995, when the response rates were higher (7). In addition, when BRFSS data are compared with other surveys, these data are reliable and valid (8). ResultsThe findings in this report indicate that none of the states met the Healthy People 2010 (1) objective for obesity among adults aged >20 years (15%) and binge drinking (6%). For the other indicators, certain states have met the objective, and others are at or above the target level. BRFSS data indicate a greater variation among cities and counties compared with states. Certain cities and counties have met the 2010 objectives (Table 1). Risk Factors for Chronic DiseasesOverweight and Obesity Self-reported weight and height were used to calculate body mass index (BMI) (weight [kg]/height [m2]). Participants were classified as obese if their BMI was >30. Overweight was classified as BMI >25. In 2002, prevalence of overweight adults ranged from 63.7% (95% CI = 61.7--65.7) in West Virginia to 52.7% (95% CI = 50.0--55.4) in DC (median: 58.9%) (Table 2). The prevalence of overweight for selected MMSA ranged from 66.4% (95% CI = 62.1--70.6) in Memphis, Tennessee/Mississippi/Arkansas to 50.1% (95% CI = 45.9--54.3) in Bethesda-Frederick-Gaithersburg, Maryland (median: 57.5%) (Table 3) and for counties from 67.2% (95% CI = 61.4--73.0) in Darlington County, South Carolina, to 46.5% (95% CI = 38.7--54.3) in Orange County, North Carolina (median: 56.9%) (Table 4). The prevalence of adults aged >20 years who were obese (BMI of >30) varied by state and ranged from 27.6% (95% CI = 25.8--29.4) in West Virginia to 16.5% (95% CI = 15.0--17.9) in Colorado (median: 22.2%) (Table 5). For all selected MMSA, obesity prevalence ranged from 29.4% (95% CI = 25.0--33.9) in Charleston, West Virginia, to 12.8% (95% CI = 10.2--15.4) in Bethesda/Frederick/Gaithersburg, Maryland (median: 21.0%) (Table 6) and for counties from 32.0% (95% CI = 25.9--38.1) in Florence County, South Carolina, to 11.8% (95% CI = 8.6--15.0) in Washington County, Rhode Island (median: 20.5%) (Table 7). No Leisure-Time Physical Activity Leisure-time physical activity was measured by the extent of respondent's participation in exercise (e.g., running, calisthenics, golf, gardening, or walking) during the preceding month. The prevalence estimate is presented for those respondents who did not participate in leisure-time activity. In 2002, the prevalence of no participation in leisure-time physical activity ranged from 33.6% (95% CI = 31.6--35.6) in Tennessee to 15% (95% CI = 13.6--16.4) in Washington (median: 24.4%) (Table 8). For all selected MMSA, prevalence of no participation in leisure-time physical activity ranged from 36.8% (95% CI = 32.3--41.2) in Miami-Miami Beach-Kendal, Florida, to 13.8% (95% CI = 11.8--15.7) in Seattle-Bellevue-Everett, Washington (median: 23.0%) (Table 9) and for counties from 36.8% (95% CI = 32.3--41.2) in Miami-Dade County, Florida, to 11.4% (95% CI = 9.3--13.4) King County, Washington (median: 22.5%) (Table 10). Cigarette Smoking Respondents were asked about former and current smoking behaviors. Respondents who had smoked >100 cigarettes in their lifetime and now smoked were classified as current smokers. In 2002, the prevalence of adults who were current cigarette smokers ranged from 32.6% (95% CI = 30.8--34.4) in Kentucky to 16.4% (95% CI = 15.0--17.8) in California (median: 23.1) (Table 11). For all selected MMSA, the prevalence of current cigarette smokers ranged from 32.8% (95% CI = 25.6--40.0) in Youngstown-Warren-Boardman, Ohio-Pennsylvania to 13.8% (95% CI = 10.5--17.1) in Ogden-Clearfield, Utah (median: 22.7%) (Table 12), and for counties the prevalence range from 31.1% (95% CI = 24.3--37.8) in Jefferson County, Kentucky, to 10.9% (95% CI = 6.7--15.1) in Davis County, Utah (median: 22.3%) (Table 13). Binge Drinking Respondents were asked about the consumption of alcoholic beverages during the preceding 30 days. Binge drinking was defined as having >5 drinks on at least one occasion during the preceding month. In 2002, the percentages for adults who reported binge drinking ranged from 24.9% (95% CI = 23.3--26.5) in Wisconsin to 7.9% (95% CI = 6.5--9.3) in Kentucky (median: 16.1%) (Table 14). The prevalence for binge drinking for selected MMSA ranged from 26.1% (95% CI = 21.0--31.2) for Fargo, North Dakota-Minnesota, to 8.2% (95% CI = 5.1--11.3) in Greensboro-Highpoint, North Carolina (median: 16.0%) (Table 15) and for counties from 25.1% (95% CI = 20.6--29.7) for Cass County, North Dakota, to 6.6% (95% CI = 3.6--9.6) for Henderson County, North Carolina (median: 16.1%) (Table 16). Heavy Drinking At risk for heavy drinking was defined as an average of >2 drinks/day during the preceding month for men and an average of >1 drink/day during the preceding month for women. In 2002, the percentages for adults who were at risk for heavy drinking ranged from 8.7% (95% CI = 6.7--10.7) in Arizona to 2.8% (95% CI = 2.2--3.4) in Utah (median: 5.9%) (Table 17). The prevalence of heavy drinking in selected MMSA range from 9.5% (95% CI = 6.7--12.3) in Lebanon, New Hampshire-Vermont, to 1.9% (95% CI = 0.6--3.2) in Ogden-Clearfield, Utah (median: 5.8%) (Table 18), and for counties the prevalence ranged from 11.3% (95% CI = 5.9--16.7) in Richland County, South Carolina, to 1.7% (95% CI = 0.4--2.9) in King County, New York (median: 5.8%) (Table 19). Awareness of Certain Medical ConditionsDiabetes Diabetes was defined as a positive response to the question, "Have you ever been told by a doctor that you have diabetes." Specific classification of diabetes (e.g., type 1 or type 2) was not assessed. In 2002, the percentage of persons told they had diabetes ranged from 10.2% (95% CI = 9.0--11.4) in West Virginia to 3.5% (95% CI = 2.7--4.3) in Alaska (median: 6.8%) (Table 20). The prevalence for selected MMSA ranged from 11.1% (95% CI = 8.1--14.1) in Charleston, West Virginia, to 2.7% (95% CI = 1.4--4.0) in Anchorage, Alaska (median: 6.2%) (Table 21), and for counties the prevalence ranged from 11.1% (95% CI = 6.7--15.5) in Richland County, South Carolina to 2.4% (95% CI = 0.8--4.0) in Weber County, Utah (median: 6.0%) (Table 22). Colorectal Cancer Screening Respondents aged >50 years were asked if they had ever had a sigmoidoscopy or colonoscopy examination. The percentage who ever had one of these examinations varied from 64.8% (95% CI = 62.4--67.2) in Minnesota to 39.2% (95% CI = 36.7--41.7) in Hawaii (median: 48.1%) (Table 23). For the selected MMSA, the prevalence ranged from 67.9% (95% CI = 64.7--71.1) in Minneapolis-St. Paul-Bloomington, Minnesota-Wisconsin, to 30.7 % (95% CI = 26.1--35.3) in Kahului-Wailuku, Hawaii (median: 50.3%) (Table 24), and by county, the prevalence ranged from 73.6% (95% CI = 66.9--80.4) in Ramsey County, Minnesota, to 30.7% (95% CI = 26.1--35.3) in Maui County, Hawaii (median: 51.3%) (Table 25). Another measure of colorectal cancer screening is the fecal occult blood test. Respondents aged >50 years were asked if they have used a home kit to test for blood in the stool during the preceding 2 years. In 2002, the percentage who responded yes ranged from 33.4% (95% CI = 30.3--36.5) in Maine to 12.2% (95% CI = 10.0--14.4) in Utah (median: 20.9%) (Table 26). For the selected MMSA, the range was from 44.2% (95% CI = 35.2--53.3) in Winston-Salem, North Carolina, to 8.8% (95% CI = 4.2--13.4) in Ogden-Clearfield, Utah (median: 23.5) (Table 27) and for the counties, the prevalence of those who had the test ranged from 44.2% (95% CI = 36.6--51.8) in Forsyth County, North Carolina, to 7.9% (95% CI = 2.6--13.2) in Weber County, Utah (median: 24.7%) (Table 28). VaccinationInfluenza Vaccination The percentage of influenza vaccination coverage among respondents aged >65 years during the preceding 12 months ranged from 76.6% (95% CI = 73.7--79.5) in Minnesota to 57% (95% CI = 54.3--59.7) in Florida (median: 68.5%) (Table 29). The prevalence for selected MMSA ranged from 80.0% (95% CI = 76.0--84.0) in Minneapolis-St. Paul-Bloomington, Minnesota-Wisconsin, to 55.8% (95% CI = 46.0--65.6) in Houston-Baytown-Sugar Land, Texas (median: 69.9%) (Table 30) and for counties the prevalence of influenza vaccination coverage ranged from 76.3% (95% CI = 70.5--82.2) in Middlesex County, Massachusetts, to 56.2% (95%CI = 49.5--63.0) in Cook county, Illinois (median: 70.5%) (Table 31). Pneumococcal Vaccination In 2002, the percentage of pneumococcal vaccine coverage among respondents aged >65 years ranged from 72.5% (95% CI = 68.6--76.4) in North Dakota to 47.9% (95% CI = 42.0--53.8) in DC (median: 63.0%) (Table 32). The prevalence for selected MMSA ranged from 74.8% (95% CI = 70.3--79.3) in Minneapolis-St. Paul-Bloomington, Minnesota-Wisconsin to 47.5% (95% CI = 41.3--53.6) in New York-Wayne-White Plains, New York-New Jersey (median: 63.4%) (Table 33), and for counties, the prevalence of pneumococcal vaccine coverage ranged from 73.1% (95% CI = 64.9--81.3) in Milwaukee County, Wisconsin, to 47.9% (95%CI = 41.9--53.9) in DC (median: 63.2%) (Table 34). Women's Health ConcernsCervical Cancer Screening In 2002, the percentage of women aged >18 years with an intact cervix who had ever had a Pap smear ranged from 97.6% (95% CI = 96.4--98.8) in Delaware to 89.7% (95% CI = 87.2--92.2) in Utah (Table 35). For selected MMSA, the prevalence of women aged >18 years who had ever had a Pap smear ranged from 95.5% (95% CI = 93.7--97.4) in Washington-Arlington-Alexandria, DC-Virginia-Maryland-West Virginia to 89.1% (95% CI = 86.5--91.6) in New York-Wayne-White Plains, New York-New Jersey (median: 94.4%) (Table 36) and for counties from 94.5% (95% CI = 93.0--95.9) in Honolulu County, Hawaii, to 93.3% (95% CI = 91.3--95.3) in Providence County, Rhode Island (median: 3.9%) (Table 37). Breast Cancer Screening In 2002, the percentage of women aged >40 years who had had a mammogram in their lifetime ranged from 94.1% (95% CI = 92.7--95.5) in Rhode Island to 84.8% in New Mexico (median: 88.9%) (Table 38). The prevalence for selected MMSA ranged from 94.4% (95% CI = 93.2--95.5) in Providence-New Bedford-Fall River, Rhode Island-Massachusetts, to 83.5% (95% CI = 79.0--88.0) in Kahului-Wailuku, Hawaii (median: 90%) (Table 39). For selected counties, the percentage of women who had a mammogram ranged from 93.3% (95% CI = 91.5--95.1) in Providence County, Rhode Island, to 83.5% (95% CI = 79.0--88.0) in Maui County, Hawaii (median: 88.0%) (Table 40). The percentage of women aged >40 years who had a mammogram during the preceding 2 years ranged from 85.4% (95% CI = 83.4--87.4) in Rhode Island to 67.0% (95% CI = 64.6--69.4) in Idaho (Table 41). The prevalence for selected MMSA ranged from 85.8% (95% CI = 84.0--87.6) in Providence-New Bedford-Fall River, Rhode Island-Massachusetts, to 65.4% (95% CI = 59.9--70.8) in Kahului-Wailuku, Hawaii (median: 76.9%) (Table 42) and for selected counties from 87.1% (95% CI = 83.3--91.0) in Bristol County, Massachusetts, to 64.1% (95% CI = 56.0--72.1) in Canyon County, Idaho (median: 77.1%) (Table 43). The percentage of women aged >40 years who had ever had a clinical breast examination ranged from 96.5% (95% CI = 95.5--97.5) in Minnesota to 87.3% (95% CI = 85.3--89.3) in Tennessee (Table 44). The prevalence for selected MMSA ranged from 93.6% (95% CI = 90.8--96.5) in Washington-Arlington-Alexandria, DC-Virginia-West Virginia, to 85.7% (95% CI = 82.5--88.9) in New York-Wayne-White Plains, New York-New Jersey (median: 92.8) (Table 45), and for selected counties the prevalence ranged from 93.1% (95% CI = 91.3--95.0) in Honolulu County, Hawaii, to 88.4% (95% CI = 80.8--95.9) in Armstrong County, Pennsylvania (median: 89.4%) (Table 46). DiscussionThe findings in this report document variations in the prevalence of key health risk behaviors and preventive screening practices among U.S. adults at the state and local level. This is the first time that BRFSS data at the local level were available to generate state and local level estimates. BRFSS local estimates can be used by public health officials to better plan and direct their prevention efforts and to support targeted program implementation and evaluation. In addition, these data can be used by policymakers at states and local levels to assess their own needs and progress toward their own goals. The data in this report demonstrate variations in the prevalence of selected chronic disease-related behaviors and preventive practices among states, selected MMSA, and their counties. Variation among states, MMSA, and their counties might reflect differences in the composition of the populations, availability of health services, socioeconomic factors, state laws or local ordinances, and reimbursement for preventive screening. Obesity and overweight increase the risks for morbidity from hypertension, diabetes, coronary heart disease, stroke, arthritis, and different cancers among other conditions (5). BRFSS data indicate that obesity and overweight continue to be problems in the United States and that no state had met the Healthy People 2010 objective of reducing obesity to 15%. As a result, programs are needed to prevent and control overweight and obesity at the state, city, and county levels. Lack of physical activity is another behavior that increases the risk for chronic diseases. The prevalence of no leisure-time physical activity varies at state, selected MMSA, and their county levels. Therefore, to increase physical activity, communities should develop comprehensive programs that include activities suitable for their local context and new population characteristics (4). Cigarette smoking also causes substantial morbidity and mortality in the United States (2). Despite local tobacco-control programs and the decline in cigarette smoking during 1991--2001, the prevalence of cigarette smoking continues to be high in certain states, selected MMSA, and their counties. Therefore, continued comprehensive smoking cessation efforts are needed (11). Binge drinking leads to serious health consequences, and excessive alcohol use is associated with health conditions such as liver diseases, hypertension, heart disease, stroke, and motor vehicle accidents (3). In 2002, more adults reported binge drinking than being at risk for chronic drinking. BRFSS data indicate a need to develop special targeted interventions to prevent alcohol-related health consequences at both the individual and community level (3). Colon cancer is the second leading cause of cancer deaths in the United States. In 2003, an estimated 147,500 new cases of colon cancer will be diagnosed in the United States, and 57,100 persons will die of the disease (12). Early detection of colon cancer might result in initiation of treatment in the early stages of the disease (13). Two tests used to screen for colorectal cancer are the sigmoidscopy or colonoscopy and use of a home administered fecal occult blood test (FOTB). Pneumonia and influenza are important causes of morbidity and mortality among the elderly. In 2002, none of the states, MMSA, or counties met the Healthy People 2010 objective of 90% vaccination coverage against these illnesses for persons aged >65 years. BRFSS addresses multiple screening practices for women's health. Pap smears and mammograms are conducted routinely to screen women for cervical and breast cancers. In 2002, an estimated 13,000 new cases of cervical cancer will be diagnosed, and 4,100 women will die. In addition, an estimated 203,500 new cases of invasive breast cancer will be diagnosed, and 40,000 women will die of the disease (12). Early detection and treatment can lead to decreases in associated morbidity and mortality from these two conditions. The findings in this report indicate that, in 2002, a high proportion of women aged >18 years reported ever having had a Pap smear test during the preceding 3 years (median 95%). In addition, breast cancer screening for women aged >40 years was high (median 76%). The findings in this report are subject to at least two limitations. First, BRFSS is a telephone-based survey and misses that segment of the population without telephones. Second, data are self-reported and, for certain behaviors, prevalence estimates might be underestimated. Despite these limitations, BRFSS is a cost-effective and timely telephone survey at the state and local levels. The reliability and validity of BRFSS data has been assessed and tested through comparison with data from a similar survey (8). Despite the challenges to the BRFSS system, which include the needs of numerous programs that use BRFSS data and adopting new methods of data collection in response to changing telecommunication technology, the growth in BRFSS sample size facilitates production of selected metropolitan/micropolitan areas risk trends. BRFSS data helps guide health promotion activities at the state and local level. Variations in the prevalence of selected health behaviors were observed when local areas were compared with their surrounding areas and with the rest of the state. This variation reflects differences in the composition of the populations, availability of health services, and socioeconomic factors. Although certain states, cities, and counties have achieved progress toward the 2010 national health objectives, others remain below the targets. Therefore, data collected by BRFSS will enable local health department to plan their activities better, allocate their limited resources, and plan and direct their prevention efforts. References
2002 Behavioral Risk Factor Surveillance System State and Territory Project Coordinators Alabama, Sondra Reese, M.P.H.; Alaska, Jill Hughes-Richey, Ph.D.; Arizona, Brian Bender, M.B.A.; Arkansas, Neha Thakkar; California, Bonnie Davis, Ph.D.; Colorado, Becky Rosenblatt; Connecticut, Diane Aye, Ph.D.; Delaware, Fred Breukelman; District of Columbia; John Davies-Cole, Ph.D.; Florida, Marie Bailey, M.S.W.; Georgia, Linda Martin, M.S.; Guam, Cynthia Naval, M.S.; Hawaii, Florentina Reyes-Salvail, M.S.; Idaho, Kathy Simplot; Illinois, Bruce Steiner, M.S.; Indiana, Linda Stemnock; Iowa, Donald Shepherd, Ph.D.; Kansas, Mona Arnold; Kentucky, Tracey Sparks; Louisiana, Buddy Bates, M.S.P.H.; Maine, Judith Graber, M.S.; Maryland, Helio Lopez; Massachusetts, Zi Zhang, M.P.H.; Michigan, Harry McGee, M.P.H.; Minnesota, Nagi Salem, Ph.D.; Mississippi; Rou McAnally, Missouri; Jeannette Jackson-Thompson, Ph.D.; Montana, Joanne Oreskovich, Ph.D.; Nebraska, Larry Andelt, Ph.D.; Nevada, Emil DeJan, M.P.H.; New Hampshire; Andrew Chalsma, HSDM; New Jersey; Kenneth O'Dowd, Ph.D.; New Mexico, Wayne Honey, M.P.H.; New York, Colleen Baker, North Carolina, Ziya Gizlice, Ph.D.; North Dakota, Larry Shireley, M.P.H.; Ohio, Patricia (Pullen) Coss; Oklahoma, Derek Pate, M.P.H.; Oregon, Kathryn Pickle, M.P.H.; Pennsylvania, Linda Mann; Puerto Rico, Yvette Cintron, M.P.H.; Rhode Island, Jana Hesser, Ph.D.; South Carolina, Beili Dong, M.D.; South Dakota; Mark Gildemaster; Tennessee, David Ridings; Texas, Jimmy Blanton, M.P.A.; Utah; Kathy Marti; Vermont, Rodney McCormick, Ph.D.; Virgin Islands, Sharon William, M.S.; Virginia, Gerges Seifen, M.D.; Washington, Katrina Wynkoop Simmons, Ph.D.; West Virginia, Fred King; Wisconsin, Karl Pearson; Wyoming, Menlo Futa, M.A.; Texas, Jimmy Blanton, M.P.A.; Utah, Kathy Marti; Vermont, Rodney McCormick, Ph.D.; Virgin Islands, Sharon William, M.S.; Virginia, Gerges Seifen, M.D.; Washington, Katrina Wynkoop Simmons, Ph.D.; West Virginia, Fred King; Wisconsin, Karl Pearson; Wyoming; Menlo Futa, M.A.
2002 Behavioral Risk Factor Surveillance System Team Indu Ahluwalia, Ph.D.; Donna Ambler; Umed Ajani, M.D.; Lina Balluz, Sc.D.; Bill Bartoli; David Brown, M.P.H.; Julie Brown; Gloria J. Colclough; Sonal Doshi, M.P.H.; Cathy A. Douglas, Ph.D.; Evelyn Dunn; Temeika Fairly, Ph.D.; Earl Ford, M.D.; Melanie Gamble, M.P.H.; William S. Garvin, III; David Gilbertz; Jane Grimsley; Ronald N. Goodson, M.S.W.; Kimberly Howell; Ruth Jiles, Ph.D.; Kenneth J. Laliberte, M.P.A.; Karin A. Mack, Ph.D.; Kathleen Y. McDuffie, Ph.D.; Ali Mokdad, Ph.D.; Wil Murphy; Catherine Okoro, M.S.; Jim Ribble; Bill Scott; Ajay Sharma; Herbert Stackhouse, M.S.; Tara Strine, M.P.H.; Horace Thompson; Machell Town, M.Sc.; Stacy Young, M.P.H., Division of Adult and Community Health, National Center for Chronic Disease Prevention and Health Promotion, CDC, Atlanta, Georgia. Table 1 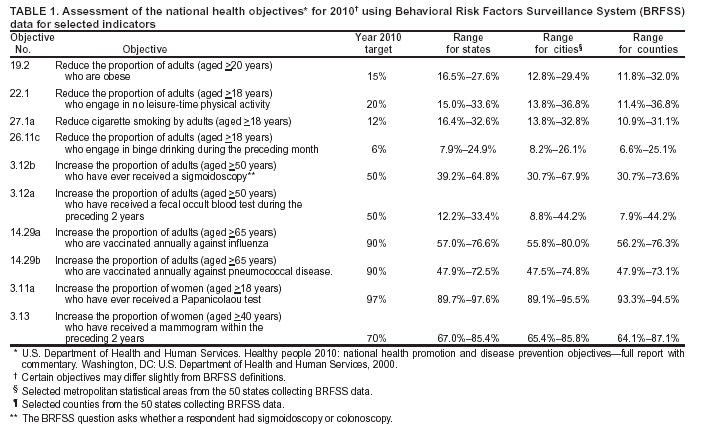 Return to top. Table 2 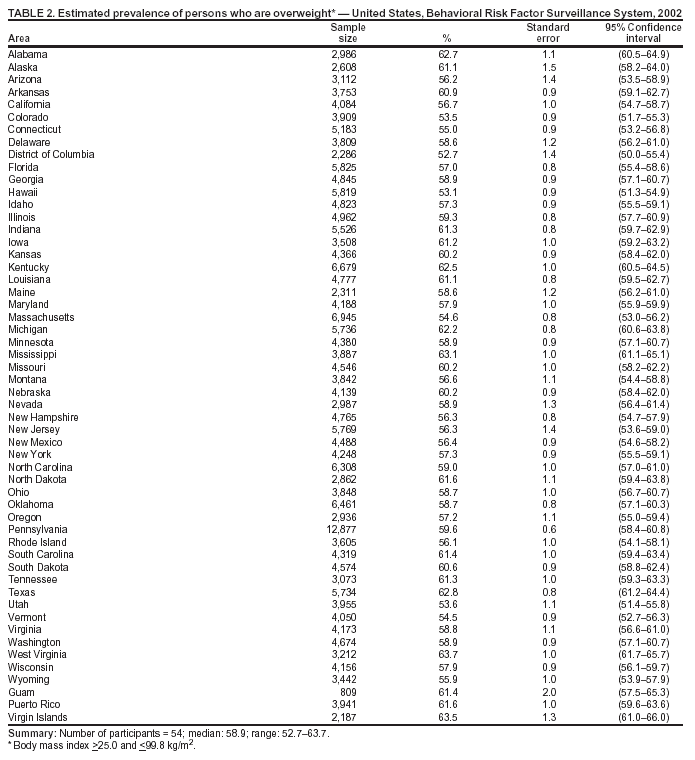 Return to top. Table 3 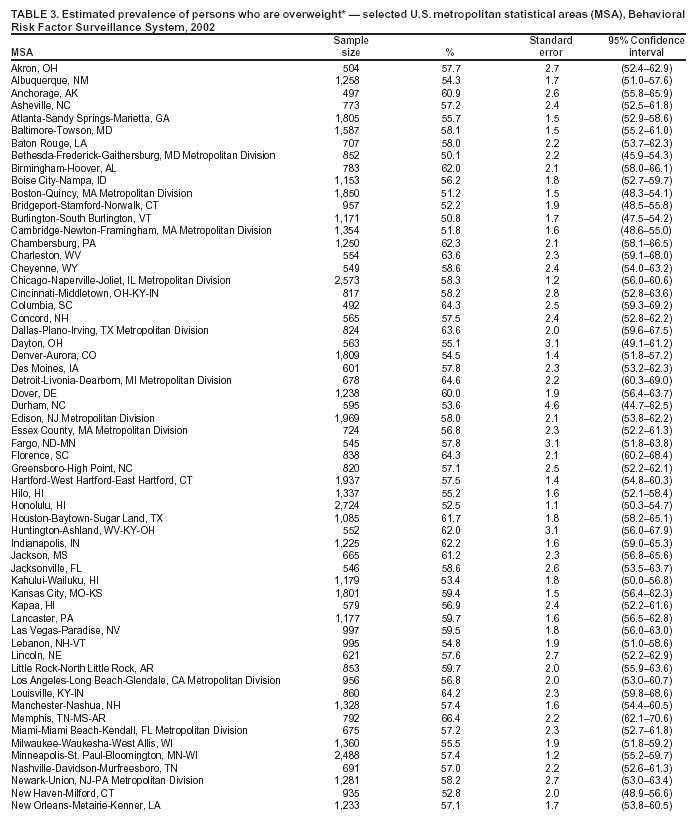 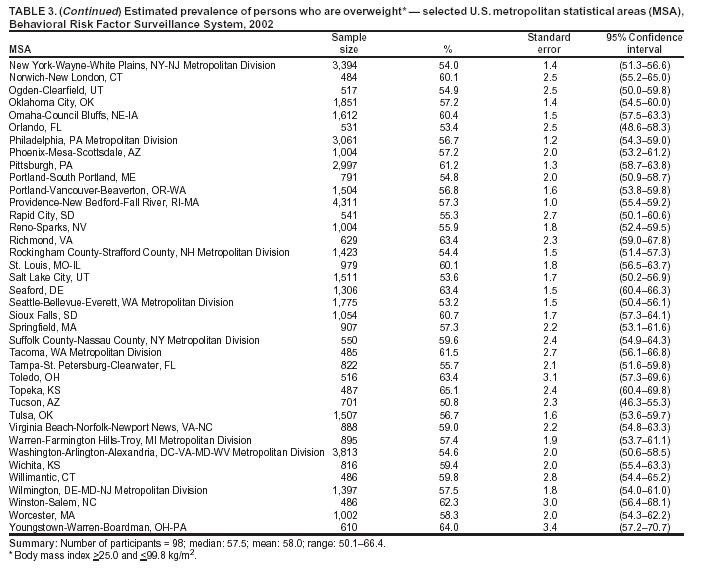 Return to top. Table 4  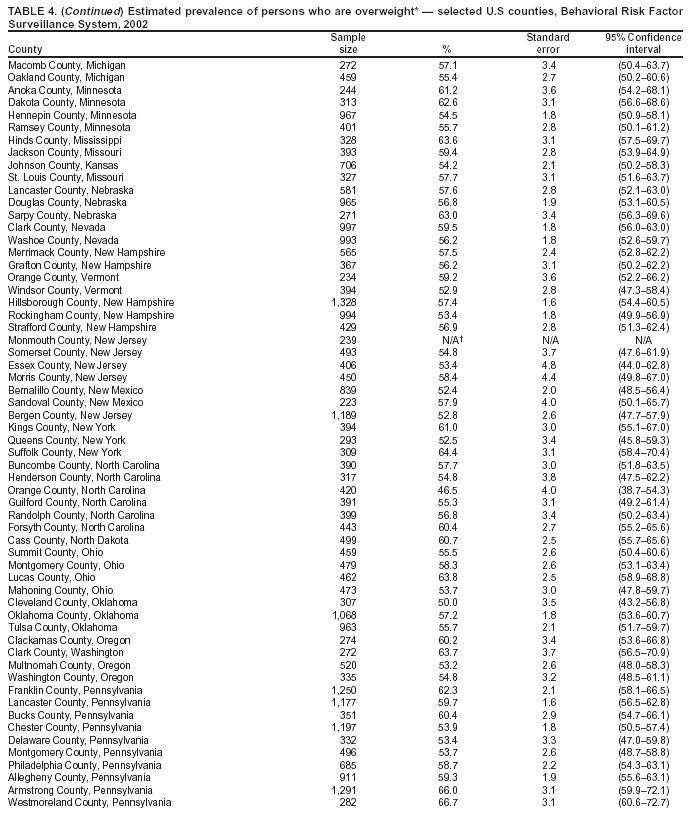 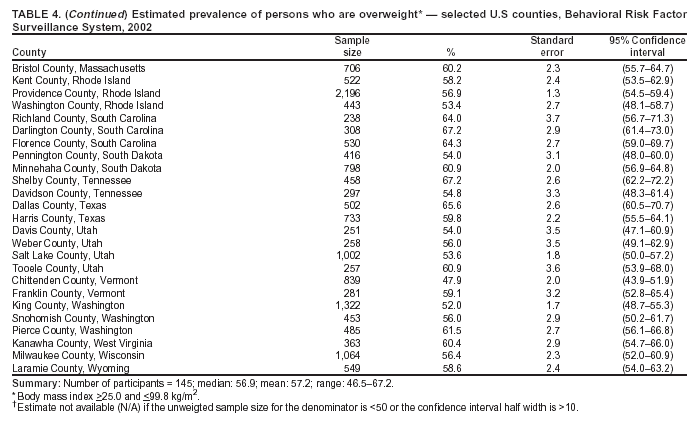 Return to top. Table 5 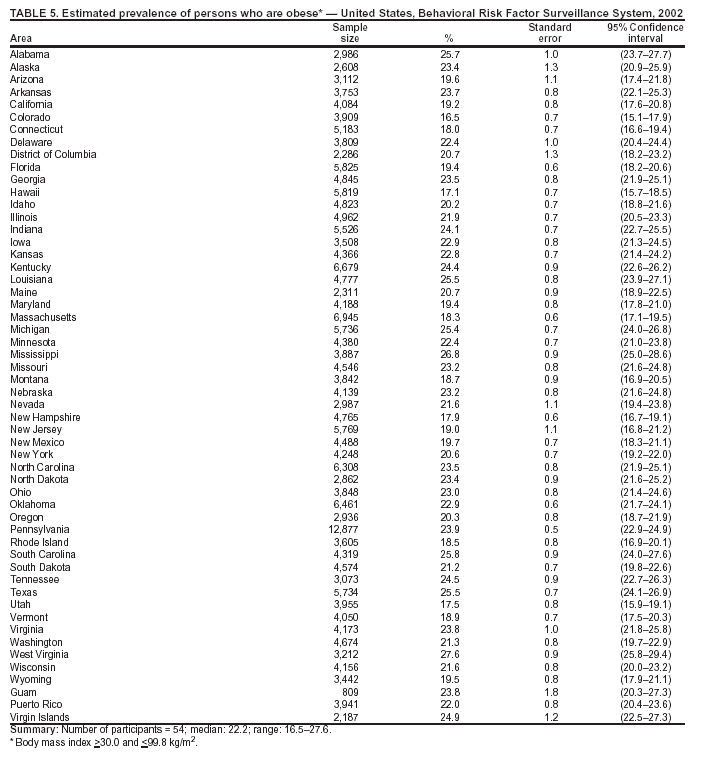 Return to top. Table 6 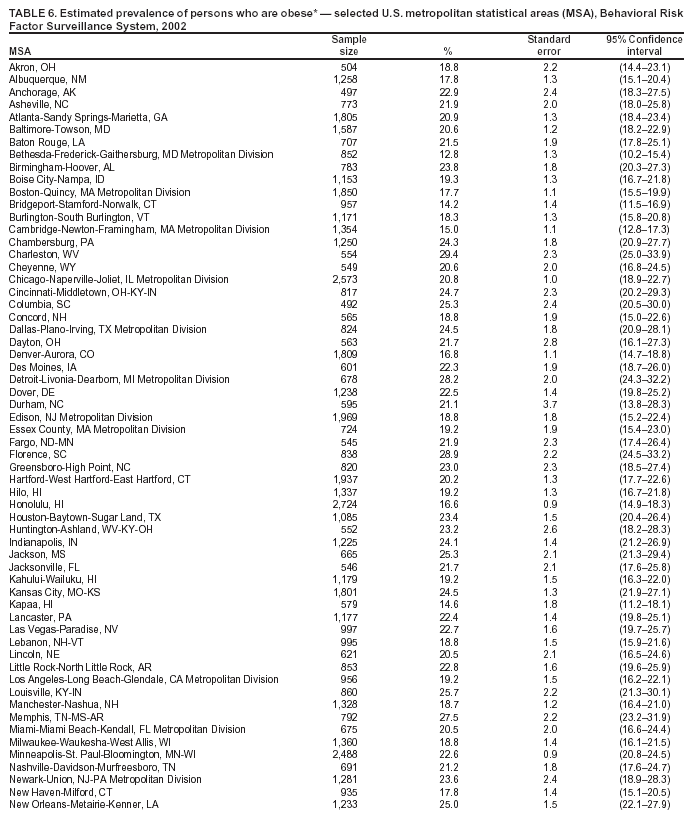 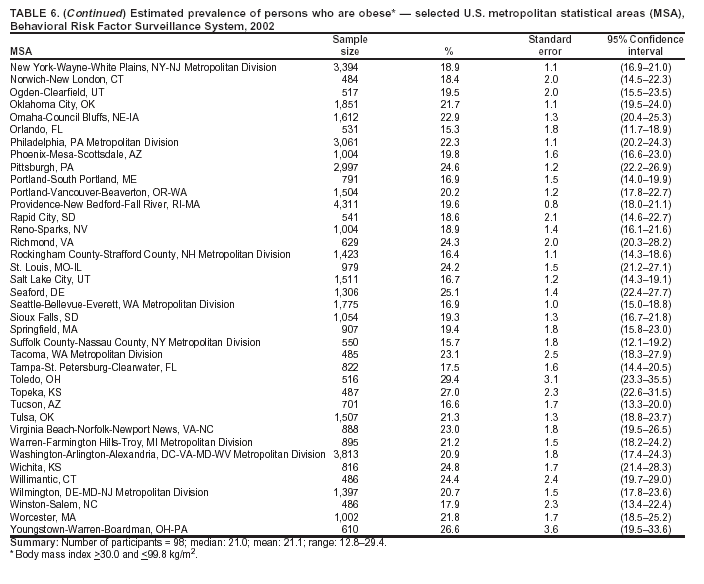 Return to top. Table 7 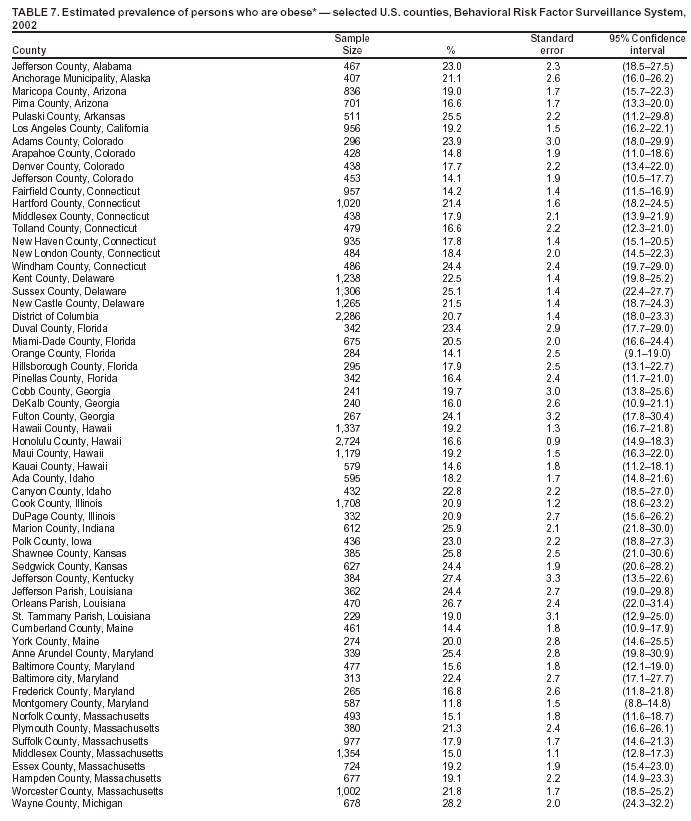 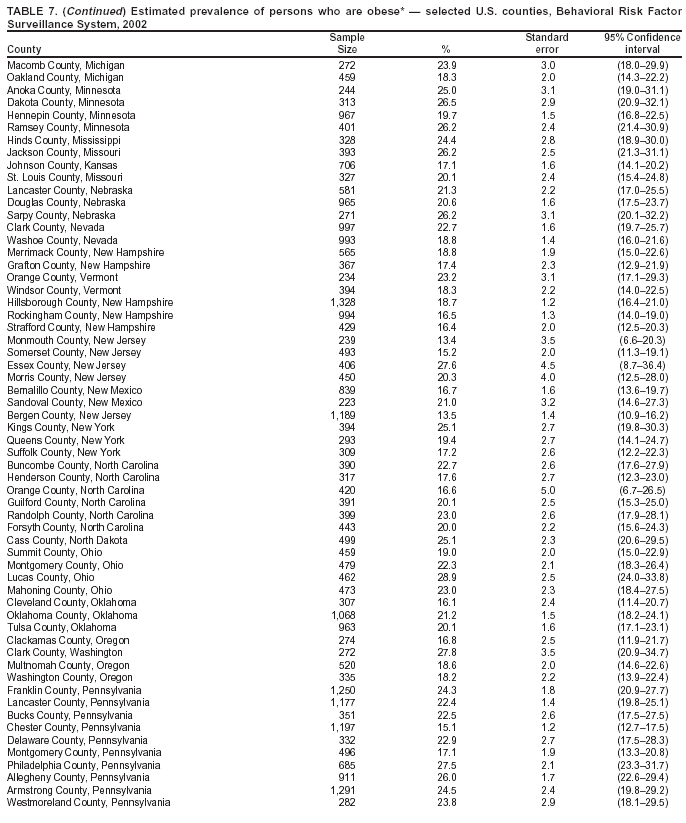 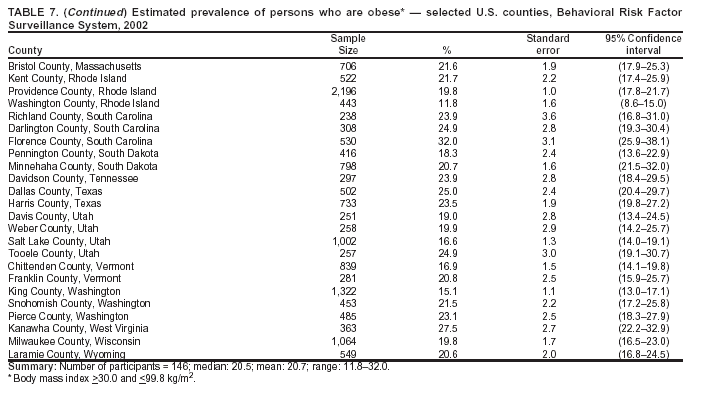 Return to top. Table 8 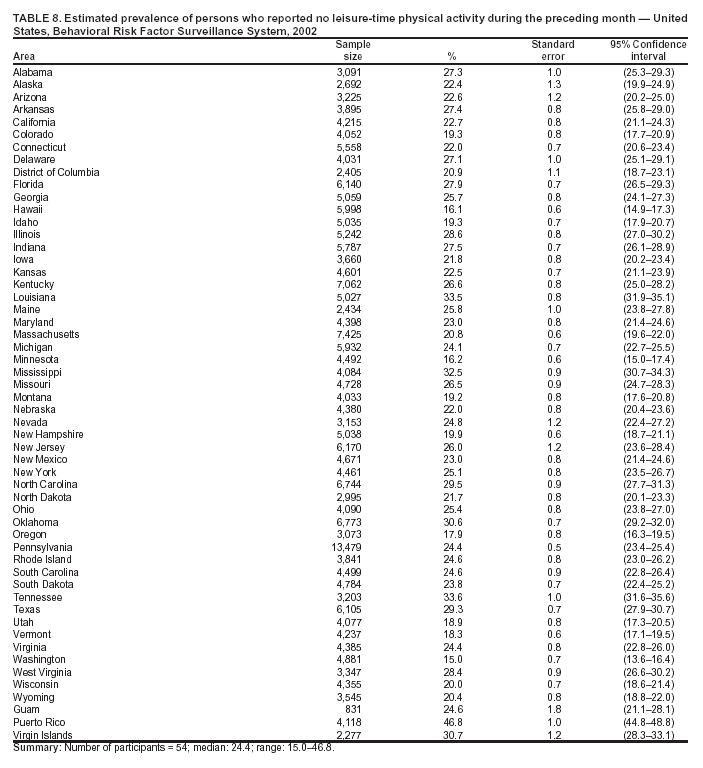 Return to top. Table 9 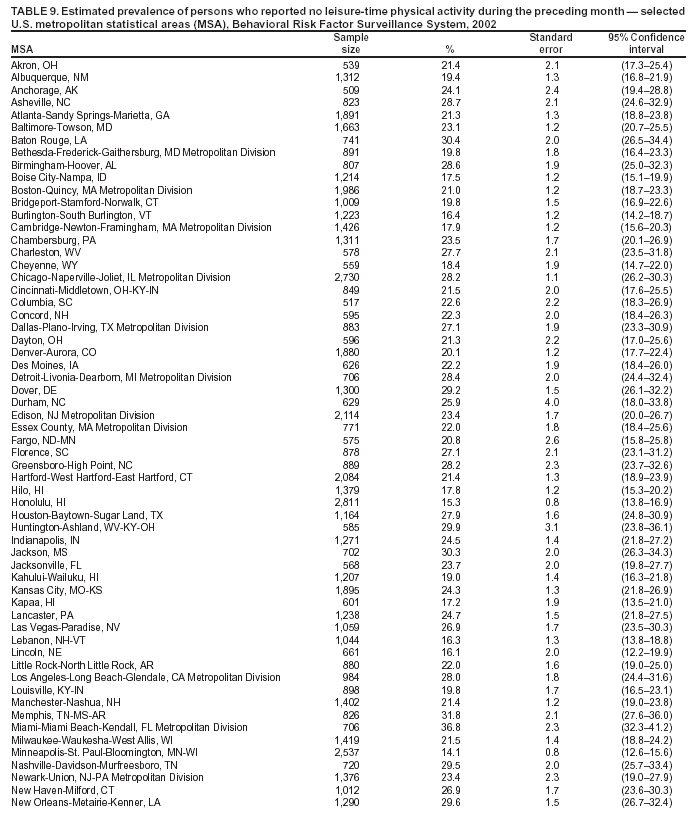 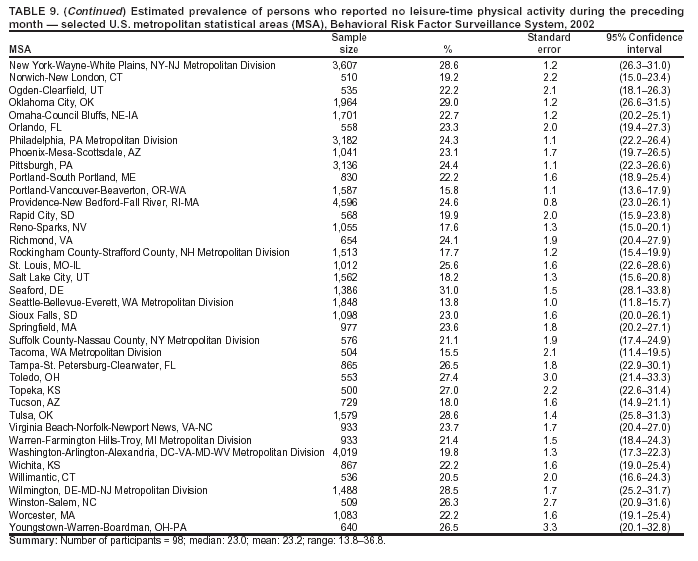 Return to top. Table 10 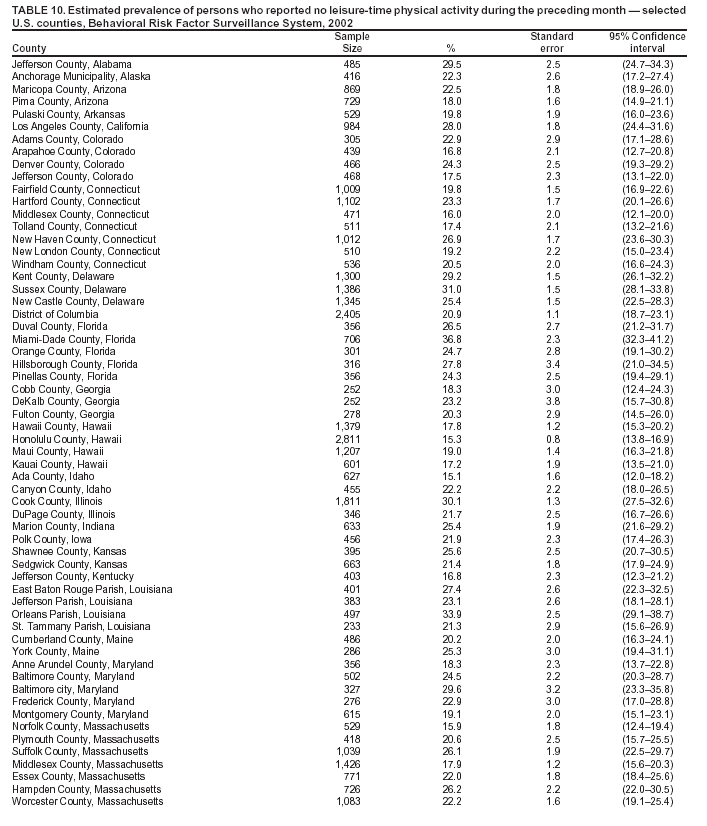 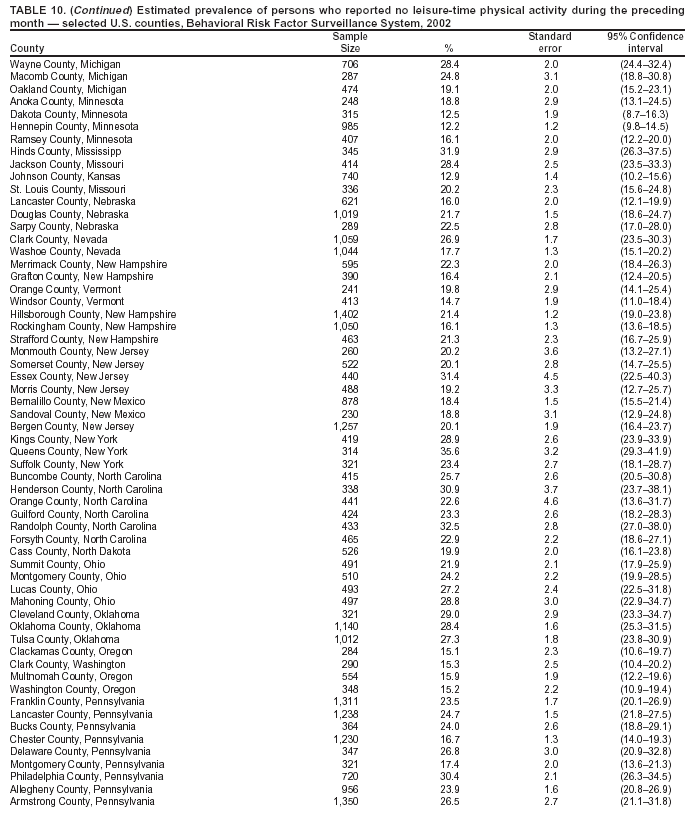 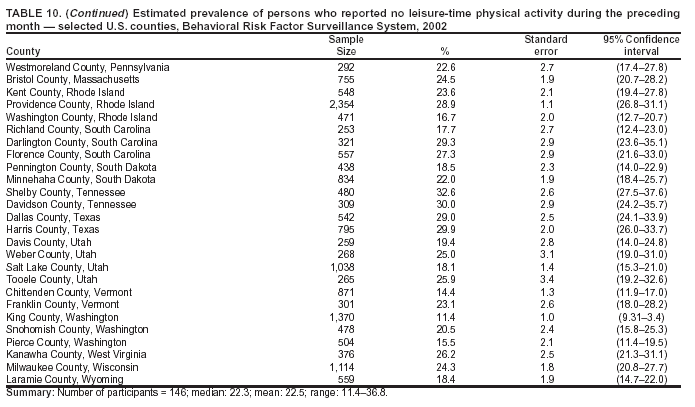 Return to top. Table 11 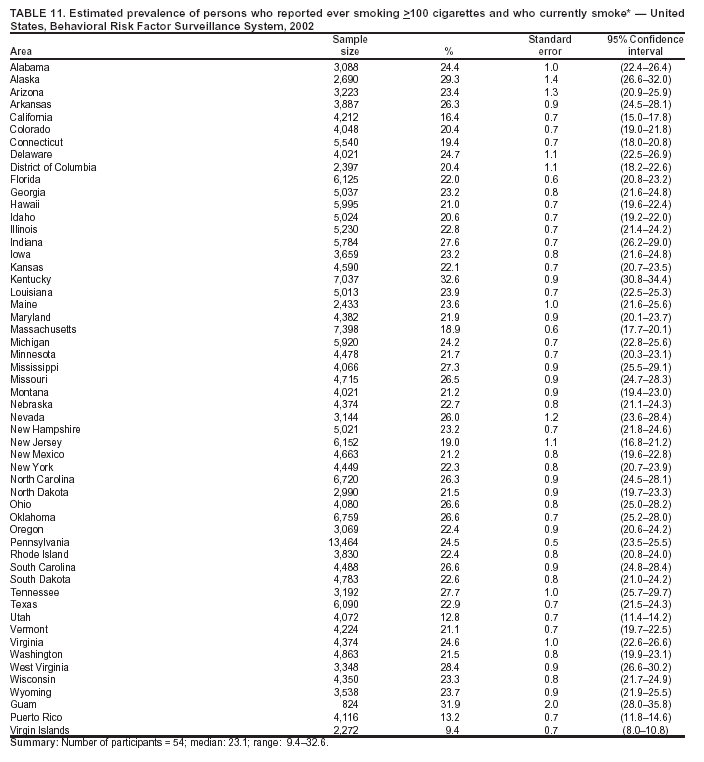 Return to top. Table 12 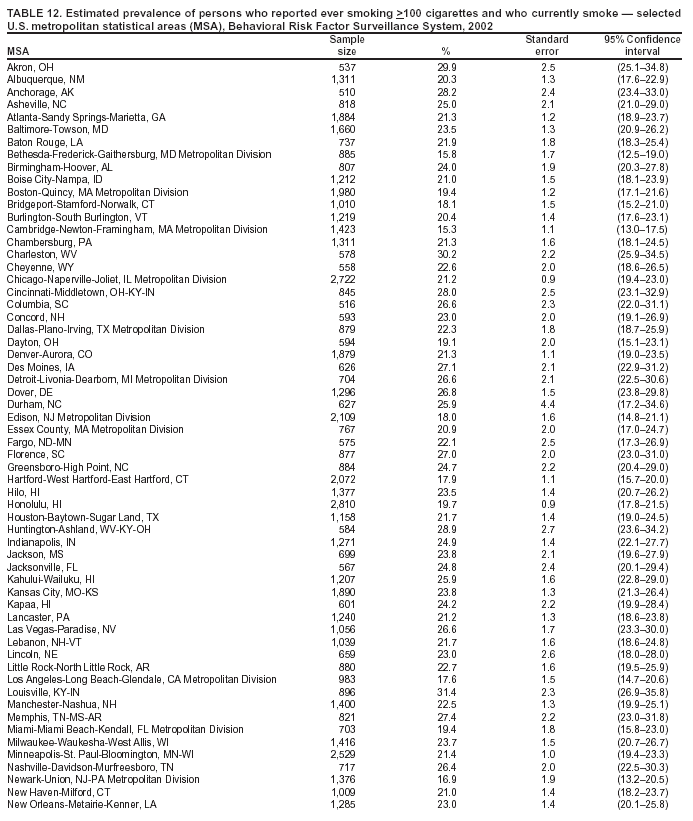 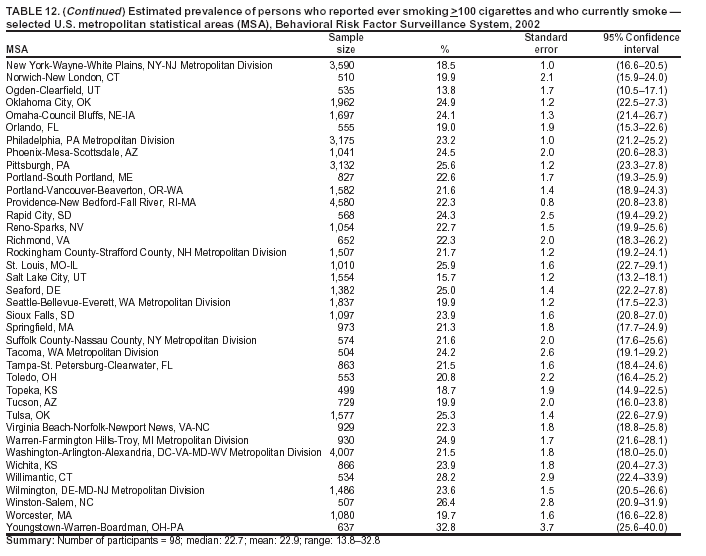 Return to top. Table 13  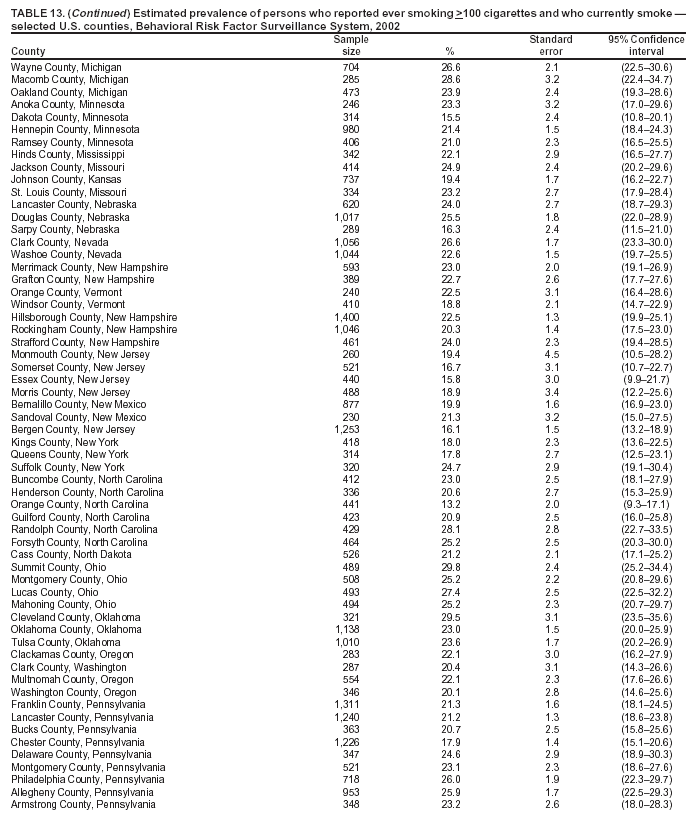 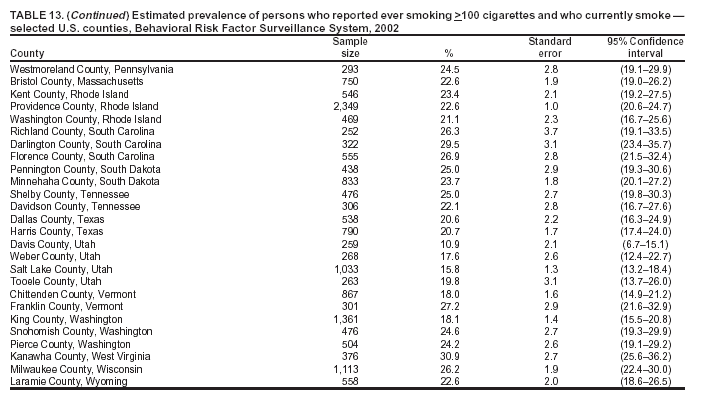 Return to top. Table 14 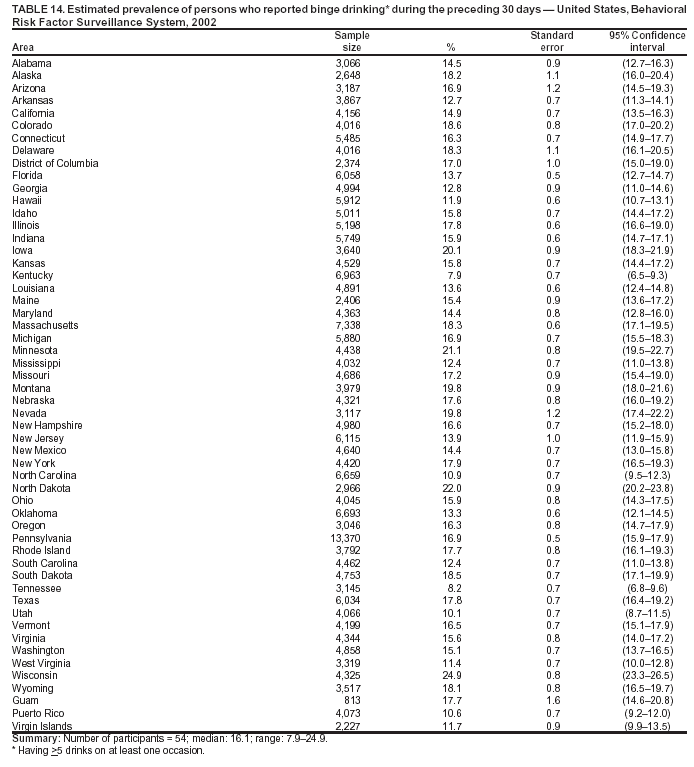 Return to top. Table 15 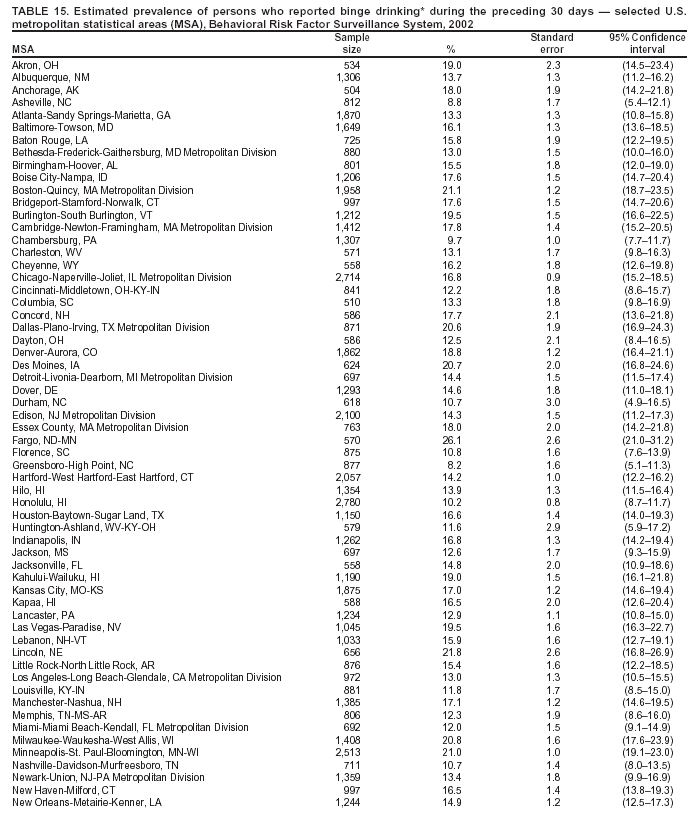 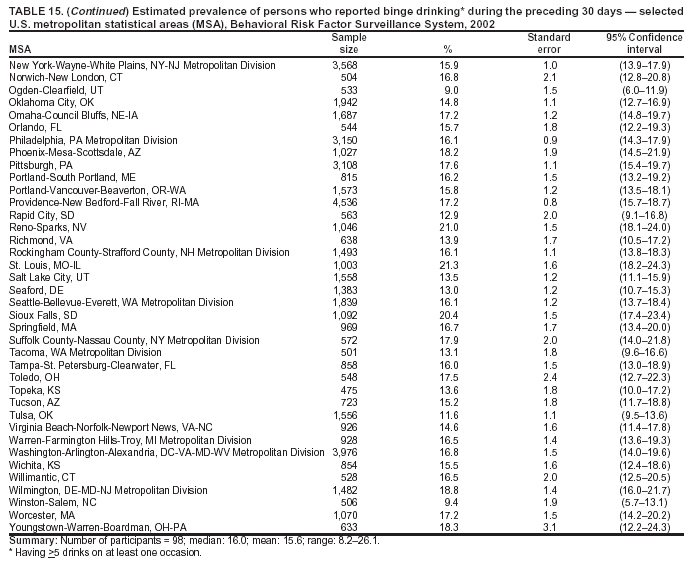 Return to top. Table 16 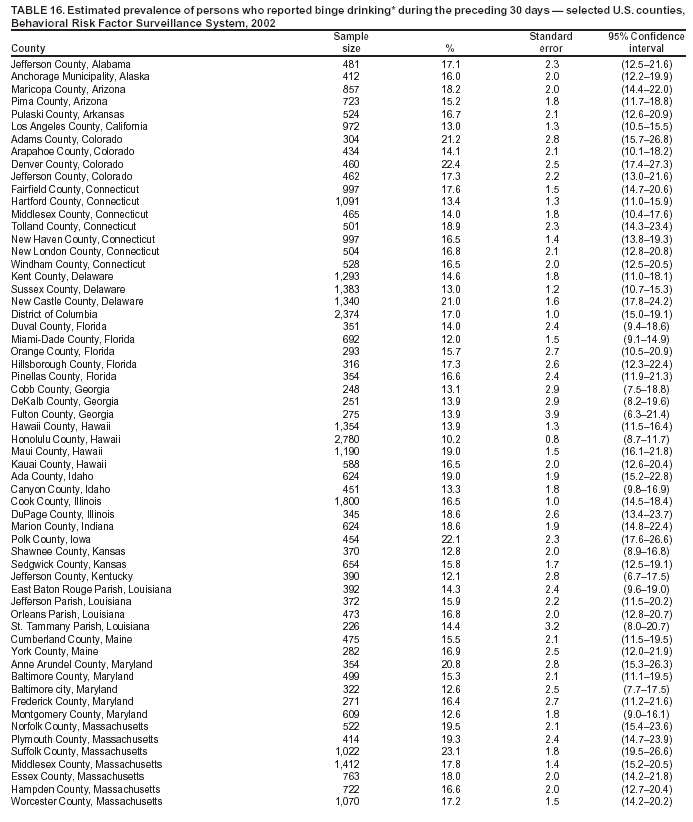
  Return to top.
Table 17 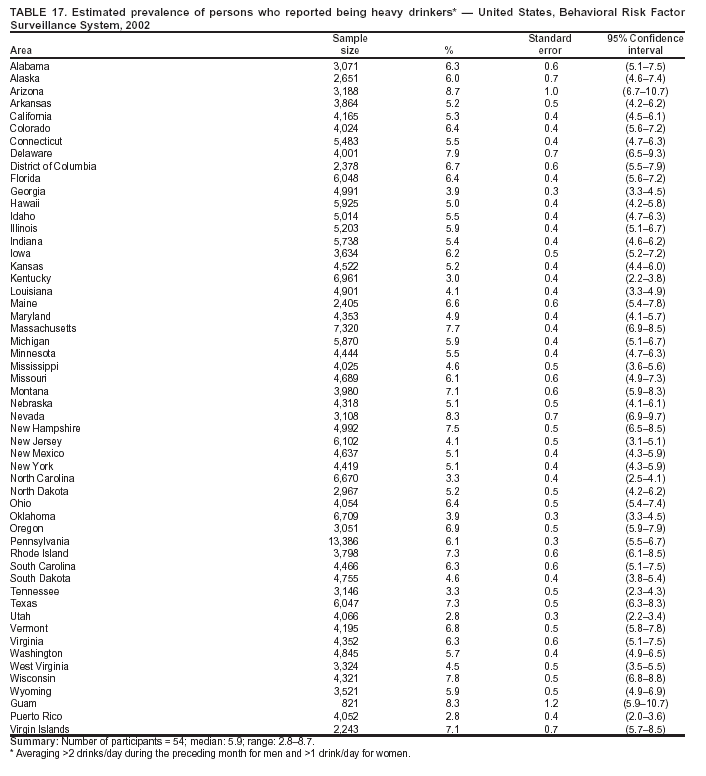 Return to top. Table 18 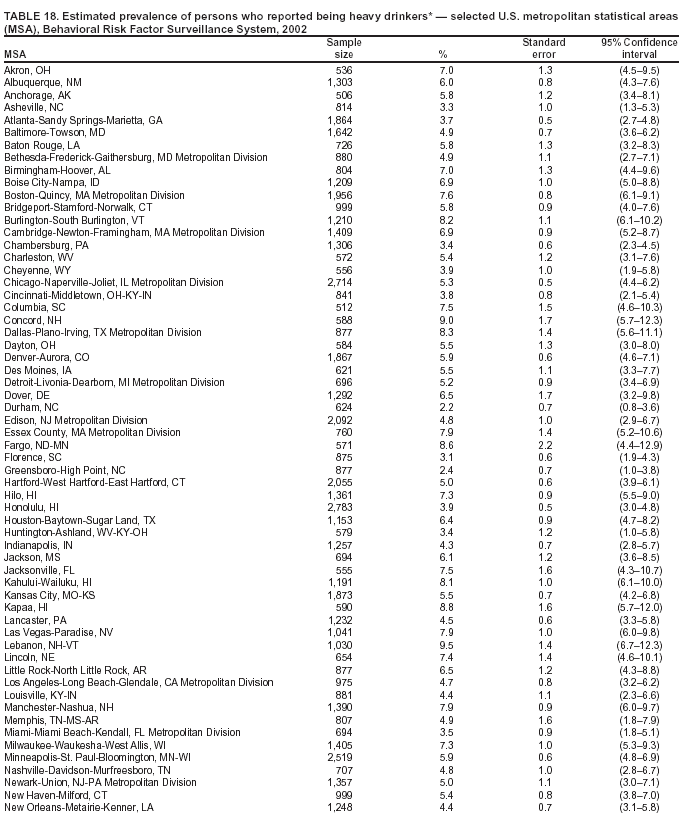 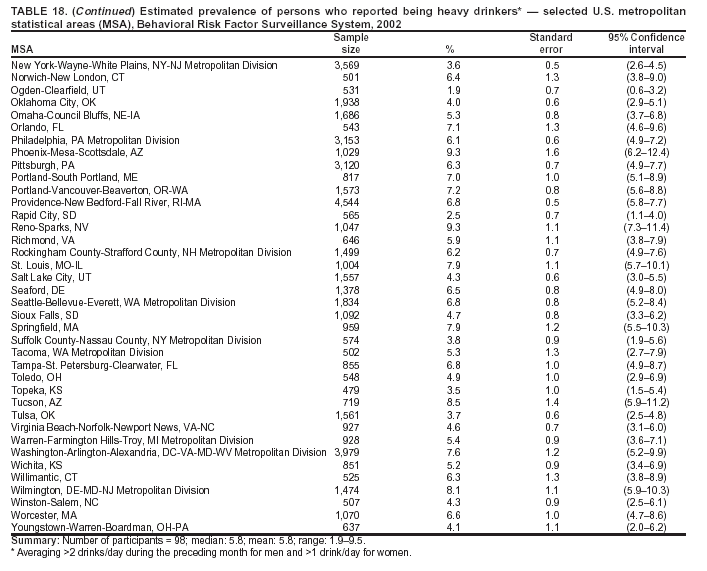 Return to top. Table 19 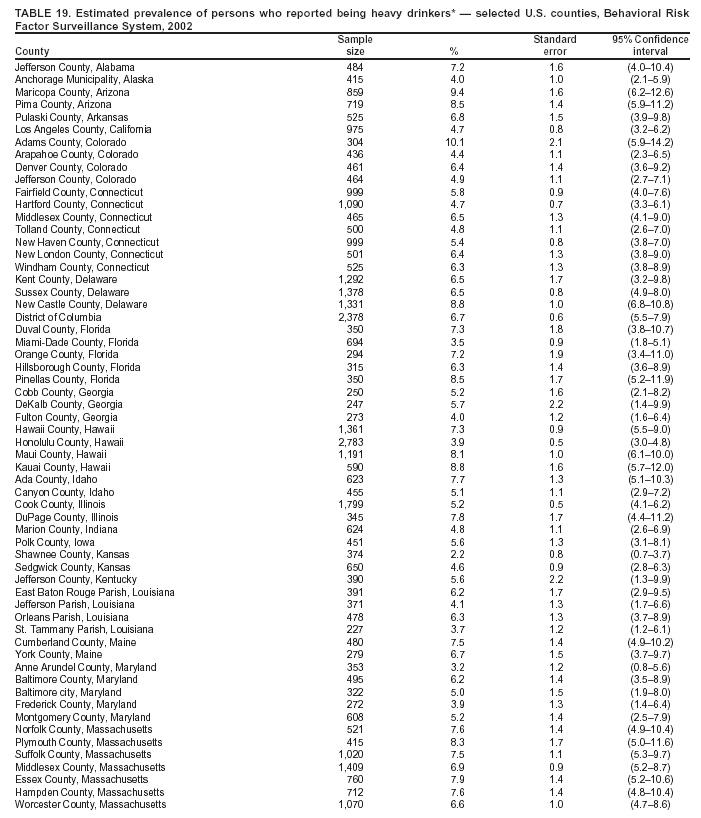 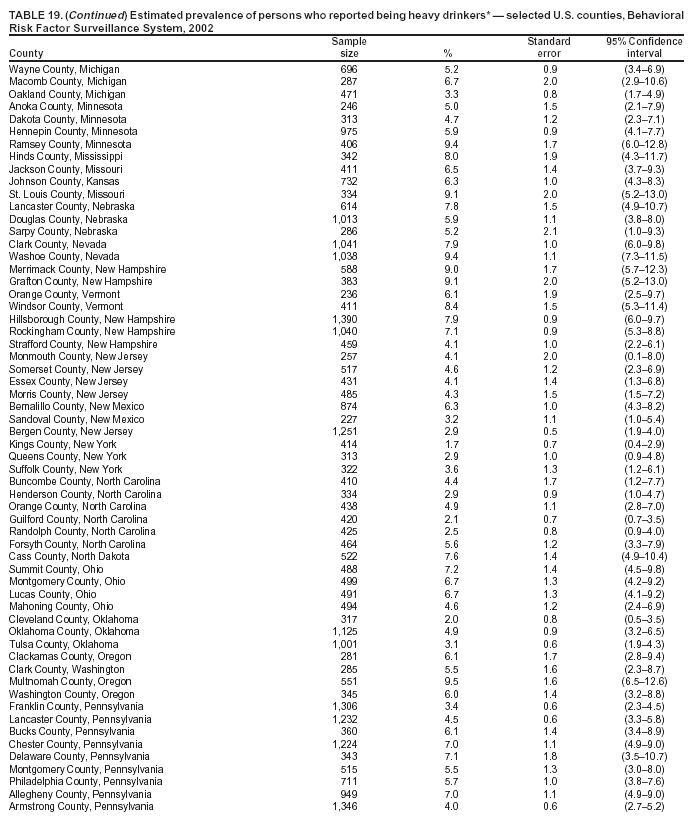  Return to top. Table 20 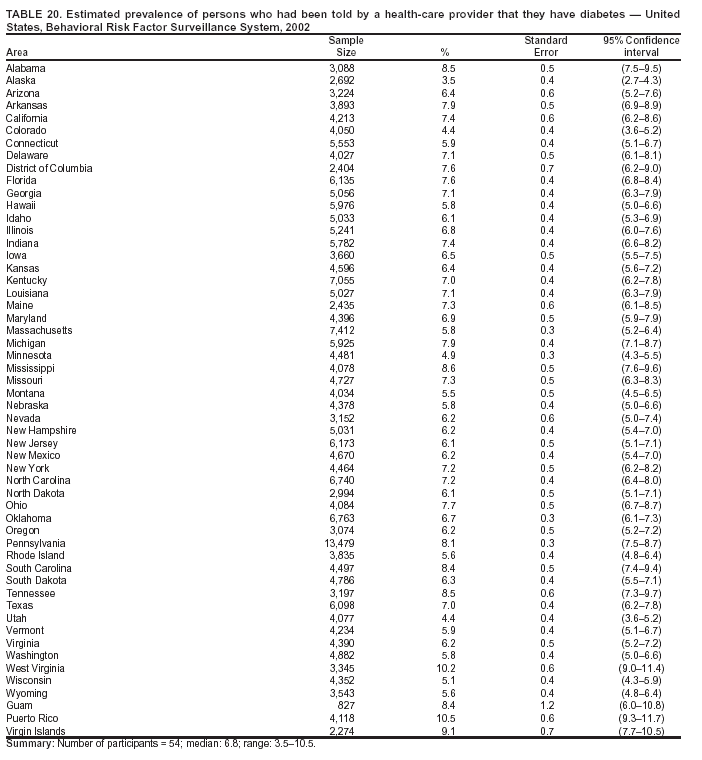 Return to top. Table 21 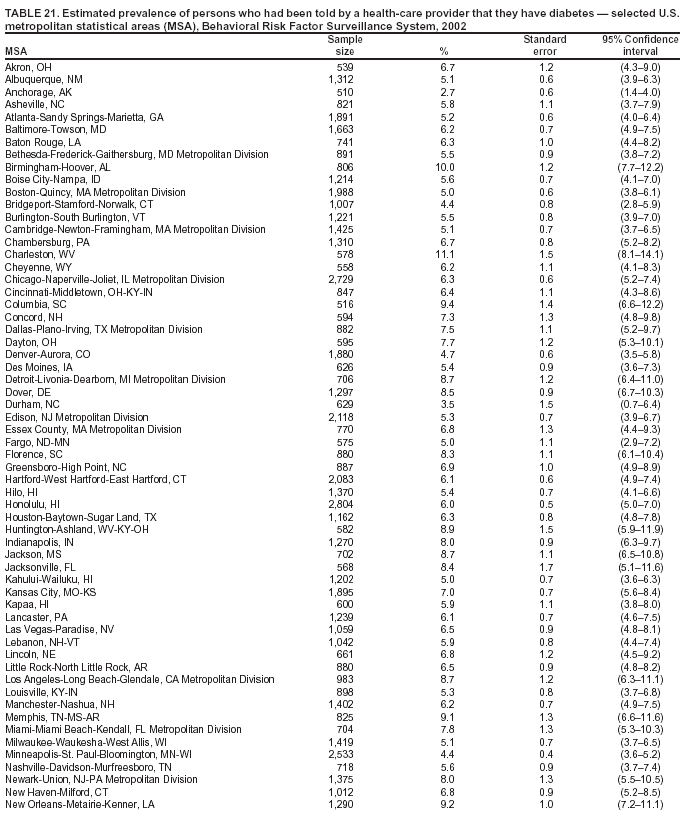 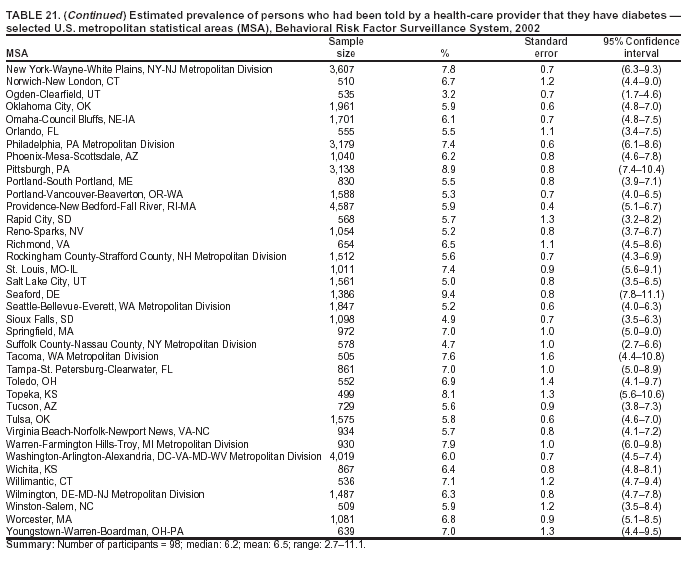 Return to top. Table 22 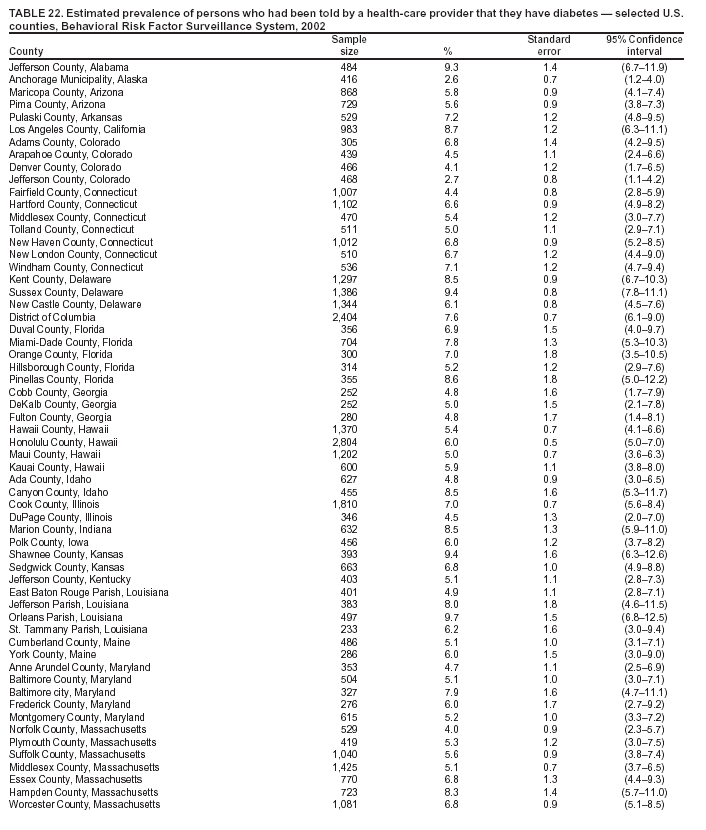 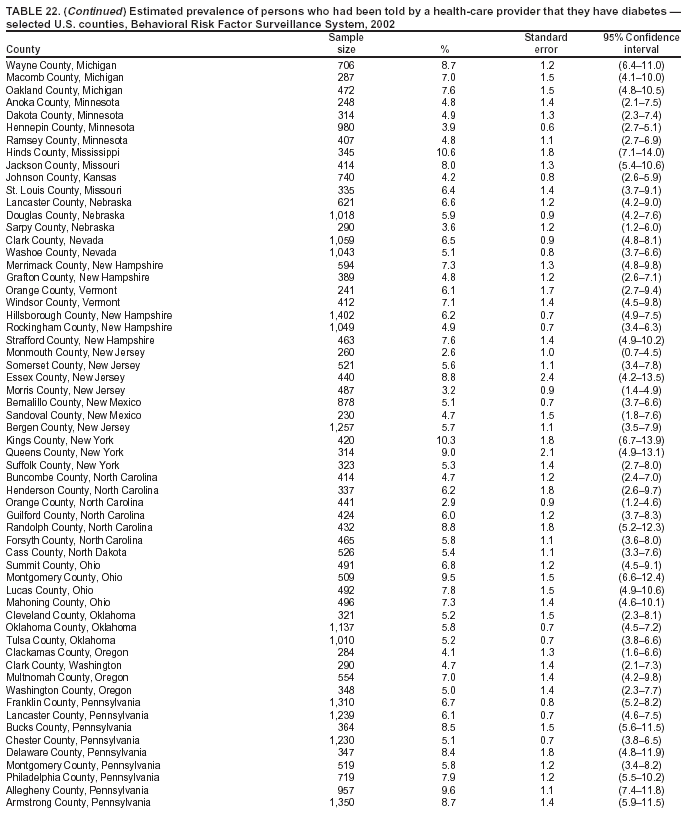 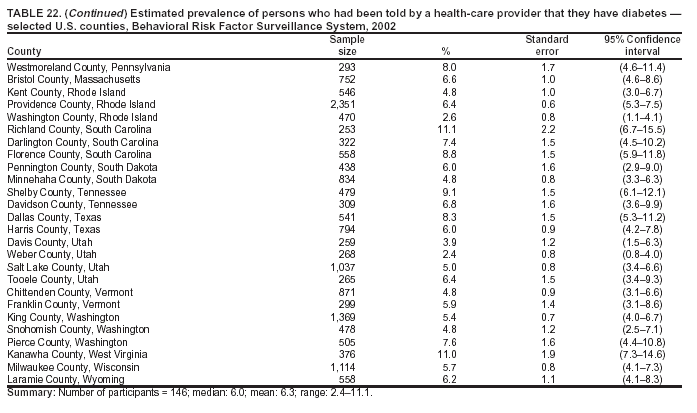 Return to top. Table 23 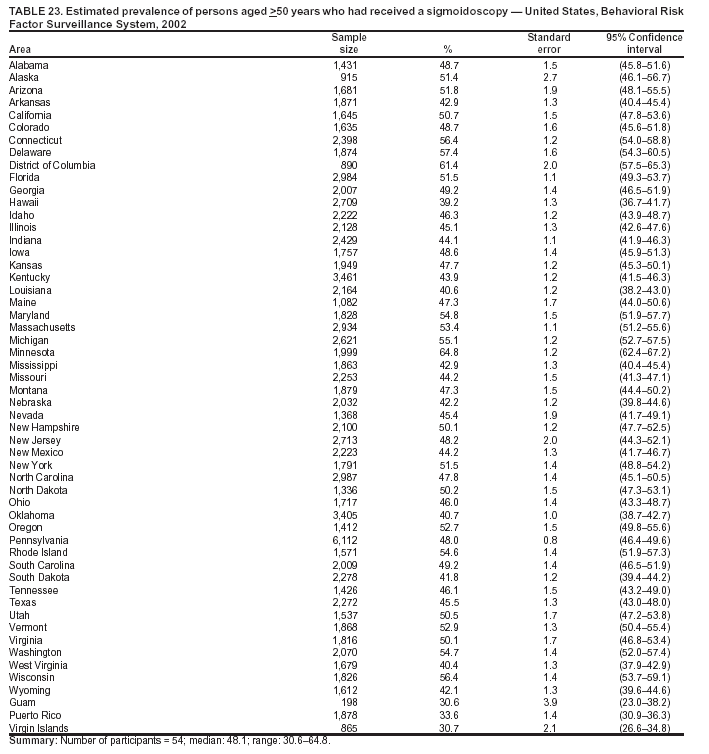 Return to top. Table 24 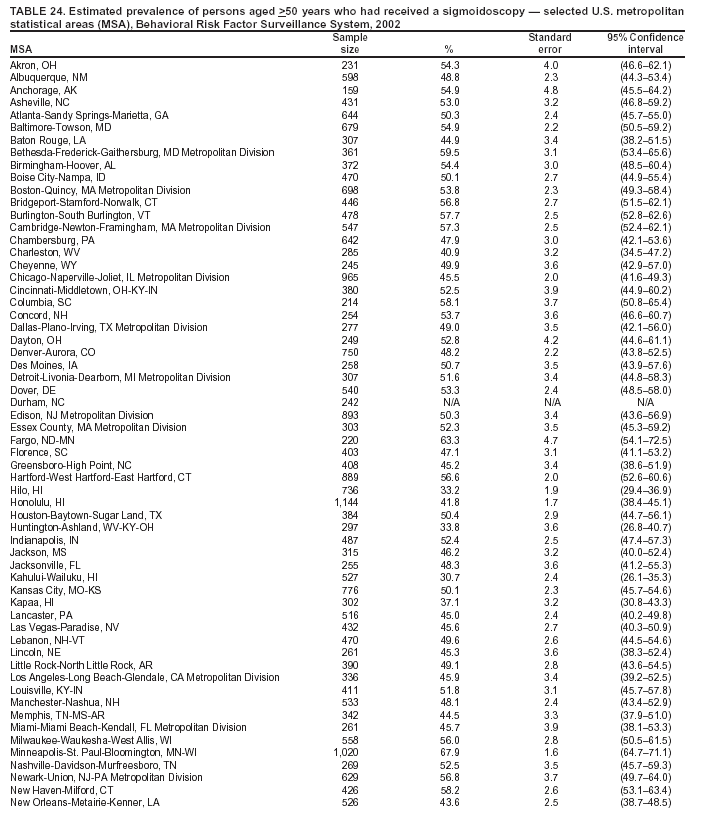 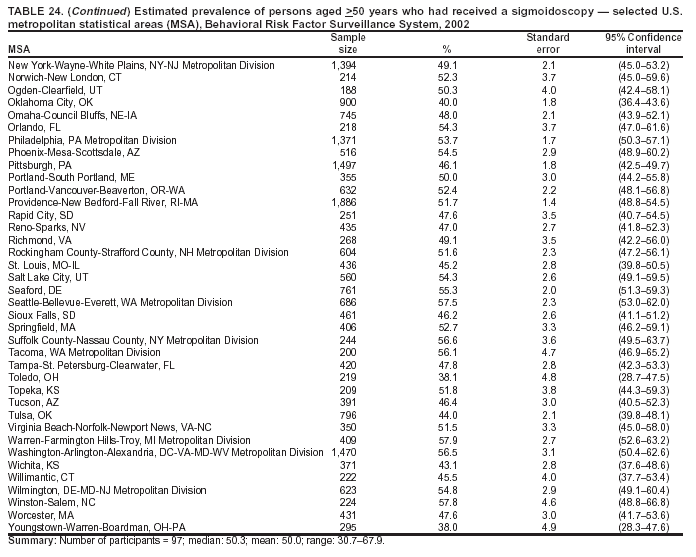 Return to top. Table 25 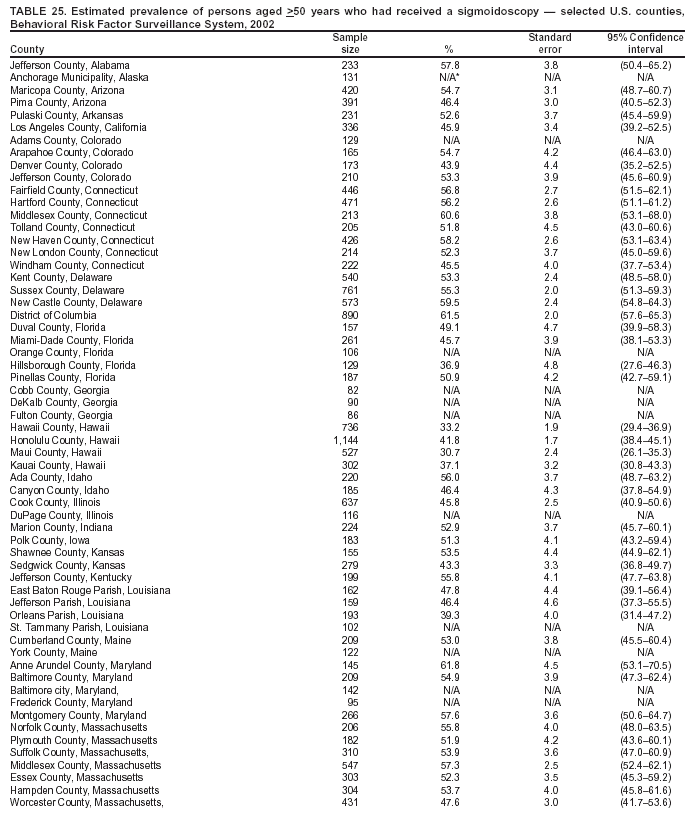 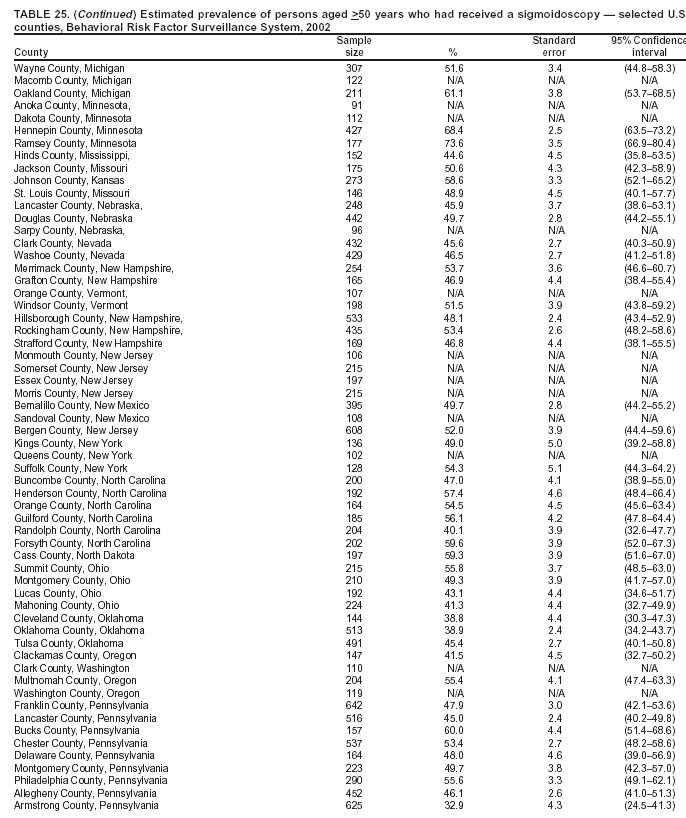 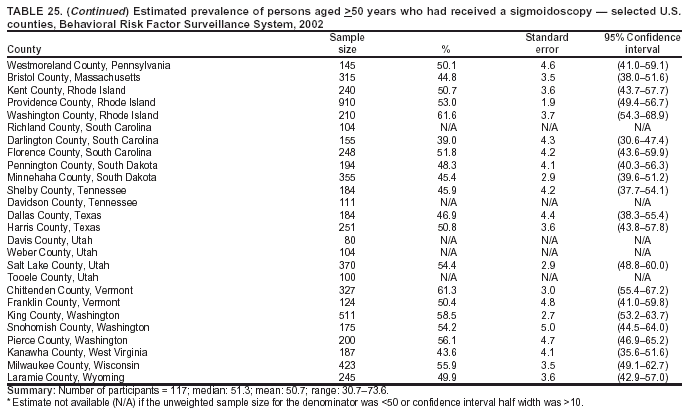 Return to top. Table 26 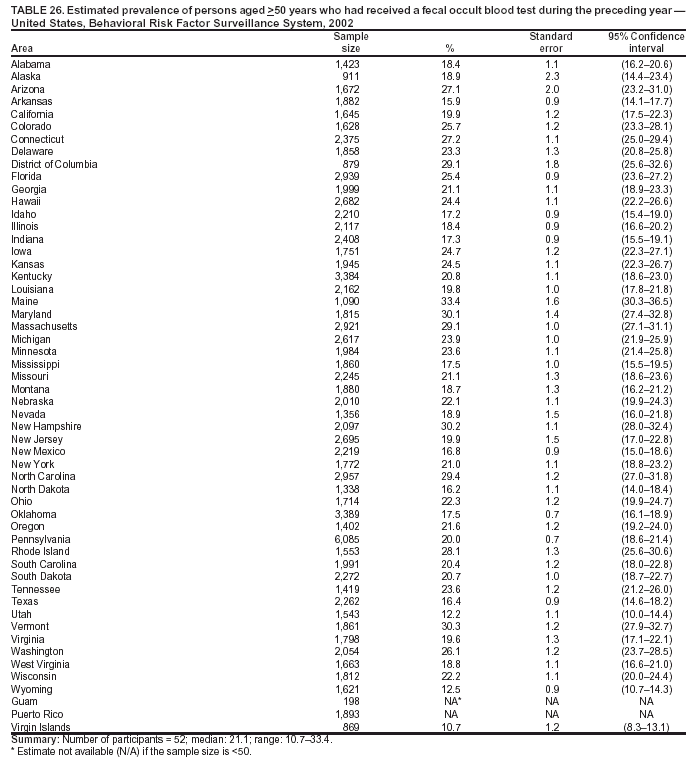 Return to top. Table 27 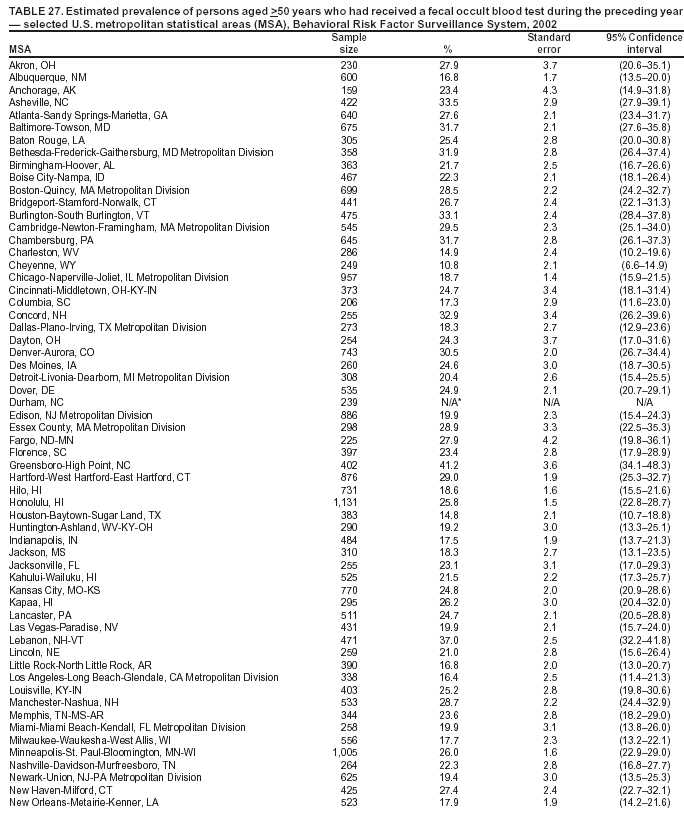 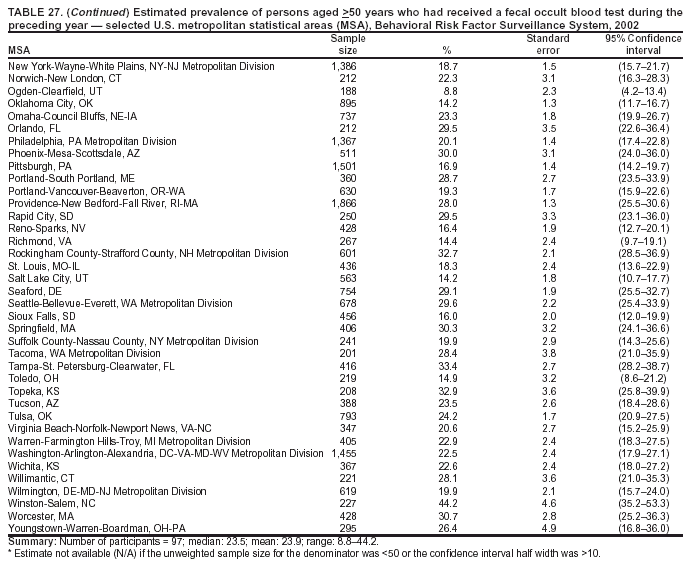 Return to top. Table 28 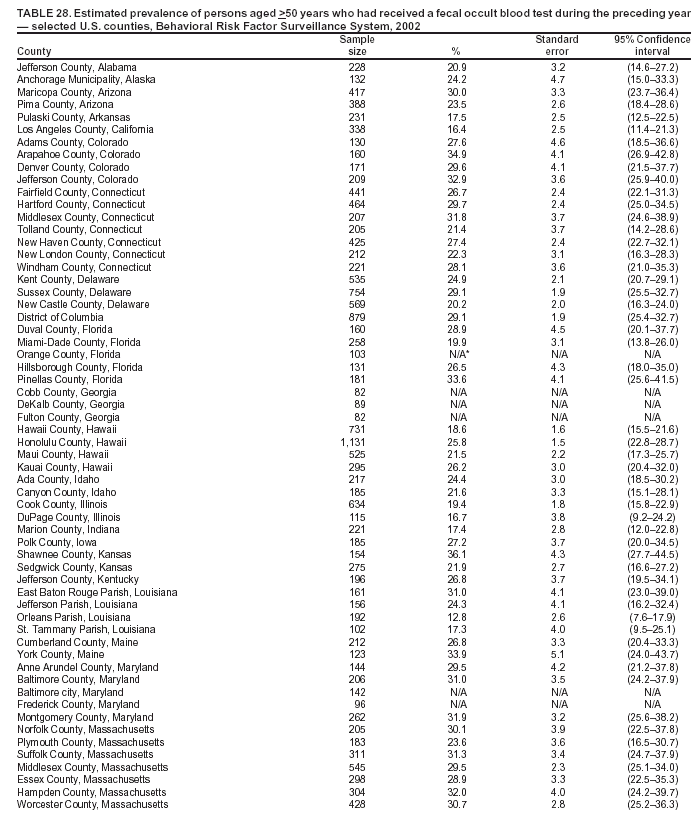 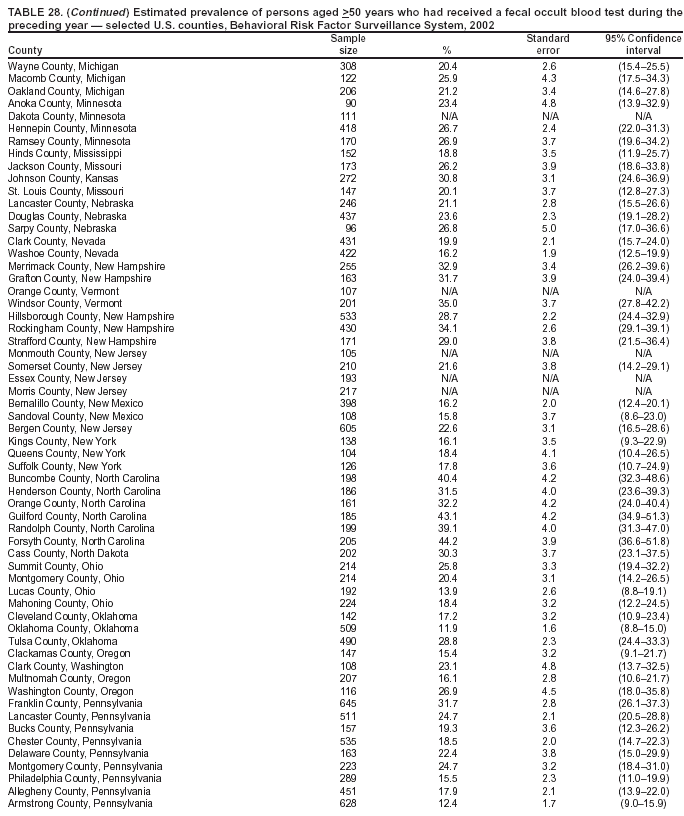 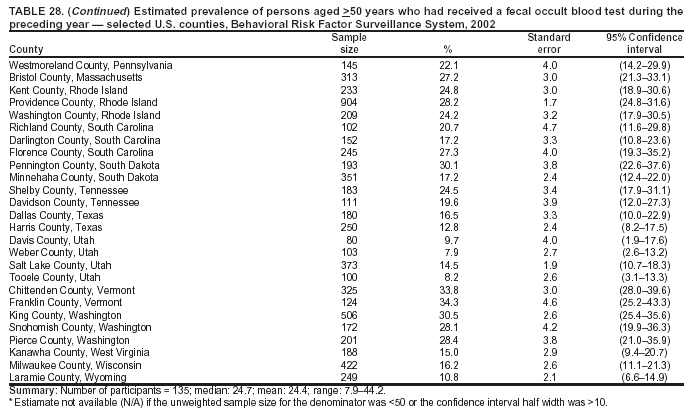 Return to top. Table 29 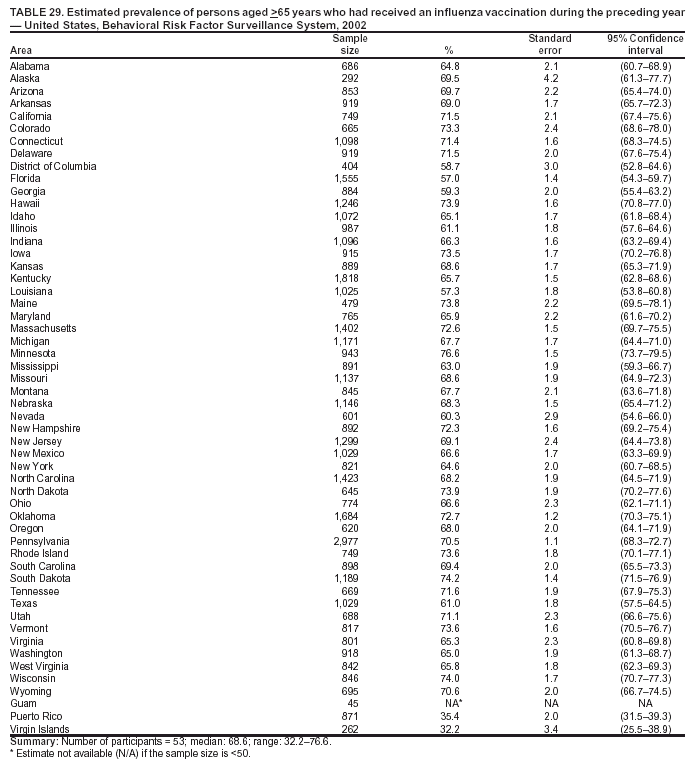 Return to top. Table 30 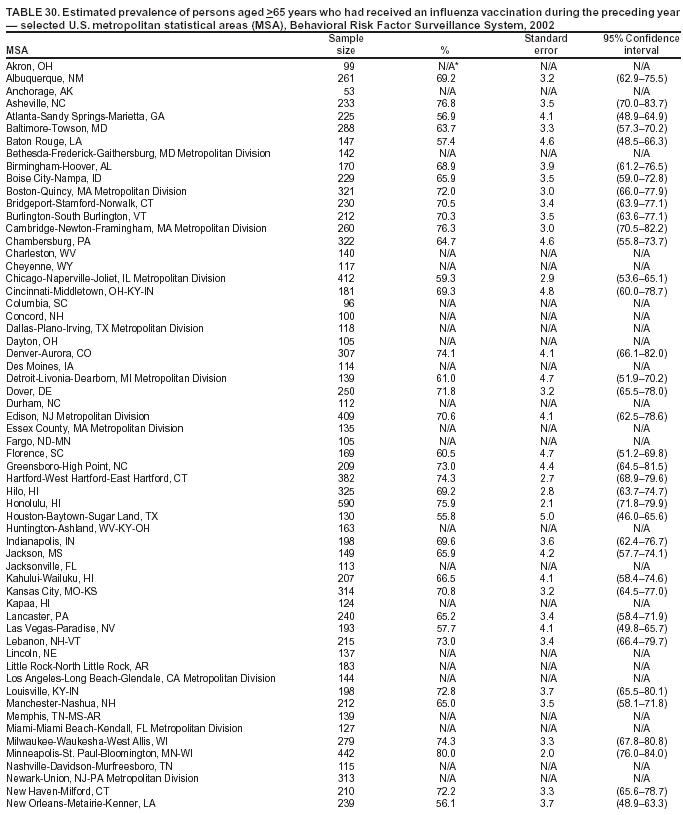  Return to top. Table 31  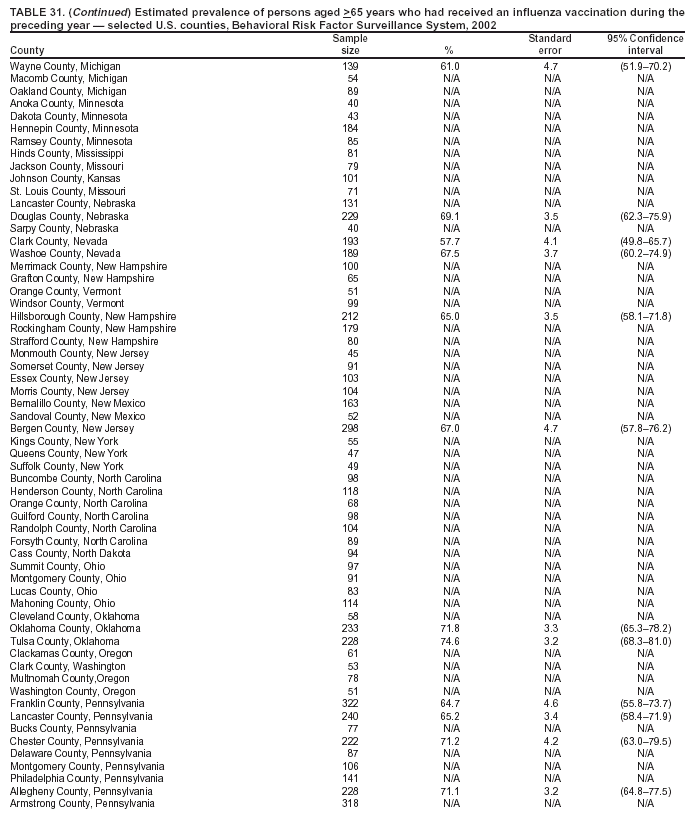 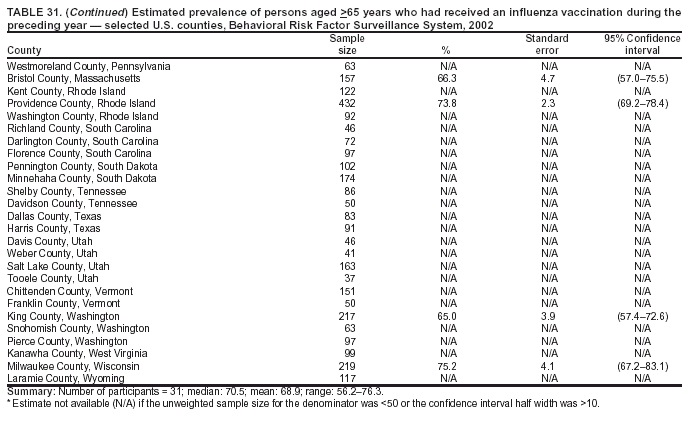 Return to top. Table 32  Return to top. Table 33 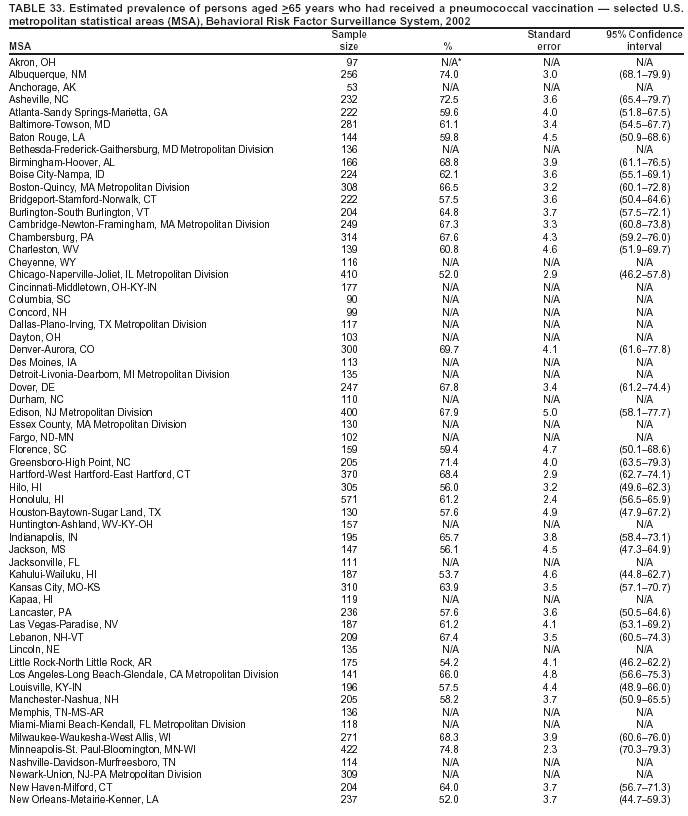 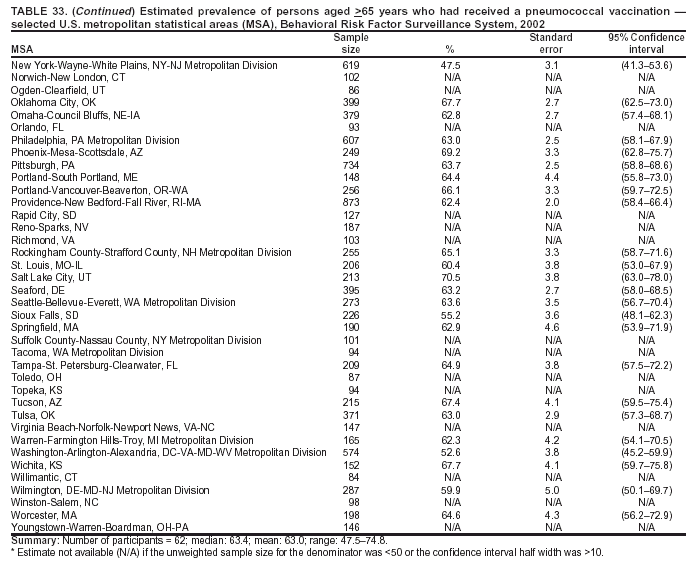 Return to top. Table 34 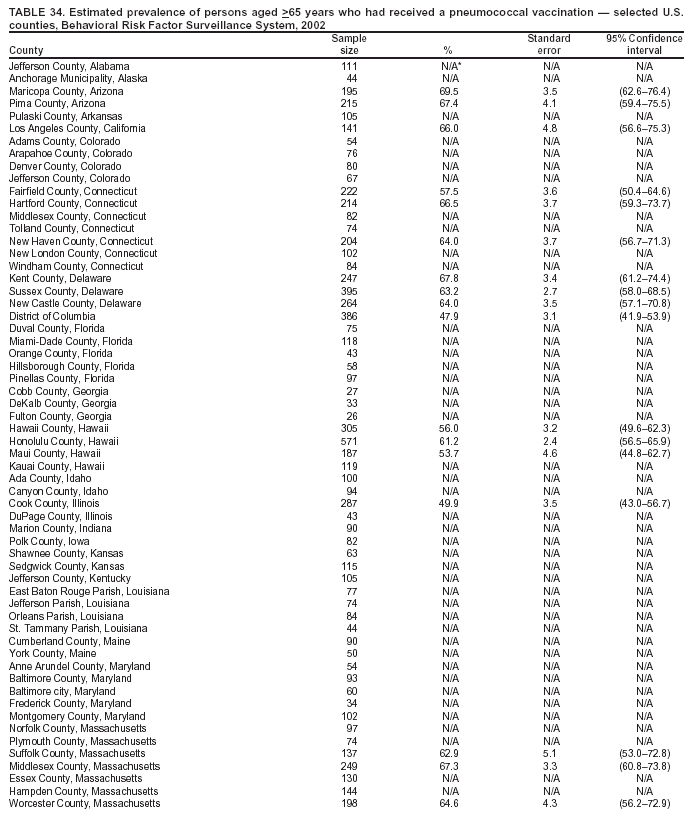 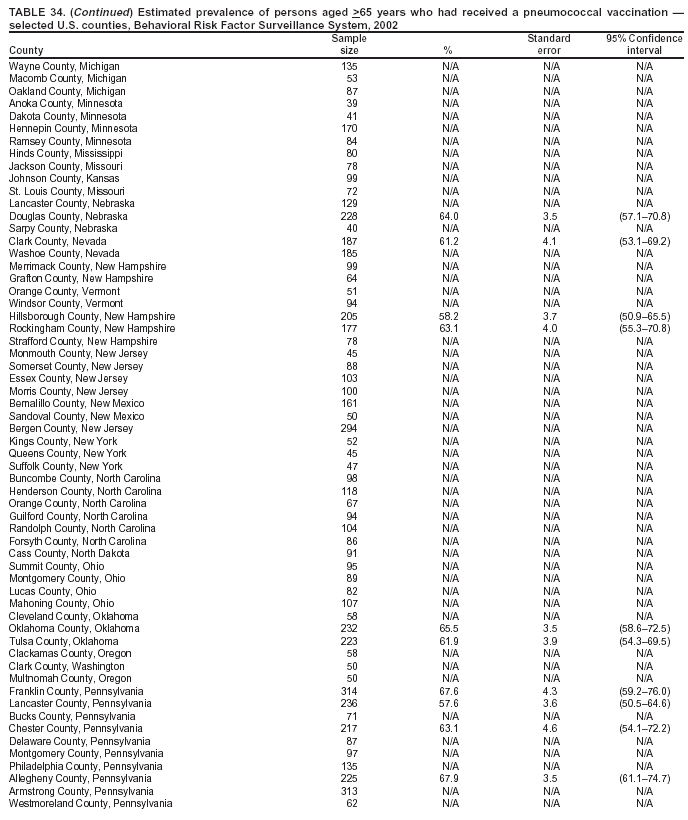 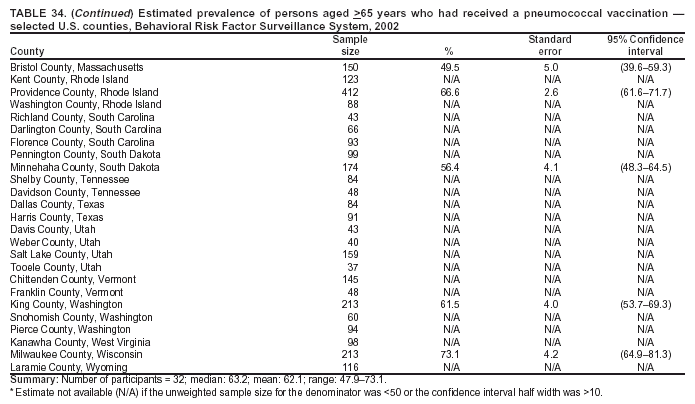 Return to top. Table 35  Return to top. Table 36 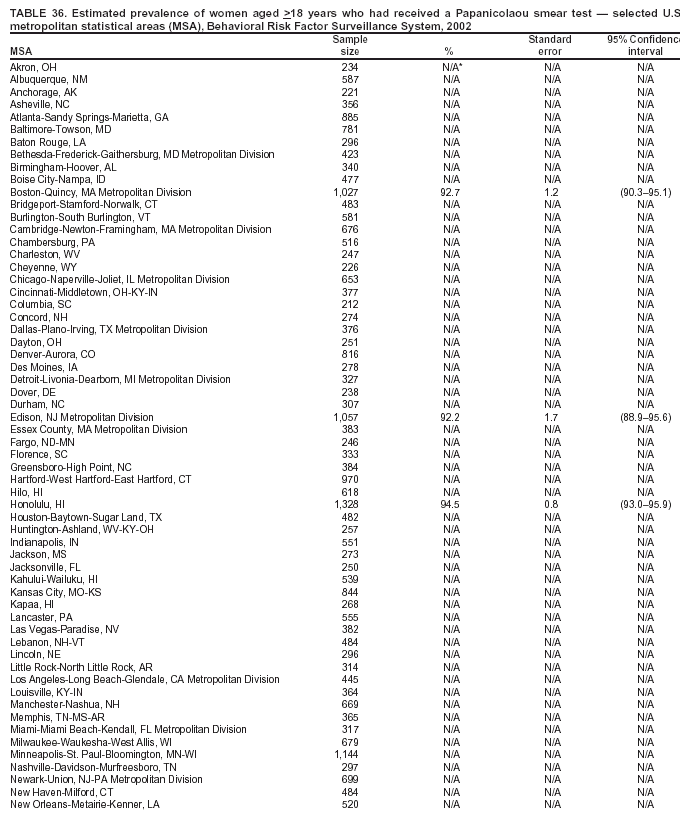 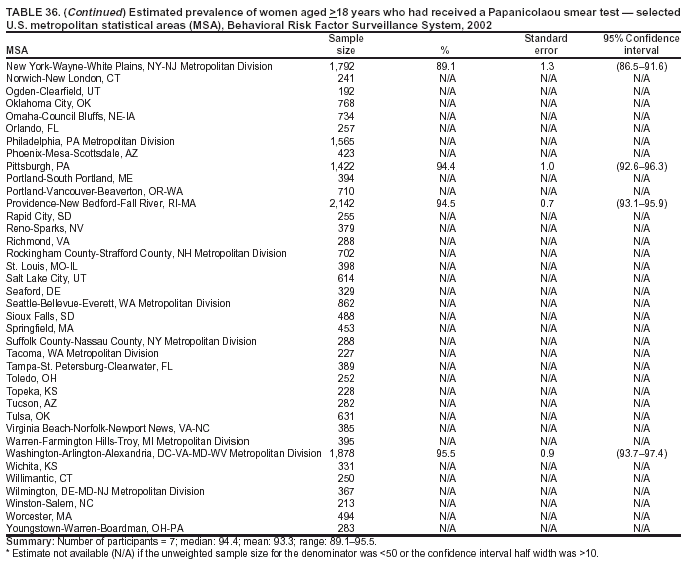 Return to top. Table 37   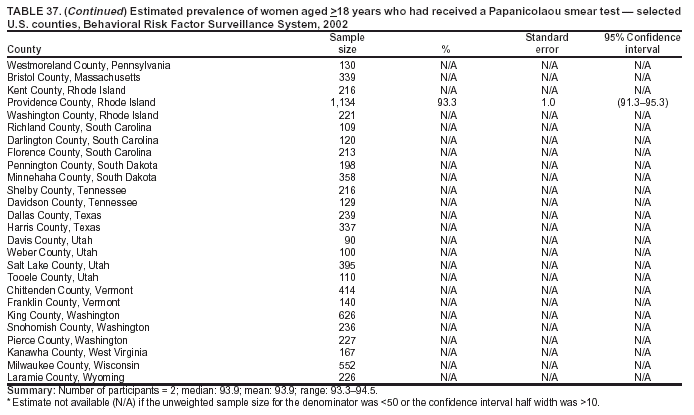 Return to top. Table 38 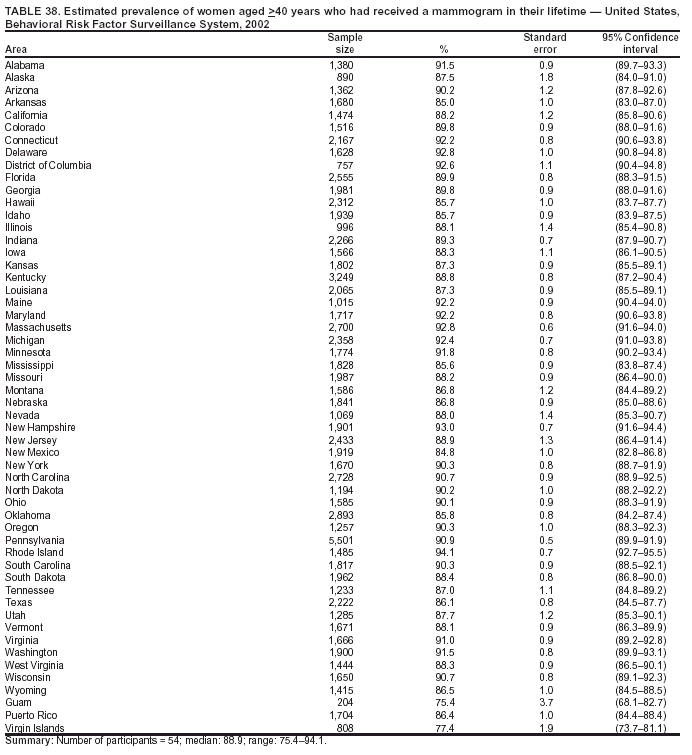 Return to top. Table 39 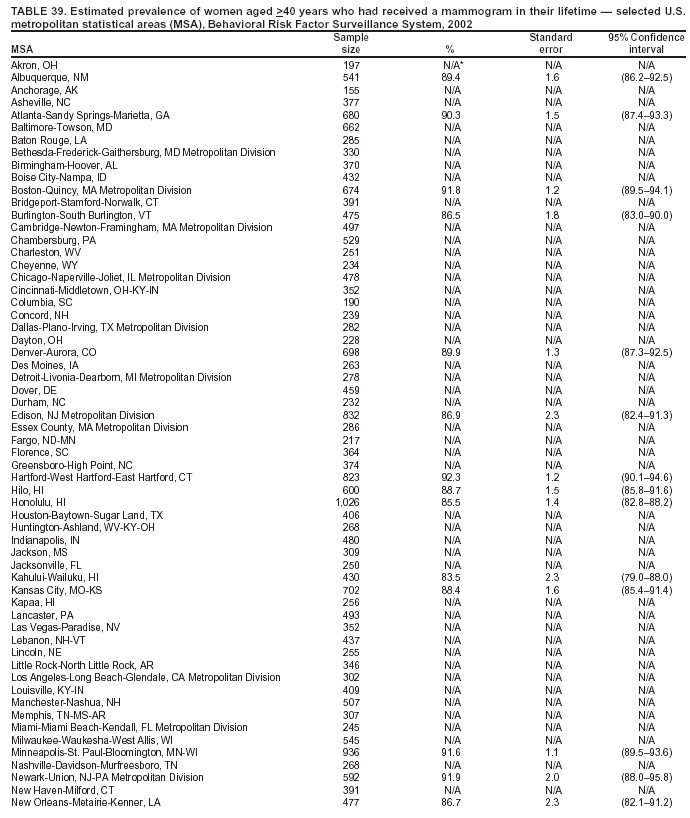 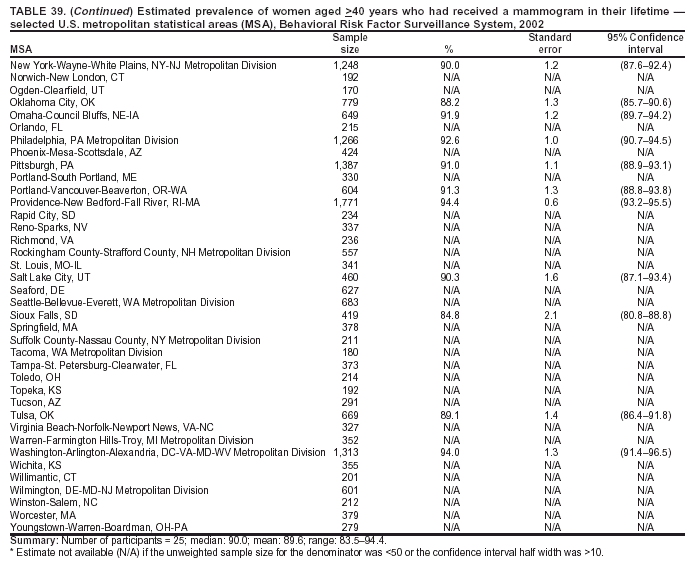 Return to top. Table 40 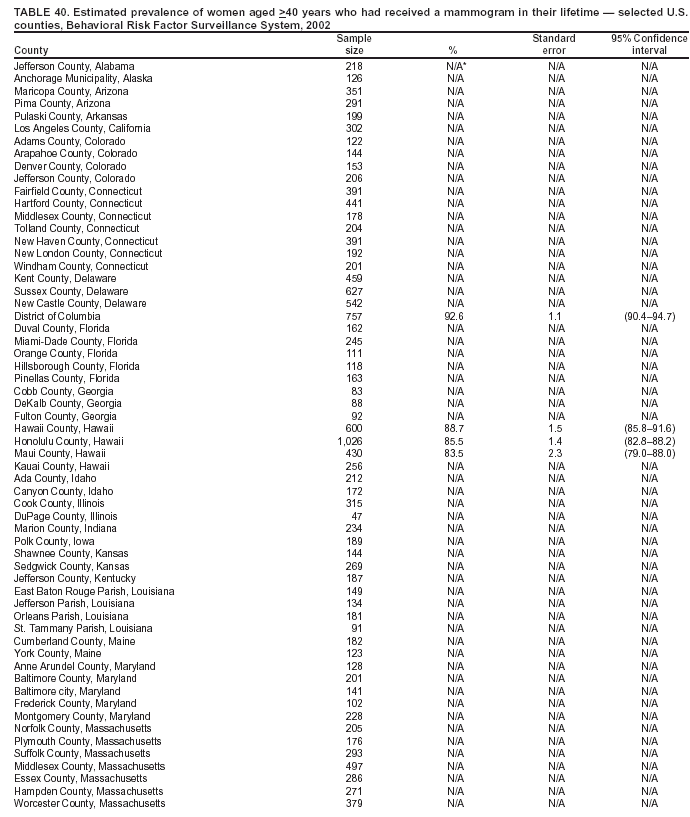 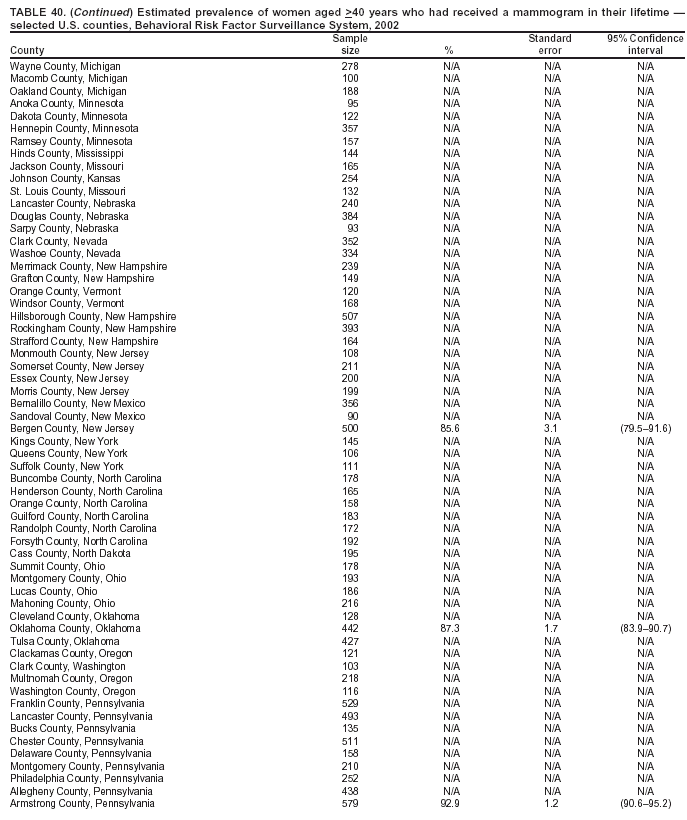 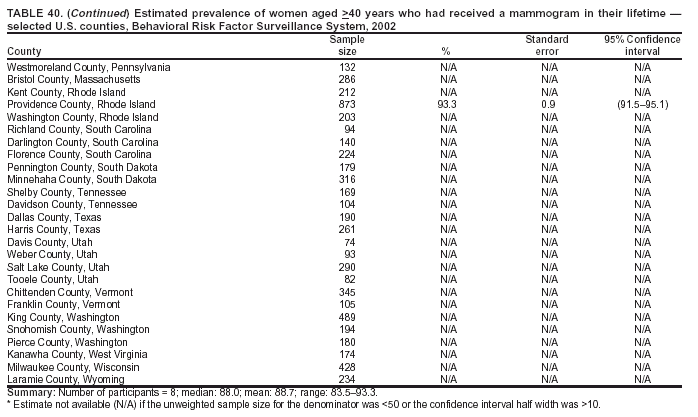 Return to top. Table 41 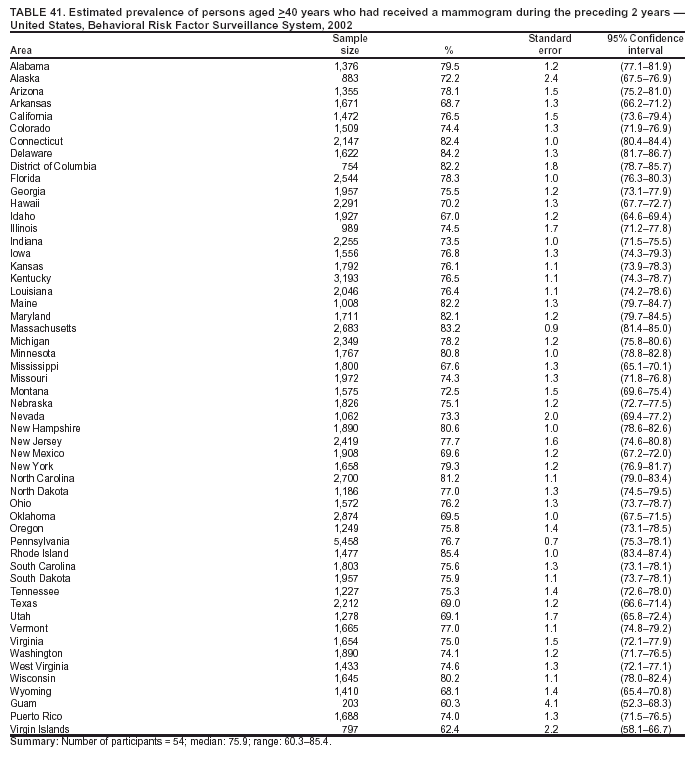 Return to top. Table 42 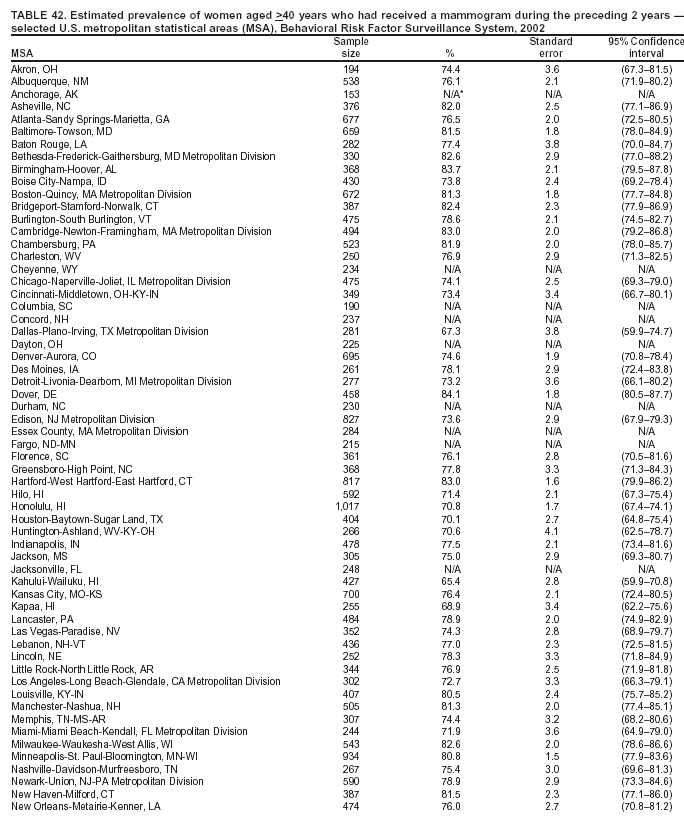 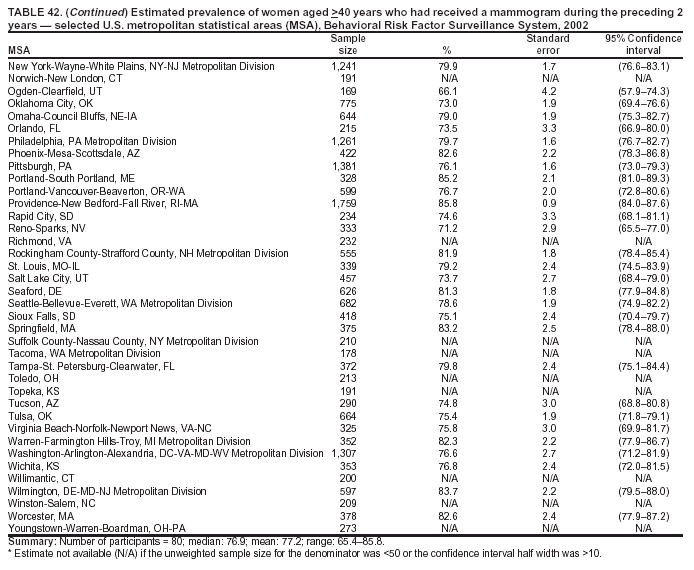 Return to top. Table 43 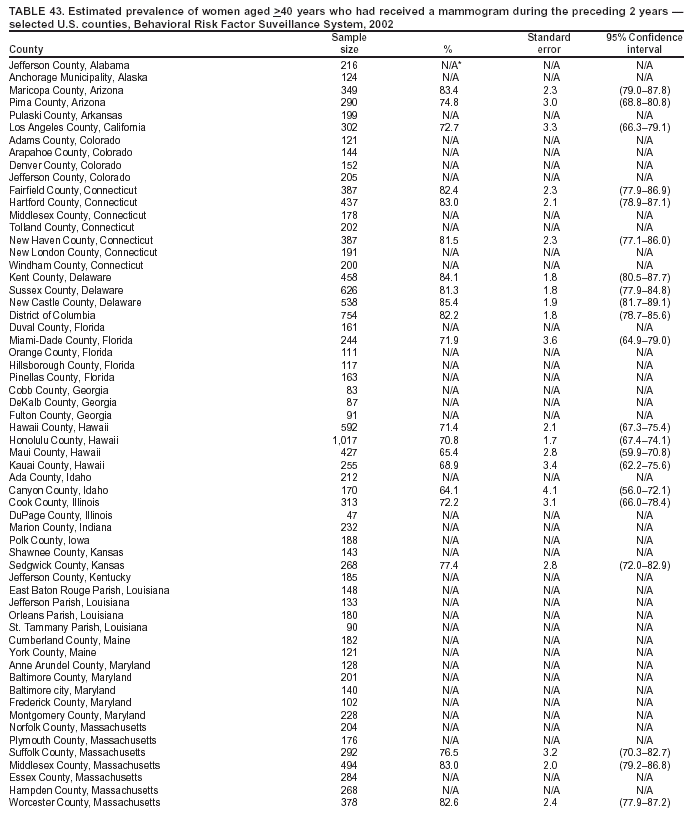 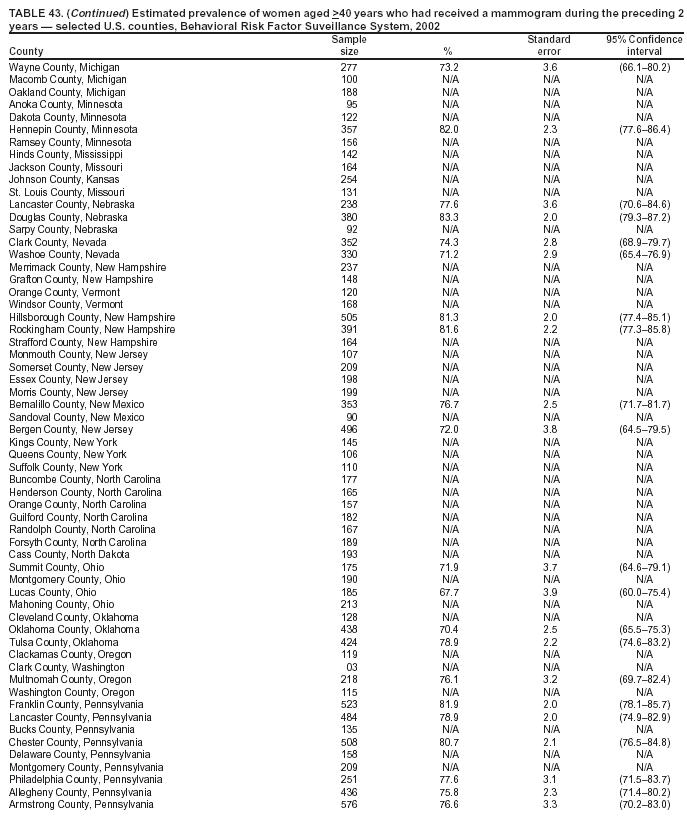 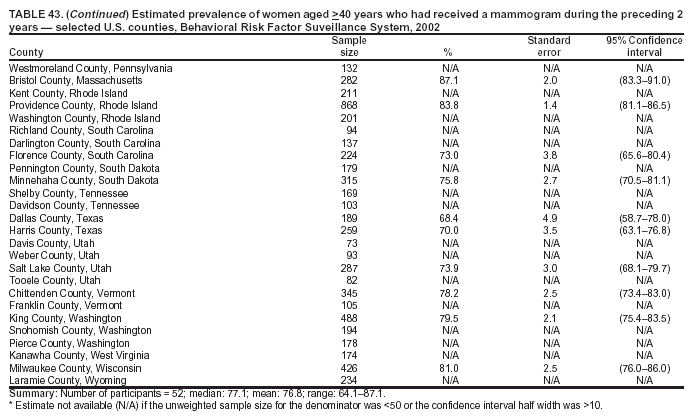 Return to top. Return to top.
Table 44 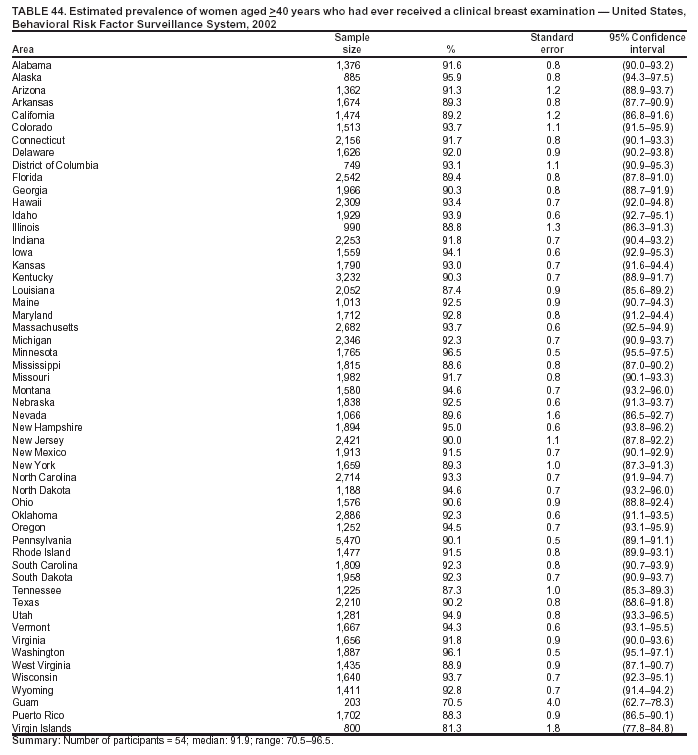 Return to top. Table 45 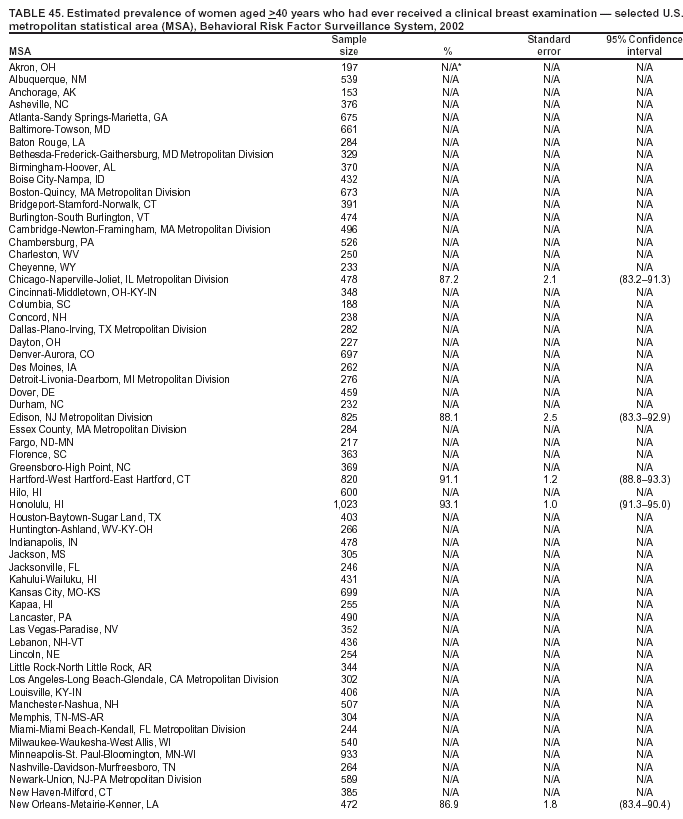 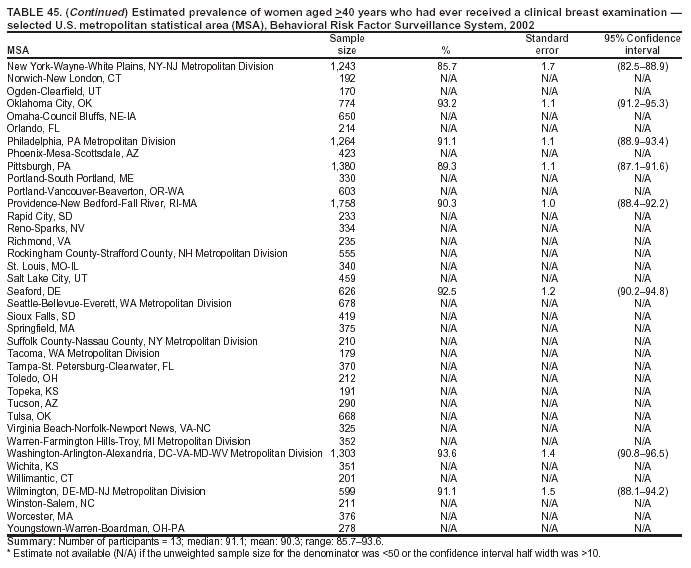 Return to top. Table 46 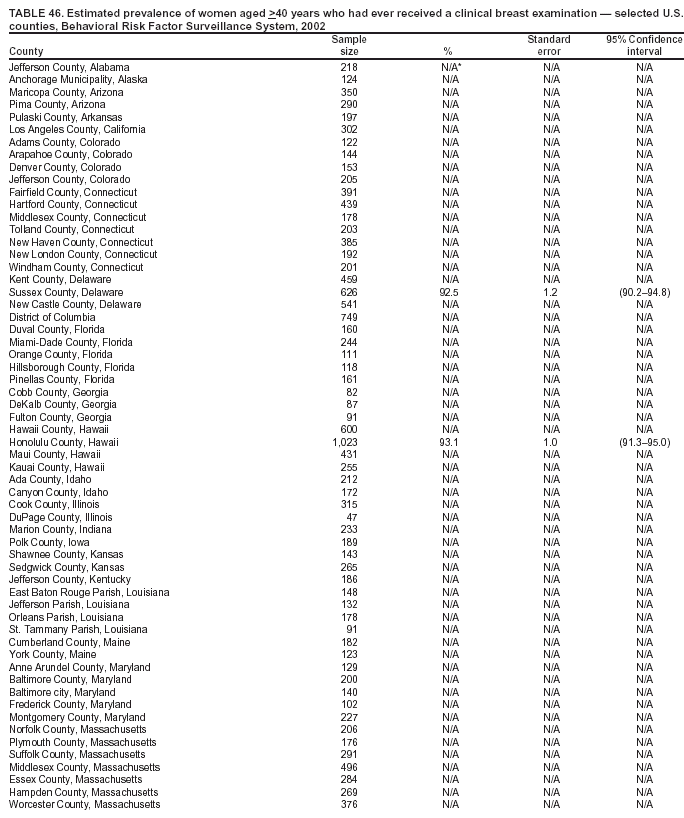 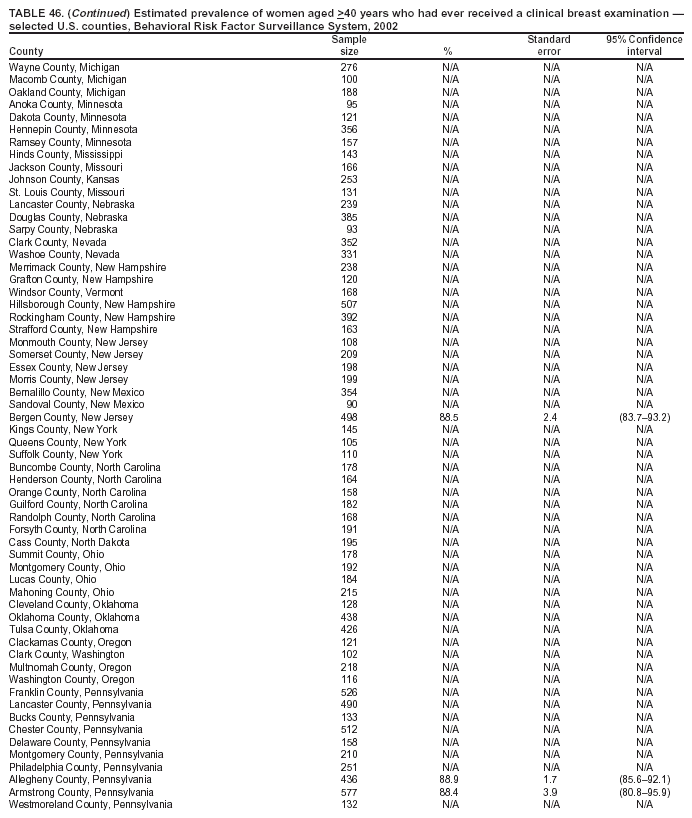  Return to top.
Disclaimer All MMWR HTML versions of articles are electronic conversions from ASCII text into HTML. This conversion may have resulted in character translation or format errors in the HTML version. Users should not rely on this HTML document, but are referred to the electronic PDF version and/or the original MMWR paper copy for the official text, figures, and tables. An original paper copy of this issue can be obtained from the Superintendent of Documents, U.S. Government Printing Office (GPO), Washington, DC 20402-9371; telephone: (202) 512-1800. Contact GPO for current prices. **Questions or messages regarding errors in formatting should be addressed to mmwrq@cdc.gov.Page converted: 7/19/2004 |
|||||||||
This page last reviewed 7/19/2004
|