|
|
|
|
|
|
|
| ||||||||||
|
|
|
|
|
|
|
||||
| ||||||||||
|
|
|
|
|
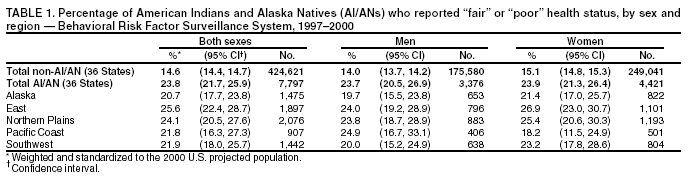
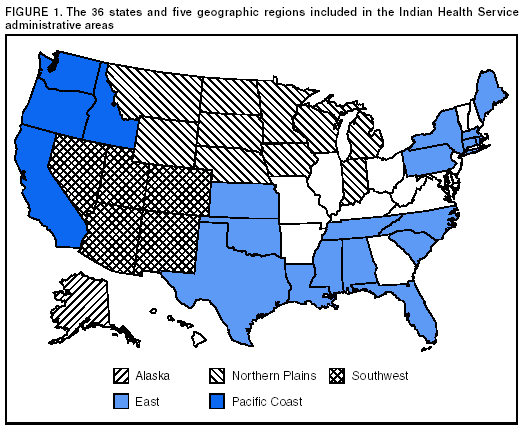
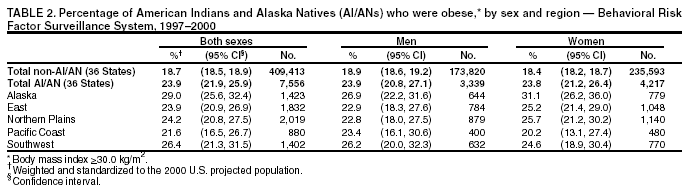
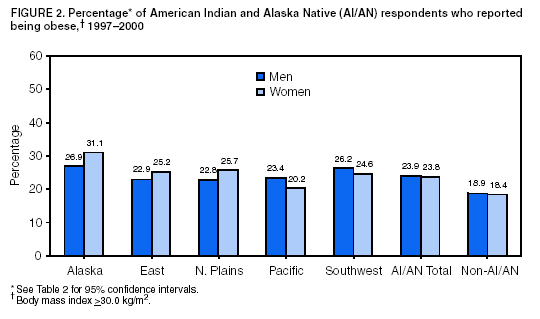
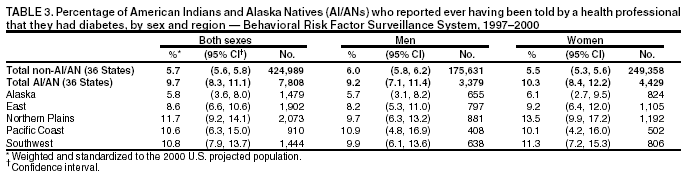
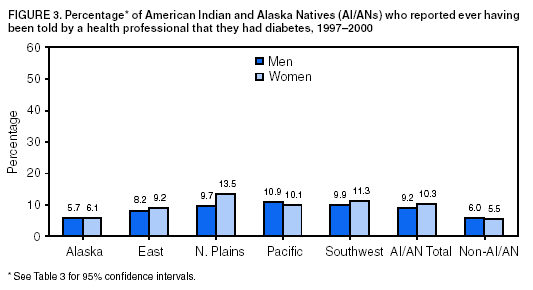
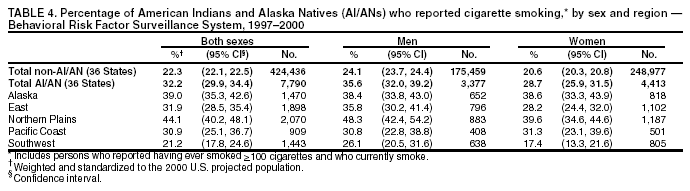
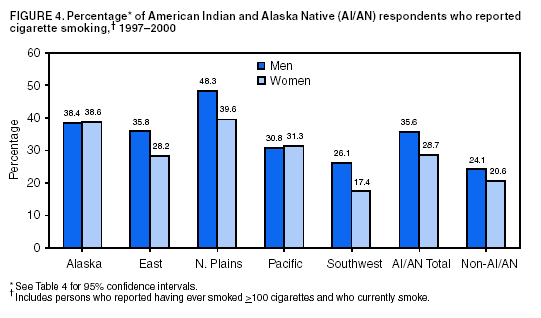
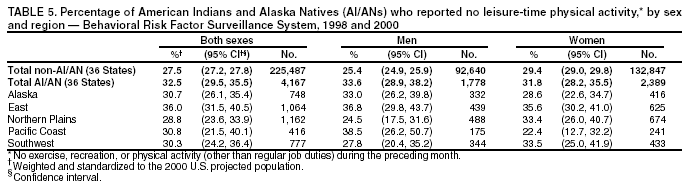
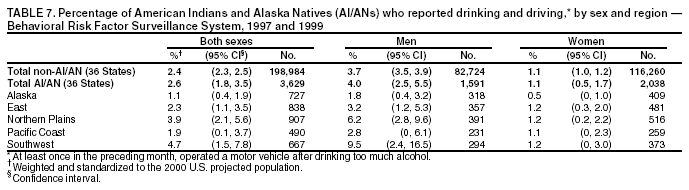
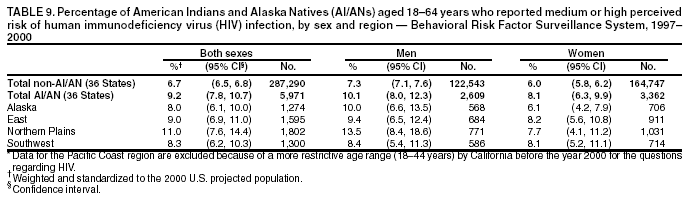
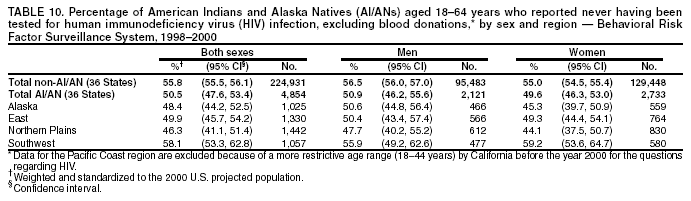
Persons using assistive technology might not be able to fully access information in this file. For assistance, please send e-mail to: mmwrq@cdc.gov. Type 508 Accommodation and the title of the report in the subject line of e-mail. Surveillance for Health Behaviors of American Indians and Alaska NativesFindings from the Behavioral Risk Factor Surveillance System, 1997-2000Clark H. Denny, Ph.D.1 AbstractProblem/Condition: In the United States, disparities in risks for chronic disease (e.g., diabetes, cardiovascular disease, and cancer) and human immunodeficiency virus (HIV) and acquired immunodeficiency syndrome (AIDS) are evident among American Indians and Alaska Natives (AI/ANs) and other groups. This report summarizes findings from the 1997-2000 Behavioral Risk Factor Surveillance System (BRFSS) for health-status indicators, health-risk behaviors, and HIV testing and perceived risk for HIV infection among AI/ANs, compared with other racial/ethnic groups in five regions of the United States. Reporting Period Covered: 1997-2000. Description of System: BRFSS is a state-based telephone survey of the civilian, noninstitutionalized, adult (i.e., persons aged >18 years) population. For this report, responses from the 36 states covered by the Indian Health Service administrative areas were analyzed. Results: Region and sex-specific variations occurred in the prevalence of high-risk behaviors and health-status indicators. For example, the prevalence of current cigarette smoking ranged from 21.2% in the Southwest to 44.1% in the Northern Plains, and the awareness of diabetes was lower in Alaska than in other regions. Men were more likely than women to report binge drinking and drinking and driving. For the majority of health behaviors and status measures, AI/ANs were more likely than respondents of other racial/ethnic groups to be at increased risk. For example, AI/ANs were more likely than respondents of other racial/ethnic groups to report obesity (23.9% versus 18.7%) and no leisure-time physical activity (32.5% versus 27.5%). Interpretation: The 1997-2000 BRFSS data demonstrate that health behaviors vary regionally among AI/ANs and by sex. The data also reveal disparities in health behaviors between AI/ANs and other racial/ethnic groups. The reasons for these differences by region and sex, and for the racial/ethnic disparities, are subjects for further study. However, such patterns should be monitored through continued surveillance, and the data should be used to guide prevention and research activities. For example, states with substantial AI/AN populations, and certain tribes, have successfully used BRFSS data to develop and monitor diabetes and tobacco prevention and control programs. Public Health Actions: Federal and state agencies, tribes, Indian health boards, and urban Indian health centers will continue to use BRFSS data to develop and guide public health programs and policies. The BRFSS data will also be used to monitor progress in eliminating racial and ethnic health disparities. Regional Indian health boards, tribal epidemiology centers, and Indian Health Service Area Offices can use the findings of this report to prioritize interventions to prevent specific health problems in their geographic areas. Moreover, tribes and other institutions that promote AI/AN health care can use the report to document health needs when applying for resources. IntroductionOnly 50 years ago, infectious diseases, malnutrition, and infant mortality were the leading health problems for American Indian and Alaska Native (AI/AN) populations (1). Because of advances in sanitation and improved access to food and modern medical care, those problems have been reduced, but not eliminated. Modern diseases (e.g., diabetes) are on the rise. These modern or chronic diseases are in turn related to multiple factors that might be cultural, genetic, socioeconomic, or behavioral (2-4). In this report, we examine different behavioral factors that substantially affect the development of chronic disease among AI/ANs. Tobacco use, once common only in religious ceremonies, now is higher among AI/ANs than any other major racial or ethnic group in the United States (5,6). In an era when subsistence farming and hunting are no longer feasible, traditional patterns of diet and exercise have been superceded by high fat food and a sedentary lifestyle (7). Approximately 25% of AI/ANs live in poverty (8). High rates of alcohol abuse compound both social and health problems (9,10). The consequences of these changes are evident: heart disease and cancer are now the two leading causes of death, and the prevalence of diabetes and its complications are higher among AI/ANs compared with the general population (9). Chronic renal failure has become so common that, although limited in size, certain Indian Health Service facilities have their own dialysis units. Rates of two other modern diseases, human immunodeficiency virus (HIV) infection and hepatitis C, are beginning to rise among AI/AN communities, and the Indian health-care system might not have the resources to provide adequate treatment (11; J. Redd, M.D., Indian Health Service, Albuquerque, New Mexico, personal communication, 2003). The Behavioral Risk Factor Surveillance System (BRFSS) provides a reliable mechanism for tracking the behavior patterns that increase the risk for these health problems. Although the sample is limited in size, aggregating states and multiple years can provide adequate data to monitor the causes of the most substantial health disparities for AI/ANs. This report provides a summary of 4 years of survey data for AI/AN respondents to BRFSS. MethodsSamplingThe methods of BRFSS are published in detail elsewhere (12). Briefly, data are collected monthly through telephone interviews of the adult (persons aged >18 years) population in each state by using a multistage design based on random-digit-dialing methods. The samples represent each state's civilian, noninstitutionalized, adult population. This report is based on data from the 36 states covered by the Indian Health Service (IHS) administrative areas for the years 1997-2000 (9) (Figure 1). Identification as AI/AN was based on response to the question, "What is your race?" During the 4-year period, the total number of respondents was 437,991. Of these, the number who self-identified as AI/AN was 7,862 (1.8%); the 1990 census figure for adults and children for the 36 states is 1.0% for AI/ANs (13). QuestionnaireBRFSS includes a core set of questions asked in all participating states each year and a set of rotating core questions asked every other year. For this analysis, subjects of the core questions for the years 1997-2000 included obesity, smoking, diabetes awareness, Papanicolaou (Pap) test, general health status, and perceived risk of HIV infection. The HIV test question changed in 1998 and therefore is analyzed only for the years 1998-2000. The physical activity rotating core question was asked in 1998 and 2000. In 1997 and 1999, questions regarding binge drinking and drinking and driving were asked. Because of different wording of the Pap test question and a more restrictive age range for the HIV questions before the year 2000, California data regarding these topics were not comparable with data from other states. Consequently, the Pacific Coast region was excluded from analyses for these questions. Language BarriersBRFSS is conducted in English and in Spanish in states in which a substantial proportion of the population is Spanish-speaking. If the interviewer determines that the respondent is not proficient in the available languages, the interviewer ends the call and notes language barrier as the reason for not completing the interview. BRFSS does not conduct interviews in Native American languages and therefore might miss a limited number of respondents who do not speak English or Spanish well (14). Data Collection and ProcessingData from each participating state are sent to CDC after monthly interviews are completed. CDC staff edit the data. A computer-assisted telephone-interviewing (CATI) system, which permits direct entry of data into a computer file during an interview, was used in all 36 states during 1997-2000, except in Alabama for the first quarter of 1997 and in New Mexico during 1997-1999. CATI helps reduce errors in data collection by facilitating data coding and entry and by enabling interviewer monitoring. During 1997-2000 in the 36 surveillance states, the median number of completed interviews per year ranged from a low of 2,311 in 1997 to a high of 3,281 in 2000. The methodology of the Council of American Survey Research Organizations (CASRO) (15) was used to derive median response rates, which ranged from 63% in 1997 to 50% in 2000. Response rates decreased in part as a result of changes in technology (e.g., increased screening though caller identification and answering machines) (12,16) (see Discussion). Data Weighting and AnalysisCDC staff aggregate the edited monthly data files to create a yearly sample for each state. Each state's yearly sample is weighted to the respondent's probability of selection and to the age- and sex-specific or race-, age-, and sex-specific population from the most current census data (or intercensal estimates) for the state (17,18). These weighted data were used to estimate the prevalence of risk factors for each state's population. Because of the relatively limited sample size of AI/ANs, multiple years of data were aggregated for these analyses to increase the precision of the prevalence estimates. To make comparisons between AI/ANs and non-AI/ANs in the 36 states, prevalence estimates were age-adjusted to the 2000 projected U.S. population (19). SUDAAN, a software package for analyzing complex survey data, was used to calculate the standard errors and the 95% confidence intervals (CI) for the prevalence estimates (20). No statistical testing was performed for comparisons presented in this report; therefore, these findings should be considered descriptive. Data from the AI/AN respondents were aggregated into five geographic regions* (Figure 1). The number of respondents in each geographic region was as follows: Alaska, 1,497; East, 1,920; Northern Plains, 2,085; Pacific Coast, 912; and Southwest, 1,448; 57% of the total respondents were women. ResultsHealth-Status IndicatorsFair or Poor Health Status Respondents were asked to rate their general health as "excellent," "very good," "good," "fair," or "poor." Among AI/AN women, self-perceived fair or poor health status ranged from 18.2% in the Pacific to 26.9% in the East (Table 1). For the total AI/AN population, essentially no difference was observed between men and women in the prevalence of fair or poor health status (23.7% versus 23.9%). Compared with respondents of other racial/ethnic groups (14.6%), AI/AN respondents were more likely to report fair or poor health status (23.8%). Obesity In conformity with the World Health Organization guidelines (21), a body mass index (BMI) of >30 kg/m2 for both men and women is considered obese (22). On the basis of self-reported height and weight, a BMI was calculated for each respondent. Alaska reported the highest prevalence of obesity for both AI/AN men and women (26.9% and 31.1%, respectively) (Table 2) (Figure 2). For the total AI/AN population, the prevalence of obesity was approximately identical for both men and women. AI/AN respondents were more likely to report obesity (23.9%) than respondents of other racial/ethnic groups (18.7%). Awareness of Having Diabetes Diabetes awareness was defined as the respondent ever having been told by a health professional that he or she has diabetes. Among AI/ANs, respondents in Alaska were less likely to report having been told that they had diabetes than respondents in the other four regions (Table 3) (Figure 3). AI/AN respondents were more likely to report awareness of having diabetes (9.7%) than respondents of other racial/ethnic groups (5.7%). Health-Risk BehaviorsCigarette Smoking Cigarette smoking was defined as the respondent having ever smoked >100 cigarettes in his or her life and currently smoking. Cigarette smoking was highest in the Northern Plains (44.1%) and Alaska (39.0%) and lowest in the Southwest (21.2%) (Table 4) (Figure 4). For both AI/AN respondents and those of other racial/ethnic groups, the prevalence of cigarette smoking was higher for men than for women. AI/AN respondents were more likely to report cigarette smoking (32.2%) than respondents of other racial/ethnic groups (22.3%). No Leisure-Time Physical Activity Respondents were also asked whether they engaged in any exercise, recreation, or physical activity other than regular job duties during the previous month. Among AI/ANs, variation was observed by region and by sex (Table 5). For the total AI/AN population, the prevalence of no leisure-time physical activity was slightly greater for men than women (33.6% versus 31.8%). AI/AN respondents reported a lack of leisure-time physical activity more frequently than those of other racial/ethnic groups (32.5% versus 27.5%). Binge Drinking Among AI/AN men, the consumption of >5 alcoholic beverages on >1 occasion during the previous month was highest among men in Alaska (30.7%) and the Southwest (30.5%) and lowest among men in the East (19.0%) (Table 6). Men were more likely than women to report binge drinking in all five regions. AI/AN respondents were slightly more likely to report binge drinking than those of other racial/ethnic groups (23.9% versus 22.0% for men; 8.8% versus 7.4% for women). Drinking and Driving Drinking and driving was defined as having operated a motor vehicle at least once in the previous month when the respondent had had "perhaps too much to drink." AI/AN men in the Southwest reported the highest prevalence of drinking and driving (9.5%) (Table 7). Similar to binge drinking, men were more likely than women to report drinking and driving in all five regions. AI/AN respondents reported approximately the same prevalence of drinking and driving as respondents of other racial/ethnic groups (2.6% versus 2.4%). Screening for Chronic DiseasePap Test The percentage of AI/AN women with an intact uterine cervix who had never had a Pap test ranged from 12.3% in the East to 4.9% in Alaska (Table 8). AI/AN women were more likely to never have had a Pap test than women of other racial/ethnic groups (10.3% versus 6.1%). The prevalence of AI/AN women having had their last Pap test >3 years ago was highest in the East (25.4%) and lowest in Alaska (8.1%), similar to the pattern of regional variation for having never had a Pap test (Table 8). AI/AN women were more likely to report having had their last Pap test >3 years ago than women of other racial/ethnic groups (21.3% versus 15.3%). HIV/Acquired Immunodeficiency Syndrome Perceived HIV Risk. Respondents were asked if their chance of getting infected with HIV was "high," "medium," "low," or "none," as defined by the respondents themselves. Among AI/AN respondents, the prevalence of reporting medium or high perceived risk of HIV infection (versus low or none) ranged from 13.5% for men in the Northern Plains to 6.1% for women in Alaska (Table 9). For the AI/AN population as for other racial/ethnic groups, the prevalence of reporting medium or high perceived risk of HIV infection was slightly greater for men than for women. AI/AN respondents were more likely to indicate that they were at medium or high risk of HIV infection than respondents of other racial/ethnic groups (9.2% versus 6.7%). HIV Testing. Respondents were also asked whether they had ever been tested for HIV. AI/AN respondents in the Southwest were more likely to report never being tested for HIV infection (58.1%), excluding blood donations, than respondents in other regions (Table 10). The prevalence of never being tested was similar for men and women (50.9% versus 49.6%). Respondents of other racial/ethnic groups were more likely to report never being tested for HIV infection than AI/AN respondents (55.8% versus 50.5%). DiscussionBRFSS data in this report demonstrate substantial variation in the prevalence of health-status indicators and health-risk behaviors among AI/AN adults and between AI/ANs and persons of other racial/ethnic groups. For example, the prevalence of current cigarette smoking among AI/ANs ranged from a low of 21.2% in the Southwest to a high of 44.1% in the Northern Plains. Sex differences were particularly evident for cigarette smoking and alcohol-related behaviors. Racial/ethnic disparities were substantial for general health status, obesity, diabetes, cigarette smoking, leisure-time physical activity, Pap tests, and perceived risk of HIV infection. This report is an update of a previous analysis of AI/AN health behaviors by region based on BRFSS data collected during 1993-1996 (23). A direct comparison of the reports is not possible because, unlike this analysis, estimates were not age-adjusted. To overcome this problem, data from the earlier report were reanalyzed and adjusted for age. Minimal changes of <2 percentage points were determined in certain estimates, but because of the limited sample sizes, definitive trends cannot be determined (Table 11). Health-related quality of life measures (e.g., self-perceived general health status) identify groups with suboptimal health status and disability (24). They are useful not only in examining general health status, but in assessing progress towards the Healthy People 2010 goals of increasing years of healthy life and eliminating health disparities (25). In this analysis, a substantial difference exists between the prevalence of fair or poor health status between AI/ANs and respondents of other racial/ethnic groups (approximately 10 percentage points), which is similar to findings in other studies (26,27). Cultural differences in understanding and reporting of self-perceived health status might either increase or decrease health-status differences between racial and ethnic groups (e.g. certain groups might stoically deny health problems or be reluctant to report them to strangers, whereas other groups might be reluctant to report good health [28,29]). Obesity increases the risk for certain chronic diseases, including cardiovascular disease and diabetes (22,30,31). Moreover, the prevalence of overweight and obesity has increased for the general U.S. population as well as among AI/ANs (32,33). In all five regions and for both sexes, >20% of AI/ANs reported being obese. Furthermore, these estimates are probably conservative, because respondents tend to underreport weight (34). AI/AN respondents also reported less leisure-time physical activity than other racial/ethnic groups. Physical activity has an inverse relation to obesity, cardiovascular disease, diabetes, and colon cancer (35,36). However, estimates of leisure-time physical activity do not account for work-related physical activity; thus, BRFSS data likely underestimate the total amount of physical activity engaged in by the adult population (37). AI/ANs suffer from a disproportionate burden of disease and a higher rate of mortality as a result of diabetes than the general population (9,38). The prevalence of awareness of having diabetes is higher for AI/ANs than for respondents of other racial/ethnic groups in all regions except Alaska. Other research has demonstrated that the prevalence of diabetes among AI/ANs is increasing in all regions, including Alaska, and even among those persons aged 15-34 years (39,40). BRFSS data related to awareness of having diabetes estimate only the percentage of adults who know they have diabetes and do not provide an estimate of those who are being treated. Moreover, the percentage of adults who actually have diabetes is likely higher because, in certain cases, the respondents are unaware of their health status regarding this condition. In fact, the National Health and Nutrition Examination Survey III reported that for every two U.S. adults with diagnosed diabetes, one person has undiagnosed diabetes (41). Thus, the burden of diabetes for AI/ANs might be even more substantial than can be estimated. Among the major racial/ethnic groups in the United States, AI/ANs report the highest prevalence of current smoking (5,6). Similar to findings of earlier studies (42), high rates of smoking exist in all regions except the Southwest. Although AI/ANs report high rates of smoking, they smoke fewer cigarettes per day than the average smoker (43,44). Tobacco has cultural and spiritual significance among AI/ANs. It is used in sacred ceremonies and for therapeutic purposes (45). These cultural factors should be considered during public health planning. For example, focusing public health interventions on reducing casual and habitual smoking might reduce the incidence of cardiovascular disease and cancer. AI/ANs have higher alcohol-related mortality rates attributable to chronic liver disease, cirrhosis, and unintentional injury than the general population (9,10). Certain unintentional injuries are motor-vehicle-related and result from driving while impaired by alcohol, riding as a passenger with an alcohol-impaired driver, and pedestrian crashes (46-48). Despite the disparities in alcohol-related morbidity and mortality, only slightly higher rates of binge drinking and drinking and driving were determined for AI/ANs than for other racial/ethnic groups. AI/AN women in the East were more likely than women in other regions to report never having had a Pap test and having had their last Pap test >3 years ago. Also, AI/AN women received cervical cancer screenings less frequently than women of other racial/ethnic groups. These regional differences (49) and racial/ethnic disparities (50) confirm the findings of previous studies. Early detection and treatment of cervical dysplasia can reduce mortality from cervical cancer. The Healthy People 2010 objectives of 97% of adult women ever receiving a Pap test and 90% receiving a Pap test in the preceding 3 years might be met by increasing knowledge of and reducing barriers to cervical cancer screening for AI/AN women (25,51,52). Acquired immunodeficiency syndrome (AIDS) incidence rates are higher for AI/ANs than for whites and Asian/Pacific Islanders, but lower than those of blacks and Hispanics (11). Studies that have compared U.S. black, Hispanic, and white adults have found that blacks and Hispanics report higher perceived risk of HIV infection and are more likely to have ever been tested for HIV than whites (53,54). Similar to blacks and Hispanics, AI/ANs reported a slightly higher perceived risk of HIV infection and were more likely to have been tested for HIV (excluding blood donations) than other racial/ethnic groups combined. The data do not indicate why AI/ANs might perceive themselves as being at greater risk for HIV infection or why they are more likely to be tested for HIV than other groups. These differences could be caused by a greater awareness by AI/ANs of their increased risk for AIDS or a result of programs and initiatives (and resources), including provision of HIV counseling and testing, that specifically target minority populations. The findings in this report are subject to certain limitations. First, BRFSS reaches only persons with telephones. Although telephone coverage in the United States is high, approximately 17% of AI/AN households did not have a telephone in 1998 -- a higher percentage compared with other major racial/ethnic groups in the United States (55). Telephone coverage also varies within the AI/AN population. The percentage of households without a telephone was 12% in urban areas and 24% in rural areas in 1998 and 53% on reservations in 1990 (55,56). Furthermore, studies have demonstrated that AI/ANs living in households without telephones might be more at risk for current smoking, infrequent physical activity, and binge drinking than those in households with telephones (57-59). As a result, this analysis is more likely to represent AI/ANs living off-reservation and in urban areas and underestimate the prevalence of certain at-risk health behaviors. However, among AI/ANs, household telephone ownership has increased from an estimated 77% in 1990 to 83% in 1998 (55,60). If this trend continues, respondents to telephone surveys including such minority populations as AI/ANs will be better represented, compared with the general population. Second, response rates decreased from 63% in 1997 to 50% in 2000 in part as a result of changes in technology (e.g., increased screening though caller identification and answering machines) (12,16). Moreover, in response to telemarketing, families might be less likely to answer their telephones. BRFSS is addressing this decline by exploring other methods for contacting respondents (e.g., mailing advance letters to residents to inform them of the survey and including cellular telephones in BRFSS) (12). A third limitation is that BRFSS does not collect information regarding tribal affiliation or reservation residency. Aggregating AI/ANs into geographic regions alone does not account for the diversity of health behaviors among different tribes (1,61). Because of the limited sample sizes, certain regional estimates have relatively large confidence intervals. Furthermore, the estimates derived from low-prevalence behaviors (e.g., drinking and driving) are less precise than those based on moderate or high prevalence behaviors and must be interpreted cautiously. Finally, because the estimates were based on self-reported data, they might be subject to recall and social desirability biases. Despite these limitations, BRFSS has a number of strengths. Unlike national surveys, the number of AI/AN respondents to BRFSS allows for regional estimates, as presented in this report. Moreover, national health-risk estimates from other data sets for the AI/AN population are similar to those for the total respondents in these 36 surveillance states. For example, the Survey of American Indians and Alaska Natives (SAIAN), conducted as part of the 1987 National Medical Expenditure Survey, interviewed persons living in 1,990 AI/AN households on or near federally recognized reservation land or in Alaska tribal areas and who were therefore eligible to receive IHS services. Data from that survey estimated current smoking at 32.8%, which is similar to the 32.2% reported here (95% CI = 29.9-34.4) (62). Similarly, findings based on data from the 1998 National Health Interview Survey (NHIS), which interviewed 197 AI/AN adults, estimated current cigarette smoking at 40% (95% CI = 30.2-49.8) (63). Estimates for the prevalence of diagnosed diabetes were 9.7% (95% CI = 8.3-11.1) from this analysis, 12.2% (95% CI = 9.8-14.6) from the 1987 SAIAN data (64), and 10.9% from the 1996 IHS national outpatient database (65). A systematic review of the evidence for the reliability and validity of BRFSS data has also demonstrated that the majority of measures are of optimal quality and in certain cases are highly reliable and valid (66). Furthermore, BRFSS is the only source of continuously collected population-based information regarding the health of AI/ANs. ConclusionOnly limited health behavior data exist for AI/ANs. National health surveys usually cannot derive estimates for the AI/AN population because they comprise a limited percentage of the general population. Occasionally individual tribes collect health behavior data, and although the data might be used internally, often they are not published or disseminated. As demonstrated in this report, health behaviors of AI/ANs can be estimated by region and by sex by aggregating multiple years of BRFSS data. The information in this report can be used to guide federal and state agencies, tribes, Indian health boards, and Indian urban health centers in developing appropriate preventive programs and evaluating progress towards health goals. This report also is useful in documenting racial disparities, a necessary step to garnering the resources to eliminating them. References
* The five regions are as follows: Alaska = Alaska; East = Alabama, Connecticut, Florida, Kansas, Louisiana, Maine, Massachusetts, Mississippi, New York, North Carolina, Oklahoma, Pennsylvania, Rhode Island, South Carolina, Tennessee, and Texas; Northern Plains = Indiana, Iowa, Michigan, Minnesota, Montana, Nebraska, North Dakota, South Dakota, Wisconsin, and Wyoming; Pacific Coast = California, Idaho, Oregon, Washington; Southwest = Arizona, Colorado, Nevada, New Mexico, and Utah. 2003 Behavioral Risk Factor Surveillance System |
Use of trade names and commercial sources is for identification only and does not imply endorsement by the U.S. Department of
Health and Human Services. |
Disclaimer All MMWR HTML versions of articles are electronic conversions from ASCII text into HTML. This conversion may have resulted in character translation or format errors in the HTML version. Users should not rely on this HTML document, but are referred to the electronic PDF version and/or the original MMWR paper copy for the official text, figures, and tables. An original paper copy of this issue can be obtained from the Superintendent of Documents, U.S. Government Printing Office (GPO), Washington, DC 20402-9371; telephone: (202) 512-1800. Contact GPO for current prices.
**Questions or messages regarding errors in formatting should be addressed to mmwrq@cdc.gov.Page converted: 7/25/2003
|
|
|||||
|
HOME |
ABOUT MMWR |
MMWR SEARCH |
DOWNLOADS |
RSS
|
CONTACT
|
|||||
|
|
|||||
|
This page last reviewed 7/25/2003